Forestville, WI Map & Demographics
Forestville Map
Forestville Overview
$31,668
PER CAPITA INCOME
$83,750
AVG FAMILY INCOME
$61,071
AVG HOUSEHOLD INCOME
24.9%
WAGE / INCOME GAP [ % ]
75.1¢/ $1
WAGE / INCOME GAP [ $ ]
$7,938
FAMILY INCOME DEFICIT
0.40
INEQUALITY / GINI INDEX
558
TOTAL POPULATION
314
MALE POPULATION
244
FEMALE POPULATION
128.69
MALES / 100 FEMALES
77.71
FEMALES / 100 MALES
46.3
MEDIAN AGE
2.7
AVG FAMILY SIZE
2.3
AVG HOUSEHOLD SIZE
282
LABOR FORCE [ PEOPLE ]
60.4%
PERCENT IN LABOR FORCE
2.8%
UNEMPLOYMENT RATE
Forestville Zip Codes
Forestville Area Codes
Income in Forestville
Income Overview in Forestville
Per Capita Income in Forestville is $31,668, while median incomes of families and households are $83,750 and $61,071 respectively.
| Characteristic | Number | Measure |
| Per Capita Income | 558 | $31,668 |
| Median Family Income | 165 | $83,750 |
| Mean Family Income | 165 | $100,154 |
| Median Household Income | 238 | $61,071 |
| Mean Household Income | 238 | $82,402 |
| Income Deficit | 165 | $7,938 |
| Wage / Income Gap (%) | 558 | 24.91% |
| Wage / Income Gap ($) | 558 | 75.09¢ per $1 |
| Gini / Inequality Index | 558 | 0.40 |
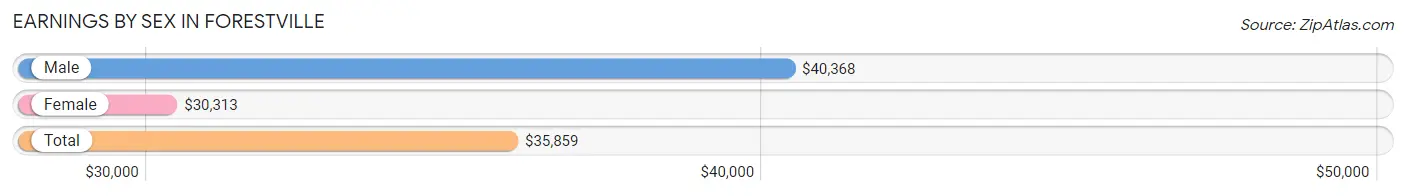
Earnings by Sex in Forestville
Average Earnings in Forestville are $35,859, $40,368 for men and $30,313 for women, a difference of 24.9%.
| Sex | Number | Average Earnings |
| Male | 219 (63.8%) | $40,368 |
| Female | 124 (36.1%) | $30,313 |
| Total | 343 (100.0%) | $35,859 |
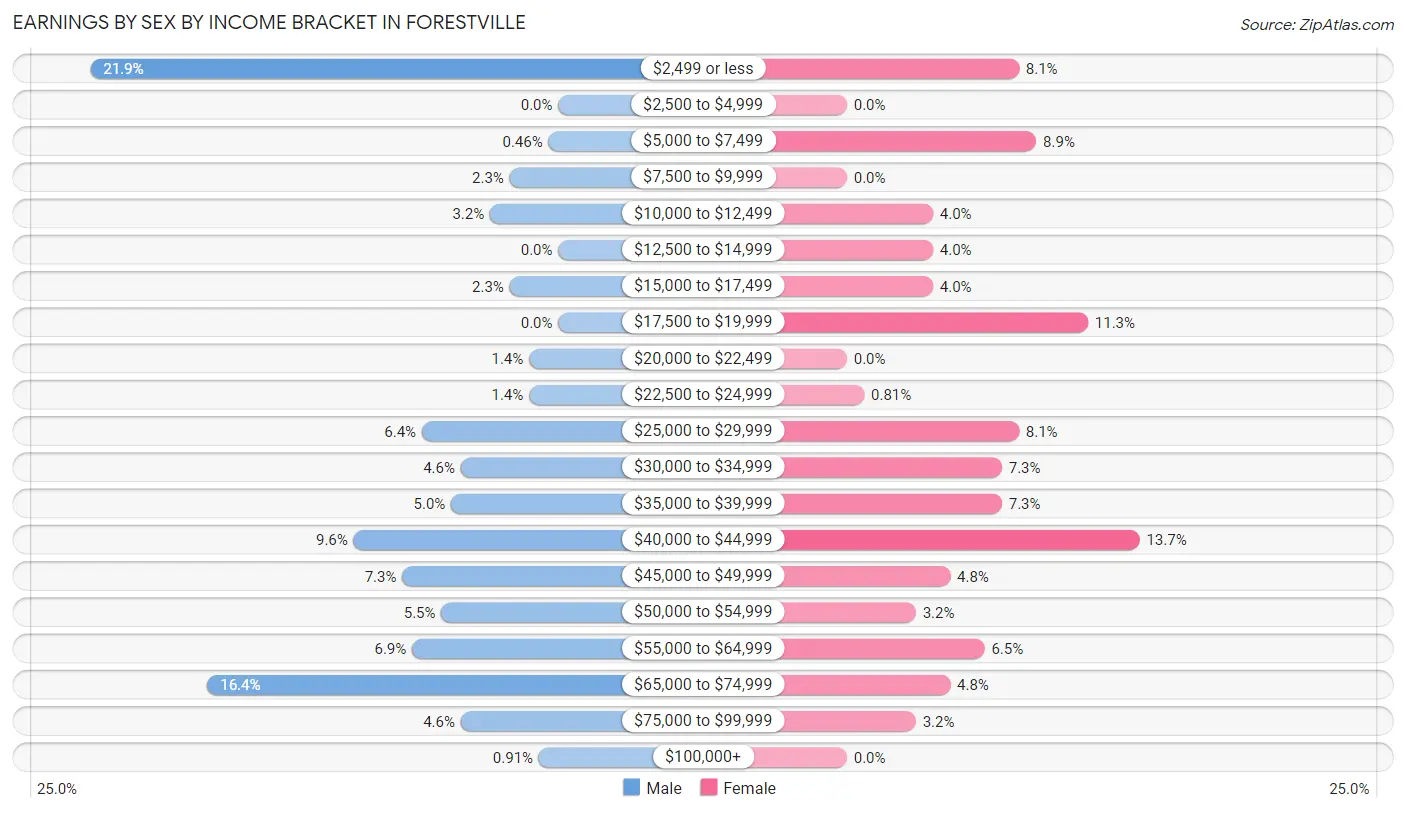
Earnings by Sex by Income Bracket in Forestville
The most common earnings brackets in Forestville are $2,499 or less for men (48 | 21.9%) and $40,000 to $44,999 for women (17 | 13.7%).
| Income | Male | Female |
| $2,499 or less | 48 (21.9%) | 10 (8.1%) |
| $2,500 to $4,999 | 0 (0.0%) | 0 (0.0%) |
| $5,000 to $7,499 | 1 (0.5%) | 11 (8.9%) |
| $7,500 to $9,999 | 5 (2.3%) | 0 (0.0%) |
| $10,000 to $12,499 | 7 (3.2%) | 5 (4.0%) |
| $12,500 to $14,999 | 0 (0.0%) | 5 (4.0%) |
| $15,000 to $17,499 | 5 (2.3%) | 5 (4.0%) |
| $17,500 to $19,999 | 0 (0.0%) | 14 (11.3%) |
| $20,000 to $22,499 | 3 (1.4%) | 0 (0.0%) |
| $22,500 to $24,999 | 3 (1.4%) | 1 (0.8%) |
| $25,000 to $29,999 | 14 (6.4%) | 10 (8.1%) |
| $30,000 to $34,999 | 10 (4.6%) | 9 (7.3%) |
| $35,000 to $39,999 | 11 (5.0%) | 9 (7.3%) |
| $40,000 to $44,999 | 21 (9.6%) | 17 (13.7%) |
| $45,000 to $49,999 | 16 (7.3%) | 6 (4.8%) |
| $50,000 to $54,999 | 12 (5.5%) | 4 (3.2%) |
| $55,000 to $64,999 | 15 (6.9%) | 8 (6.5%) |
| $65,000 to $74,999 | 36 (16.4%) | 6 (4.8%) |
| $75,000 to $99,999 | 10 (4.6%) | 4 (3.2%) |
| $100,000+ | 2 (0.9%) | 0 (0.0%) |
| Total | 219 (100.0%) | 124 (100.0%) |
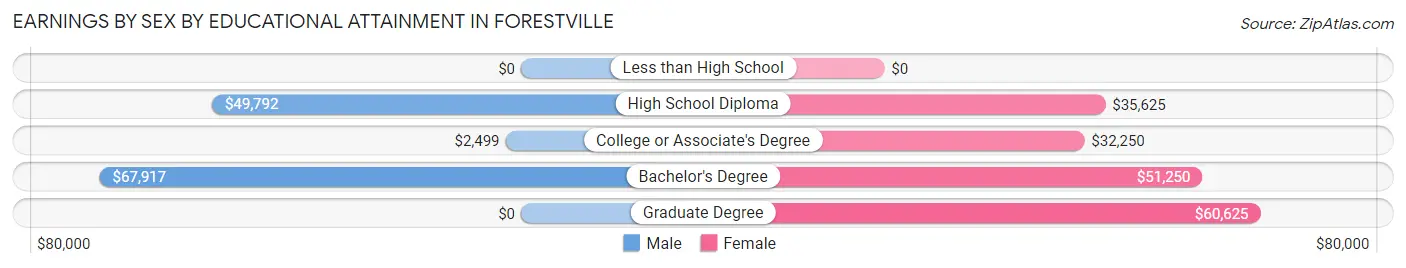
Earnings by Sex by Educational Attainment in Forestville
Average earnings in Forestville are $41,618 for men and $36,250 for women, a difference of 12.9%. Men with an educational attainment of bachelor's degree enjoy the highest average annual earnings of $67,917, while those with college or associate's degree education earn the least with $2,499. Women with an educational attainment of graduate degree earn the most with the average annual earnings of $60,625, while those with college or associate's degree education have the smallest earnings of $32,250.
| Educational Attainment | Male Income | Female Income |
| Less than High School | - | - |
| High School Diploma | $49,792 | $35,625 |
| College or Associate's Degree | $2,499 | $32,250 |
| Bachelor's Degree | $67,917 | $51,250 |
| Graduate Degree | - | - |
| Total | $41,618 | $36,250 |
Family Income in Forestville
Family Income Brackets in Forestville
According to the Forestville family income data, there are 52 families falling into the $75,000 to $99,999 income range, which is the most common income bracket and makes up 31.5% of all families. Conversely, the less than $10,000 income bracket is the least frequent group with only 2 families (1.2%) belonging to this category.
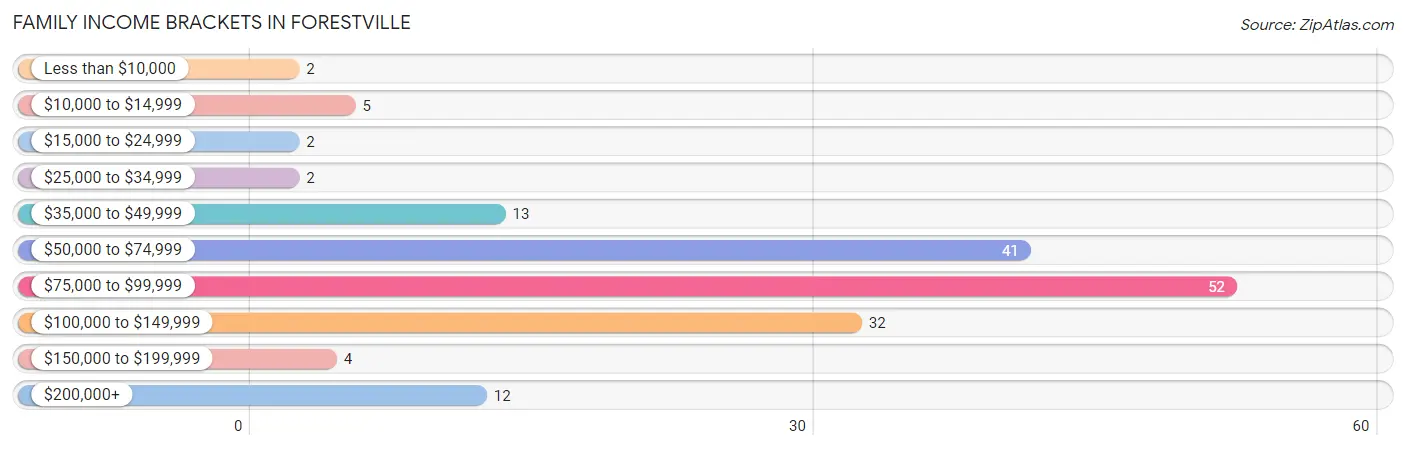
| Income Bracket | # Families | % Families |
| Less than $10,000 | 2 | 1.2% |
| $10,000 to $14,999 | 5 | 3.0% |
| $15,000 to $24,999 | 2 | 1.2% |
| $25,000 to $34,999 | 2 | 1.2% |
| $35,000 to $49,999 | 13 | 7.9% |
| $50,000 to $74,999 | 41 | 24.8% |
| $75,000 to $99,999 | 52 | 31.5% |
| $100,000 to $149,999 | 32 | 19.4% |
| $150,000 to $199,999 | 4 | 2.4% |
| $200,000+ | 12 | 7.3% |
Family Income by Famaliy Size in Forestville
4-person families (19 | 11.5%) account for the highest median family income in Forestville with $98,750 per family, while 2-person families (96 | 58.2%) have the highest median income of $30,714 per family member.
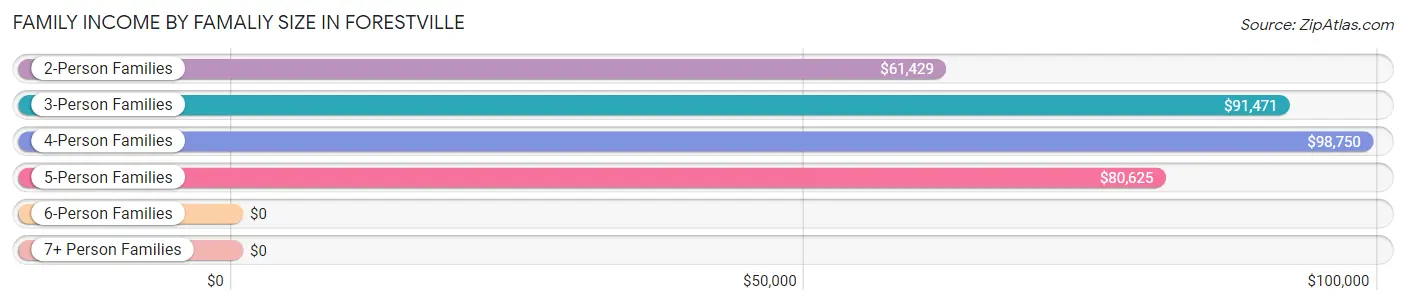
| Income Bracket | # Families | Median Income |
| 2-Person Families | 96 (58.2%) | $61,429 |
| 3-Person Families | 38 (23.0%) | $91,471 |
| 4-Person Families | 19 (11.5%) | $98,750 |
| 5-Person Families | 9 (5.4%) | $80,625 |
| 6-Person Families | 3 (1.8%) | $0 |
| 7+ Person Families | 0 (0.0%) | $0 |
| Total | 165 (100.0%) | $83,750 |
Family Income by Number of Earners in Forestville
The median family income in Forestville is $83,750, with families comprising 2 earners (56) having the highest median family income of $99,583, while families with no earners (10) have the lowest median family income of $57,500, accounting for 33.9% and 6.1% of families, respectively.
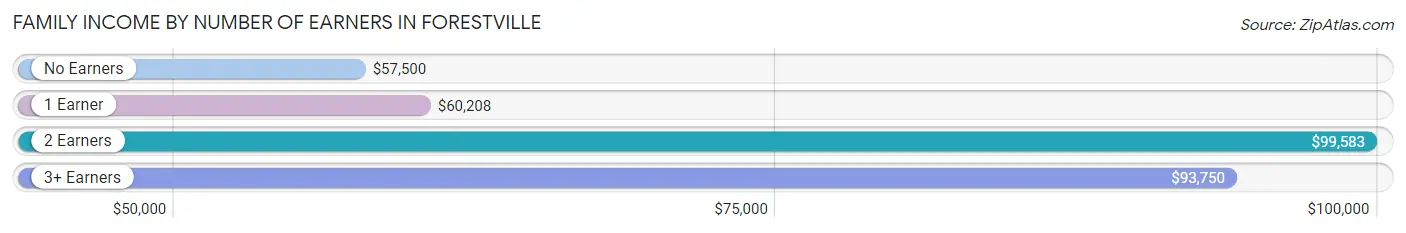
| Number of Earners | # Families | Median Income |
| No Earners | 10 (6.1%) | $57,500 |
| 1 Earner | 85 (51.5%) | $60,208 |
| 2 Earners | 56 (33.9%) | $99,583 |
| 3+ Earners | 14 (8.5%) | $93,750 |
| Total | 165 (100.0%) | $83,750 |
Household Income in Forestville
Household Income Brackets in Forestville
With 56 households falling in the category, the $75,000 to $99,999 income range is the most frequent in Forestville, accounting for 23.5% of all households. In contrast, only 1 households (0.4%) fall into the less than $10,000 income bracket, making it the least populous group.
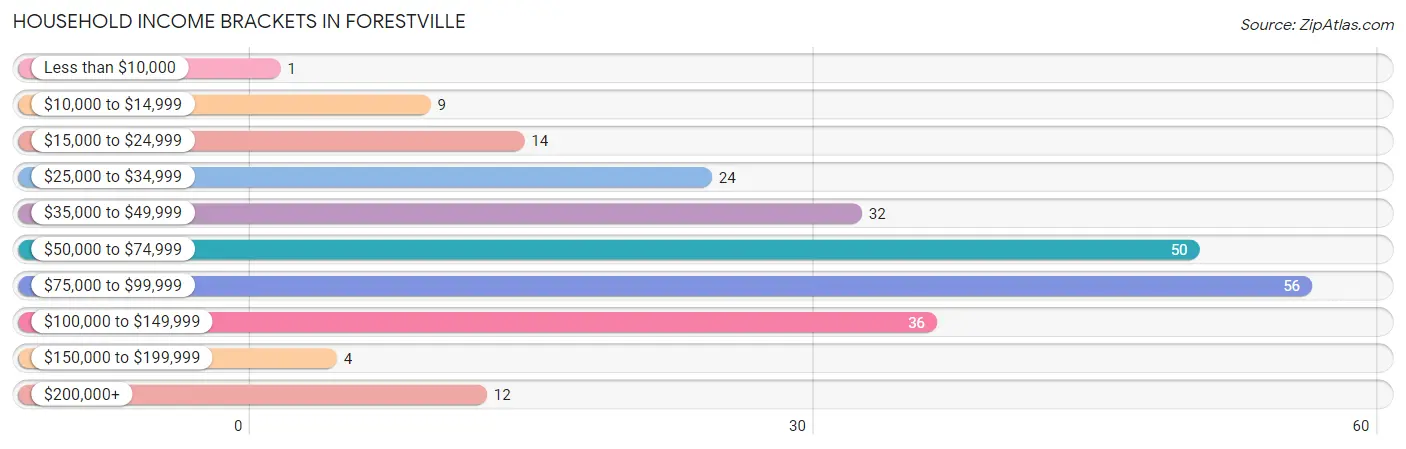
| Income Bracket | # Households | % Households |
| Less than $10,000 | 1 | 0.4% |
| $10,000 to $14,999 | 9 | 3.8% |
| $15,000 to $24,999 | 14 | 5.9% |
| $25,000 to $34,999 | 24 | 10.1% |
| $35,000 to $49,999 | 32 | 13.4% |
| $50,000 to $74,999 | 50 | 21.0% |
| $75,000 to $99,999 | 56 | 23.5% |
| $100,000 to $149,999 | 36 | 15.1% |
| $150,000 to $199,999 | 4 | 1.7% |
| $200,000+ | 12 | 5.0% |
Household Income by Householder Age in Forestville
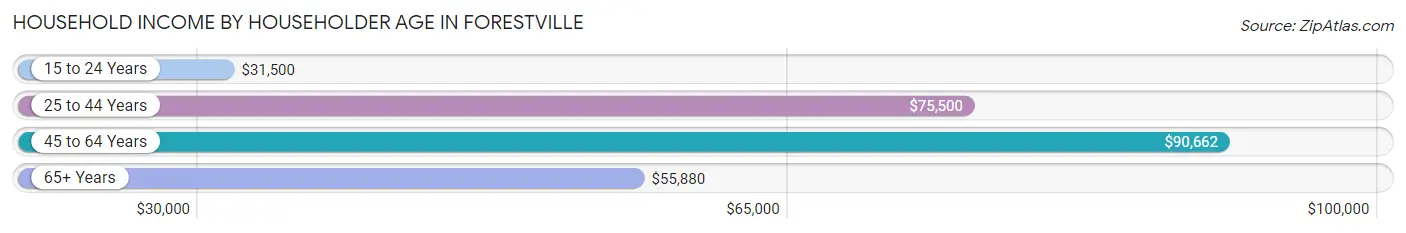
The median household income in Forestville is $61,071, with the highest median household income of $90,662 found in the 45 to 64 years age bracket for the primary householder. A total of 79 households (33.2%) fall into this category. Meanwhile, the 15 to 24 years age bracket for the primary householder has the lowest median household income of $31,500, with 20 households (8.4%) in this group.
| Income Bracket | # Households | Median Income |
| 15 to 24 Years | 20 (8.4%) | $31,500 |
| 25 to 44 Years | 72 (30.2%) | $75,500 |
| 45 to 64 Years | 79 (33.2%) | $90,662 |
| 65+ Years | 67 (28.1%) | $55,880 |
| Total | 238 (100.0%) | $61,071 |
Poverty in Forestville
Income Below Poverty by Sex and Age in Forestville
With 7.3% poverty level for males and 9.0% for females among the residents of Forestville, under 5 year old males and 25 to 34 year old females are the most vulnerable to poverty, with 8 males (61.5%) and 14 females (43.8%) in their respective age groups living below the poverty level.
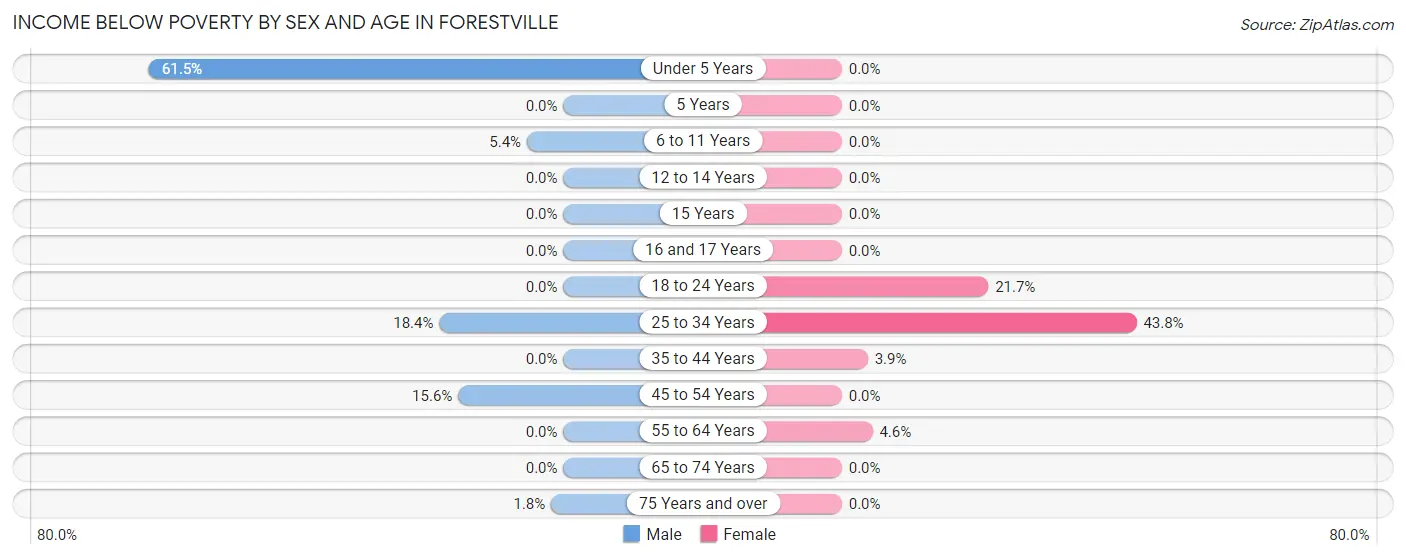
| Age Bracket | Male | Female |
| Under 5 Years | 8 (61.5%) | 0 (0.0%) |
| 5 Years | 0 (0.0%) | 0 (0.0%) |
| 6 to 11 Years | 2 (5.4%) | 0 (0.0%) |
| 12 to 14 Years | 0 (0.0%) | 0 (0.0%) |
| 15 Years | 0 (0.0%) | 0 (0.0%) |
| 16 and 17 Years | 0 (0.0%) | 0 (0.0%) |
| 18 to 24 Years | 0 (0.0%) | 5 (21.7%) |
| 25 to 34 Years | 7 (18.4%) | 14 (43.8%) |
| 35 to 44 Years | 0 (0.0%) | 1 (3.8%) |
| 45 to 54 Years | 5 (15.6%) | 0 (0.0%) |
| 55 to 64 Years | 0 (0.0%) | 2 (4.5%) |
| 65 to 74 Years | 0 (0.0%) | 0 (0.0%) |
| 75 Years and over | 1 (1.8%) | 0 (0.0%) |
| Total | 23 (7.3%) | 22 (9.0%) |
Income Above Poverty by Sex and Age in Forestville
According to the poverty statistics in Forestville, males aged 5 years and females aged under 5 years are the age groups that are most secure financially, with 100.0% of males and 100.0% of females in these age groups living above the poverty line.
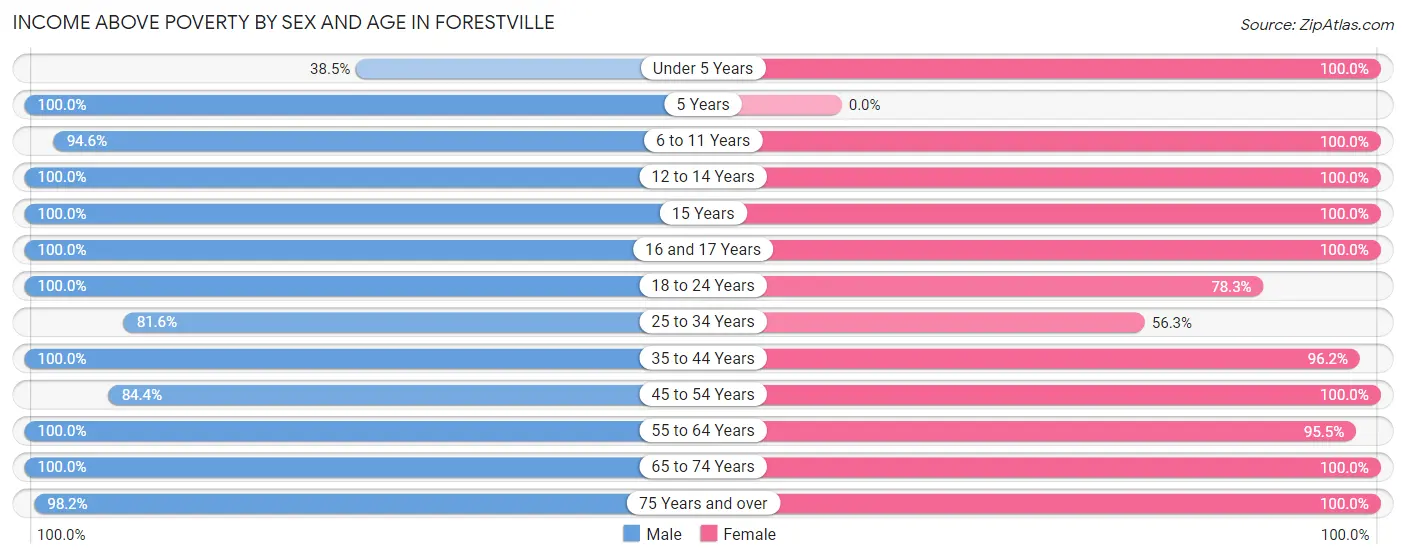
| Age Bracket | Male | Female |
| Under 5 Years | 5 (38.5%) | 11 (100.0%) |
| 5 Years | 1 (100.0%) | 0 (0.0%) |
| 6 to 11 Years | 35 (94.6%) | 5 (100.0%) |
| 12 to 14 Years | 6 (100.0%) | 11 (100.0%) |
| 15 Years | 6 (100.0%) | 1 (100.0%) |
| 16 and 17 Years | 3 (100.0%) | 3 (100.0%) |
| 18 to 24 Years | 19 (100.0%) | 18 (78.3%) |
| 25 to 34 Years | 31 (81.6%) | 18 (56.2%) |
| 35 to 44 Years | 40 (100.0%) | 25 (96.2%) |
| 45 to 54 Years | 27 (84.4%) | 29 (100.0%) |
| 55 to 64 Years | 41 (100.0%) | 42 (95.5%) |
| 65 to 74 Years | 23 (100.0%) | 52 (100.0%) |
| 75 Years and over | 54 (98.2%) | 7 (100.0%) |
| Total | 291 (92.7%) | 222 (91.0%) |
Income Below Poverty Among Married-Couple Families in Forestville
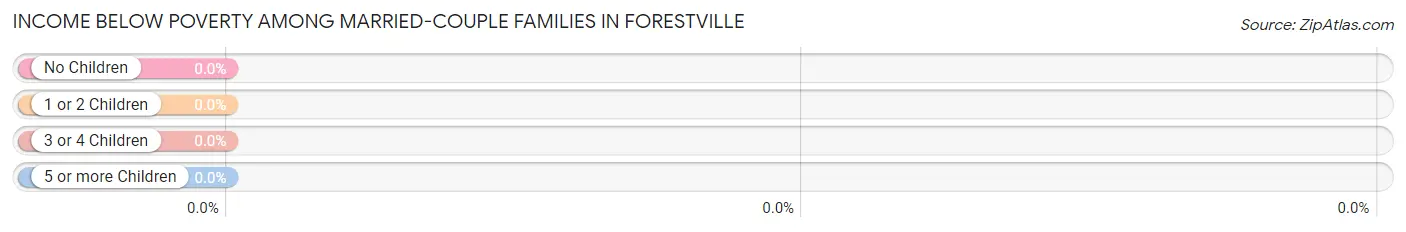
| Children | Above Poverty | Below Poverty |
| No Children | 85 (100.0%) | 0 (0.0%) |
| 1 or 2 Children | 45 (100.0%) | 0 (0.0%) |
| 3 or 4 Children | 7 (100.0%) | 0 (0.0%) |
| 5 or more Children | 0 (0.0%) | 0 (0.0%) |
| Total | 137 (100.0%) | 0 (0.0%) |
Income Below Poverty Among Single-Parent Households in Forestville
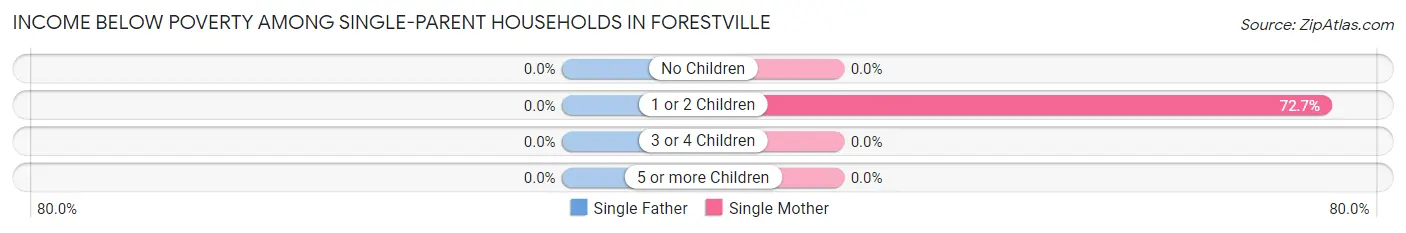
| Children | Single Father | Single Mother |
| No Children | 0 (0.0%) | 0 (0.0%) |
| 1 or 2 Children | 0 (0.0%) | 8 (72.7%) |
| 3 or 4 Children | 0 (0.0%) | 0 (0.0%) |
| 5 or more Children | 0 (0.0%) | 0 (0.0%) |
| Total | 0 (0.0%) | 8 (57.1%) |
Income Below Poverty Among Married-Couple vs Single-Parent Households in Forestville
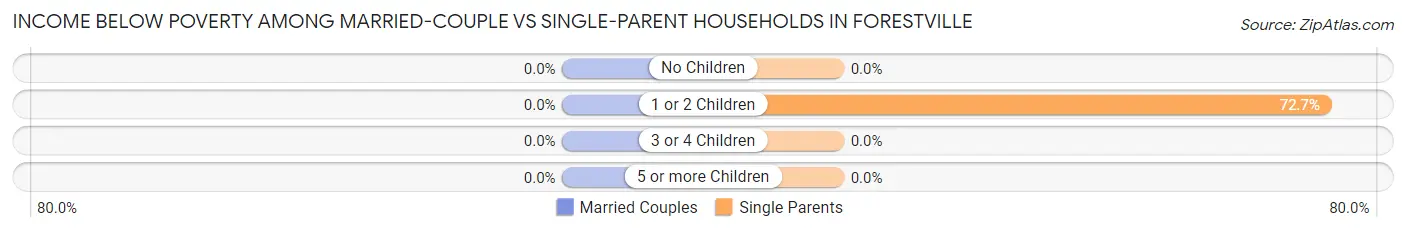
| Children | Married-Couple Families | Single-Parent Households |
| No Children | 0 (0.0%) | 0 (0.0%) |
| 1 or 2 Children | 0 (0.0%) | 8 (72.7%) |
| 3 or 4 Children | 0 (0.0%) | 0 (0.0%) |
| 5 or more Children | 0 (0.0%) | 0 (0.0%) |
| Total | 0 (0.0%) | 8 (28.6%) |
Race in Forestville
The most populous races in Forestville are White / Caucasian (539 | 96.6%), Hispanic or Latino (21 | 3.8%), and Some other Race (14 | 2.5%).
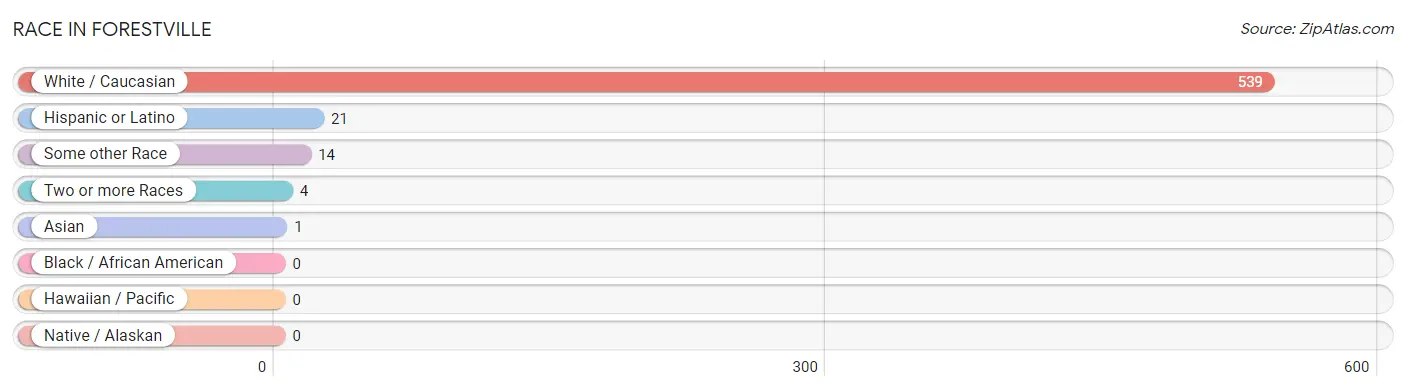
| Race | # Population | % Population |
| Asian | 1 | 0.2% |
| Black / African American | 0 | 0.0% |
| Hawaiian / Pacific | 0 | 0.0% |
| Hispanic or Latino | 21 | 3.8% |
| Native / Alaskan | 0 | 0.0% |
| White / Caucasian | 539 | 96.6% |
| Two or more Races | 4 | 0.7% |
| Some other Race | 14 | 2.5% |
| Total | 558 | 100.0% |
Ancestry in Forestville
The most populous ancestries reported in Forestville are German (263 | 47.1%), Belgian (104 | 18.6%), Irish (74 | 13.3%), Slovak (44 | 7.9%), and Swedish (31 | 5.6%), together accounting for 92.5% of all Forestville residents.
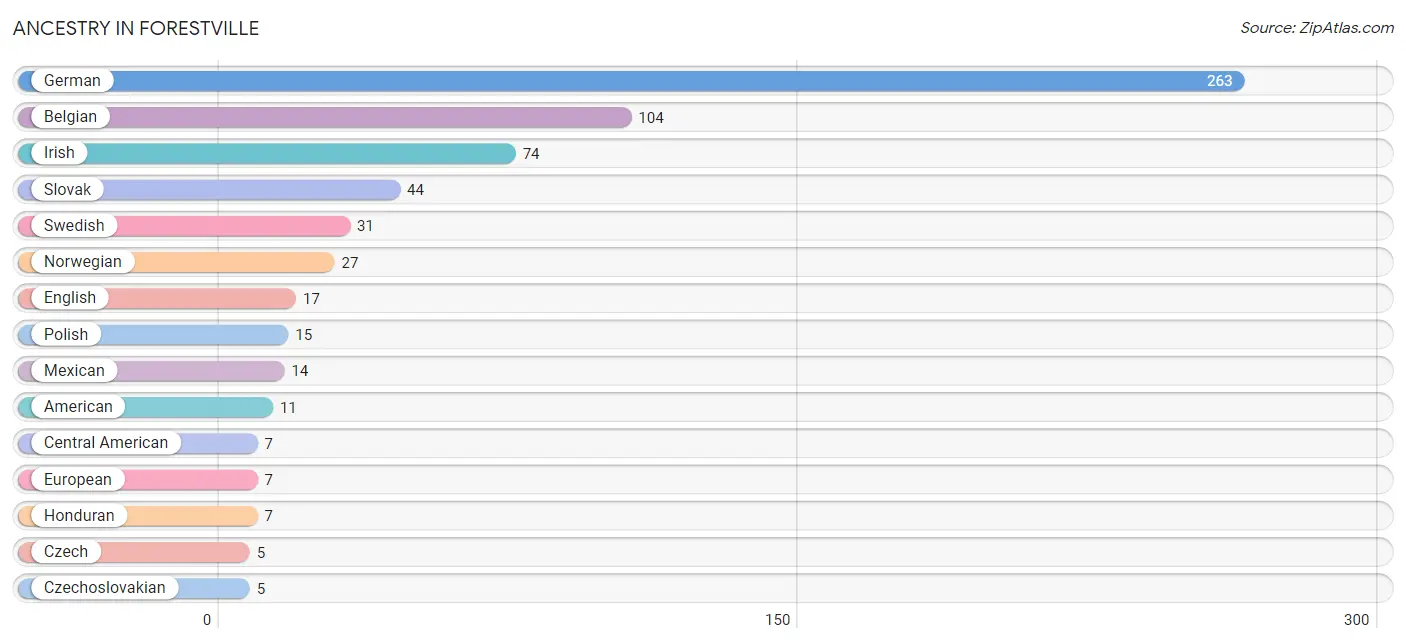
| Ancestry | # Population | % Population |
| American | 11 | 2.0% |
| Belgian | 104 | 18.6% |
| British | 1 | 0.2% |
| Canadian | 1 | 0.2% |
| Central American | 7 | 1.3% |
| Chippewa | 3 | 0.5% |
| Czech | 5 | 0.9% |
| Czechoslovakian | 5 | 0.9% |
| Danish | 4 | 0.7% |
| English | 17 | 3.0% |
| European | 7 | 1.3% |
| Finnish | 1 | 0.2% |
| French | 2 | 0.4% |
| French Canadian | 1 | 0.2% |
| German | 263 | 47.1% |
| Honduran | 7 | 1.3% |
| Irish | 74 | 13.3% |
| Italian | 3 | 0.5% |
| Korean | 1 | 0.2% |
| Mexican | 14 | 2.5% |
| Norwegian | 27 | 4.8% |
| Polish | 15 | 2.7% |
| Russian | 1 | 0.2% |
| Scottish | 2 | 0.4% |
| Slovak | 44 | 7.9% |
| Swedish | 31 | 5.6% |
| Welsh | 3 | 0.5% |
| Yugoslavian | 1 | 0.2% | View All 28 Rows |
Immigrants in Forestville
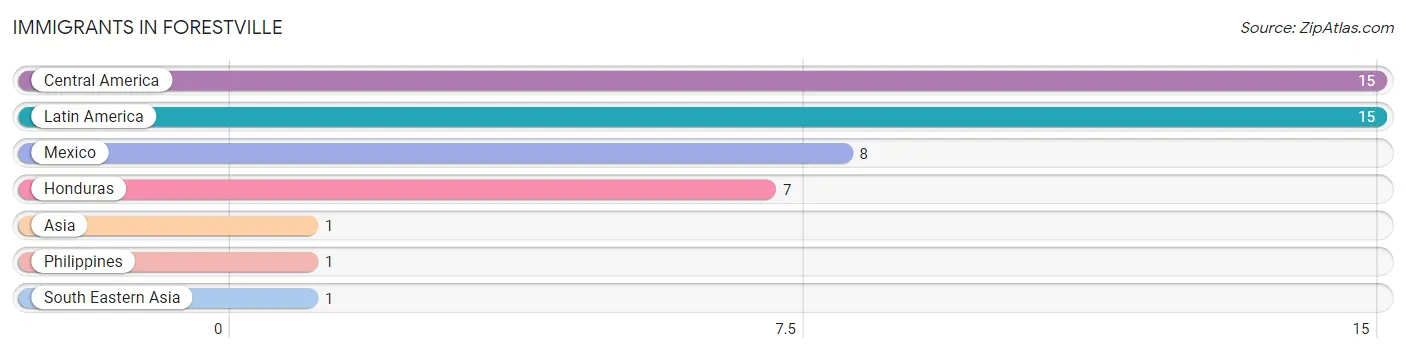
The most numerous immigrant groups reported in Forestville came from Central America (15 | 2.7%), Latin America (15 | 2.7%), Mexico (8 | 1.4%), Honduras (7 | 1.3%), and Asia (1 | 0.2%), together accounting for 8.2% of all Forestville residents.
| Immigration Origin | # Population | % Population |
| Asia | 1 | 0.2% |
| Central America | 15 | 2.7% |
| Honduras | 7 | 1.3% |
| Latin America | 15 | 2.7% |
| Mexico | 8 | 1.4% |
| Philippines | 1 | 0.2% |
| South Eastern Asia | 1 | 0.2% | View All 7 Rows |
Sex and Age in Forestville
Sex and Age in Forestville
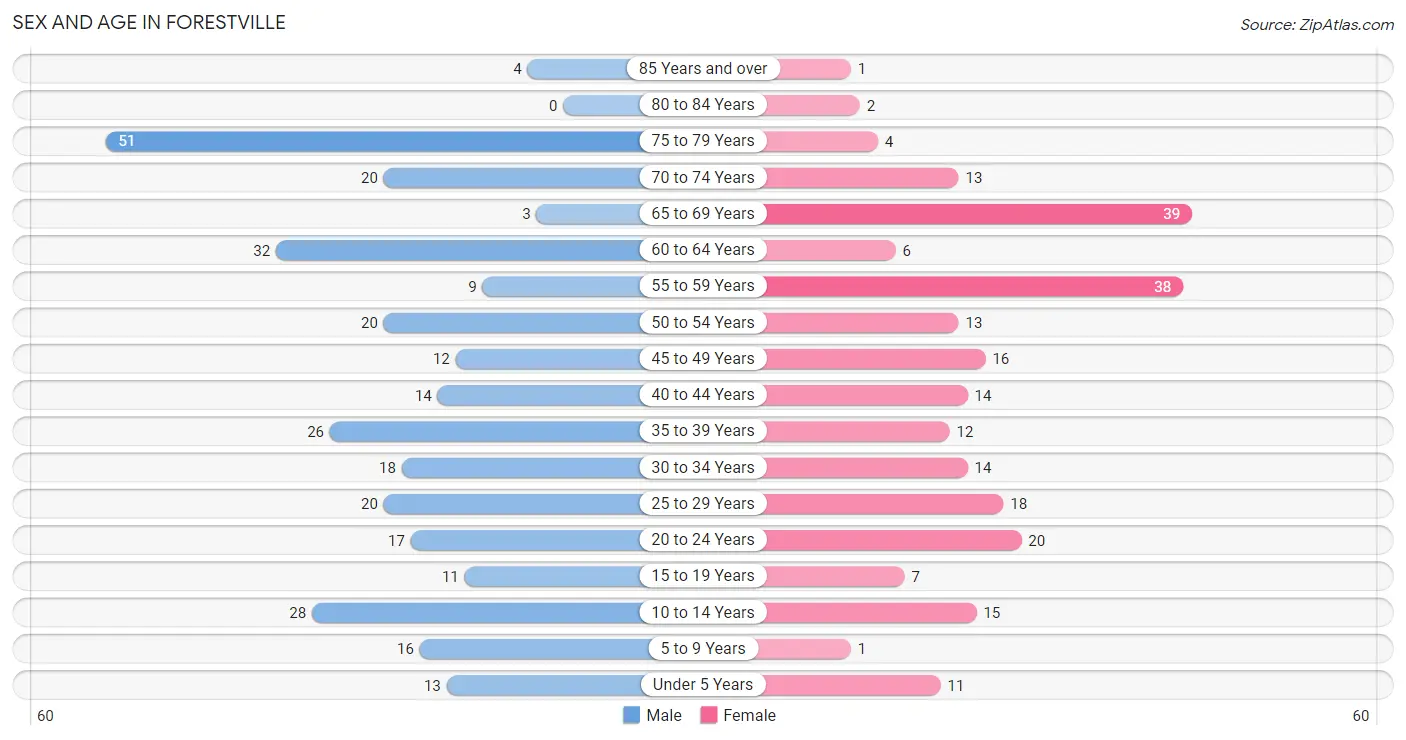
The most populous age groups in Forestville are 75 to 79 Years (51 | 16.2%) for men and 65 to 69 Years (39 | 16.0%) for women.
| Age Bracket | Male | Female |
| Under 5 Years | 13 (4.1%) | 11 (4.5%) |
| 5 to 9 Years | 16 (5.1%) | 1 (0.4%) |
| 10 to 14 Years | 28 (8.9%) | 15 (6.1%) |
| 15 to 19 Years | 11 (3.5%) | 7 (2.9%) |
| 20 to 24 Years | 17 (5.4%) | 20 (8.2%) |
| 25 to 29 Years | 20 (6.4%) | 18 (7.4%) |
| 30 to 34 Years | 18 (5.7%) | 14 (5.7%) |
| 35 to 39 Years | 26 (8.3%) | 12 (4.9%) |
| 40 to 44 Years | 14 (4.5%) | 14 (5.7%) |
| 45 to 49 Years | 12 (3.8%) | 16 (6.6%) |
| 50 to 54 Years | 20 (6.4%) | 13 (5.3%) |
| 55 to 59 Years | 9 (2.9%) | 38 (15.6%) |
| 60 to 64 Years | 32 (10.2%) | 6 (2.5%) |
| 65 to 69 Years | 3 (1.0%) | 39 (16.0%) |
| 70 to 74 Years | 20 (6.4%) | 13 (5.3%) |
| 75 to 79 Years | 51 (16.2%) | 4 (1.6%) |
| 80 to 84 Years | 0 (0.0%) | 2 (0.8%) |
| 85 Years and over | 4 (1.3%) | 1 (0.4%) |
| Total | 314 (100.0%) | 244 (100.0%) |
Families and Households in Forestville
Median Family Size in Forestville
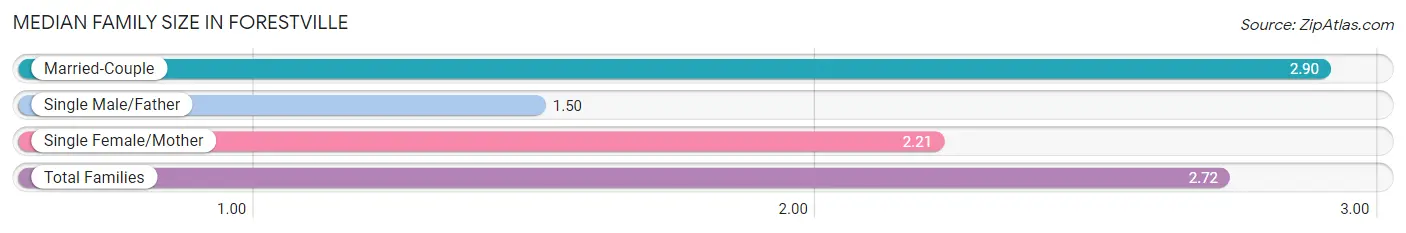
The median family size in Forestville is 2.72 persons per family, with married-couple families (137 | 83.0%) accounting for the largest median family size of 2.9 persons per family. On the other hand, single male/father families (14 | 8.5%) represent the smallest median family size with 1.50 persons per family.
| Family Type | # Families | Family Size |
| Married-Couple | 137 (83.0%) | 2.90 |
| Single Male/Father | 14 (8.5%) | 1.50 |
| Single Female/Mother | 14 (8.5%) | 2.21 |
| Total Families | 165 (100.0%) | 2.72 |
Median Household Size in Forestville
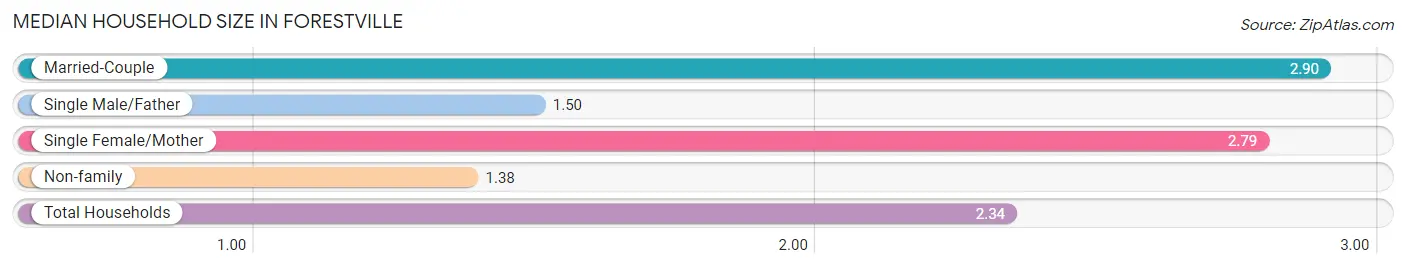
The median household size in Forestville is 2.34 persons per household, with married-couple households (137 | 57.6%) accounting for the largest median household size of 2.9 persons per household. non-family households (73 | 30.7%) represent the smallest median household size with 1.38 persons per household.
| Household Type | # Households | Household Size |
| Married-Couple | 137 (57.6%) | 2.90 |
| Single Male/Father | 14 (5.9%) | 1.50 |
| Single Female/Mother | 14 (5.9%) | 2.79 |
| Non-family | 73 (30.7%) | 1.38 |
| Total Households | 238 (100.0%) | 2.34 |
Household Size by Marriage Status in Forestville
Out of a total of 238 households in Forestville, 165 (69.3%) are family households, while 73 (30.7%) are nonfamily households. The most numerous type of family households are 2-person households, comprising 91, and the most common type of nonfamily households are 1-person households, comprising 62.
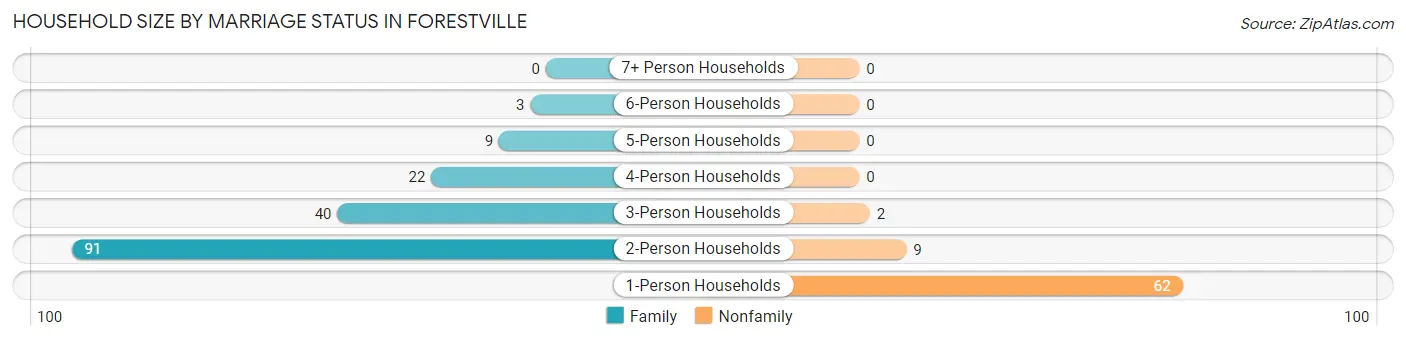
| Household Size | Family Households | Nonfamily Households |
| 1-Person Households | - | 62 (26.1%) |
| 2-Person Households | 91 (38.2%) | 9 (3.8%) |
| 3-Person Households | 40 (16.8%) | 2 (0.8%) |
| 4-Person Households | 22 (9.2%) | 0 (0.0%) |
| 5-Person Households | 9 (3.8%) | 0 (0.0%) |
| 6-Person Households | 3 (1.3%) | 0 (0.0%) |
| 7+ Person Households | 0 (0.0%) | 0 (0.0%) |
| Total | 165 (69.3%) | 73 (30.7%) |
Female Fertility in Forestville
Fertility by Age in Forestville
Average fertility rate in Forestville is 147.0 births per 1,000 women. Women in the age bracket of 20 to 34 years have the highest fertility rate with 192.0 births per 1,000 women. Women in the age bracket of 20 to 34 years acount for 66.7% of all women with births.
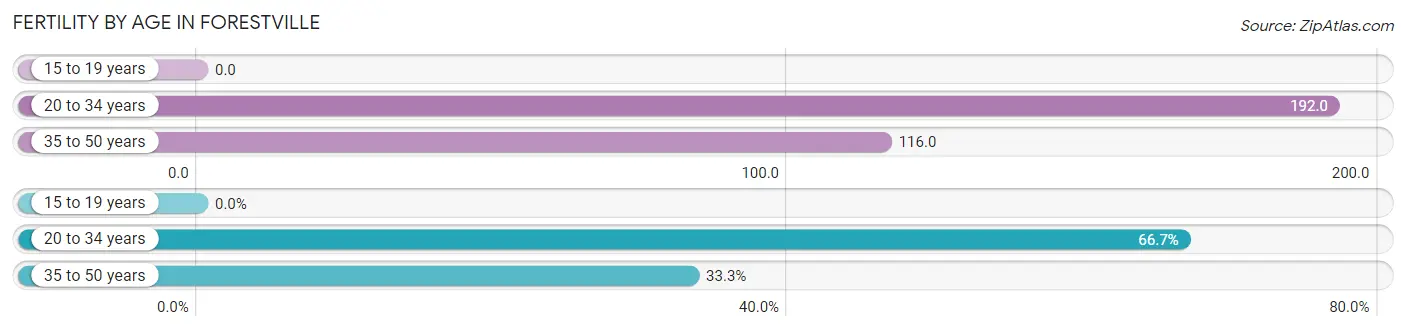
| Age Bracket | Women with Births | Births / 1,000 Women |
| 15 to 19 years | 0 (0.0%) | 0.0 |
| 20 to 34 years | 10 (66.7%) | 192.0 |
| 35 to 50 years | 5 (33.3%) | 116.0 |
| Total | 15 (100.0%) | 147.0 |
Fertility by Age by Marriage Status in Forestville
53.3% of women with births (15) in Forestville are married. The highest percentage of unmarried women with births falls into 20 to 34 years age bracket with 70.0% of them unmarried at the time of birth, while the lowest percentage of unmarried women with births belong to 35 to 50 years age bracket with 0.0% of them unmarried.
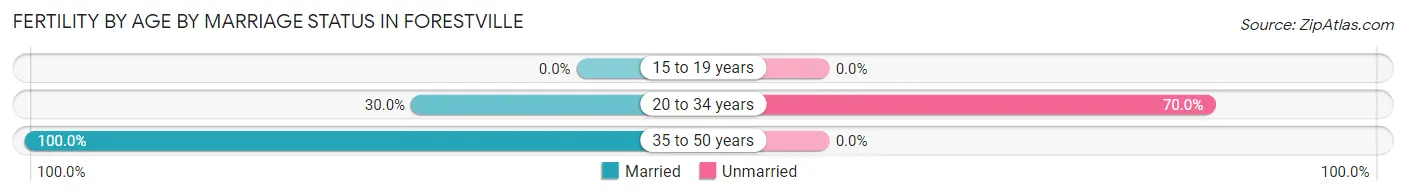
| Age Bracket | Married | Unmarried |
| 15 to 19 years | 0 (0.0%) | 0 (0.0%) |
| 20 to 34 years | 3 (30.0%) | 7 (70.0%) |
| 35 to 50 years | 5 (100.0%) | 0 (0.0%) |
| Total | 8 (53.3%) | 7 (46.7%) |
Fertility by Education in Forestville
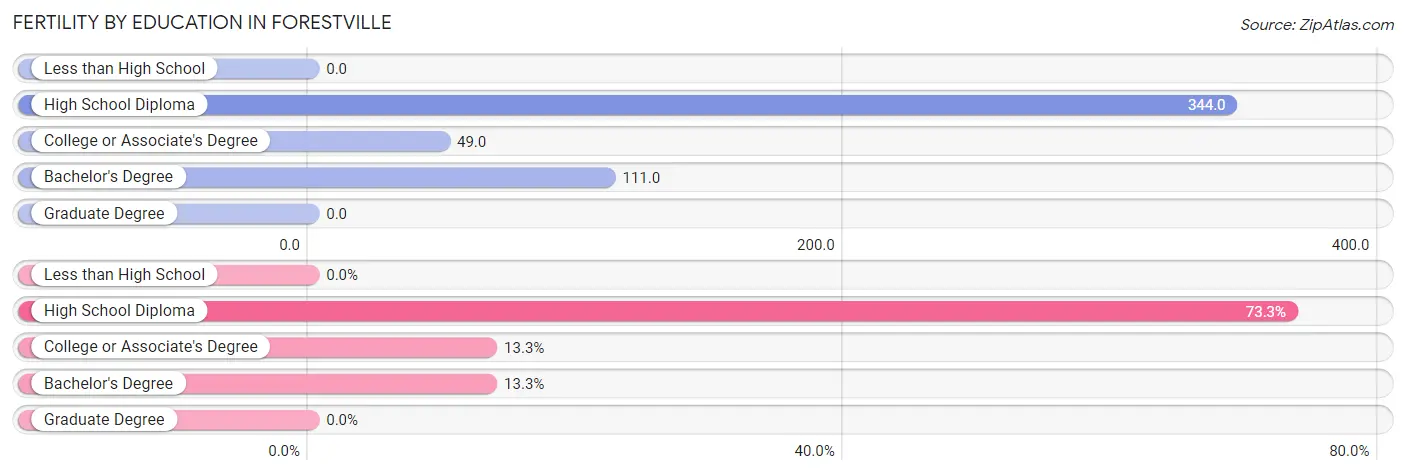
| Educational Attainment | Women with Births | Births / 1,000 Women |
| Less than High School | 0 (0.0%) | 0.0 |
| High School Diploma | 11 (73.3%) | 344.0 |
| College or Associate's Degree | 2 (13.3%) | 49.0 |
| Bachelor's Degree | 2 (13.3%) | 111.0 |
| Graduate Degree | 0 (0.0%) | 0.0 |
| Total | 15 (100.0%) | 147.0 |
Fertility by Education by Marriage Status in Forestville
46.7% of women with births in Forestville are unmarried. Women with the educational attainment of bachelor's degree are most likely to be married with 100.0% of them married at childbirth, while women with the educational attainment of college or associate's degree are least likely to be married with 100.0% of them unmarried at childbirth.
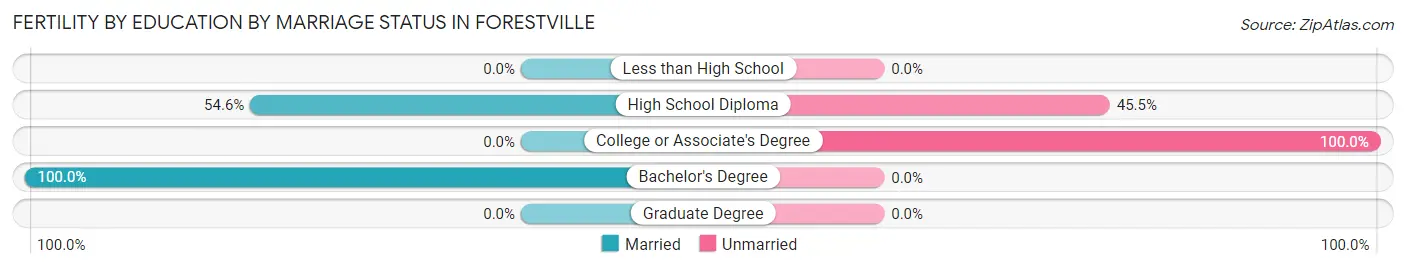
| Educational Attainment | Married | Unmarried |
| Less than High School | 0 (0.0%) | 0 (0.0%) |
| High School Diploma | 6 (54.5%) | 5 (45.5%) |
| College or Associate's Degree | 0 (0.0%) | 2 (100.0%) |
| Bachelor's Degree | 2 (100.0%) | 0 (0.0%) |
| Graduate Degree | 0 (0.0%) | 0 (0.0%) |
| Total | 8 (53.3%) | 7 (46.7%) |
Employment Characteristics in Forestville
Employment by Class of Employer in Forestville
Among the 270 employed individuals in Forestville, private company employees (194 | 71.9%), not-for-profit organizations (25 | 9.3%), and local government employees (22 | 8.2%) make up the most common classes of employment.
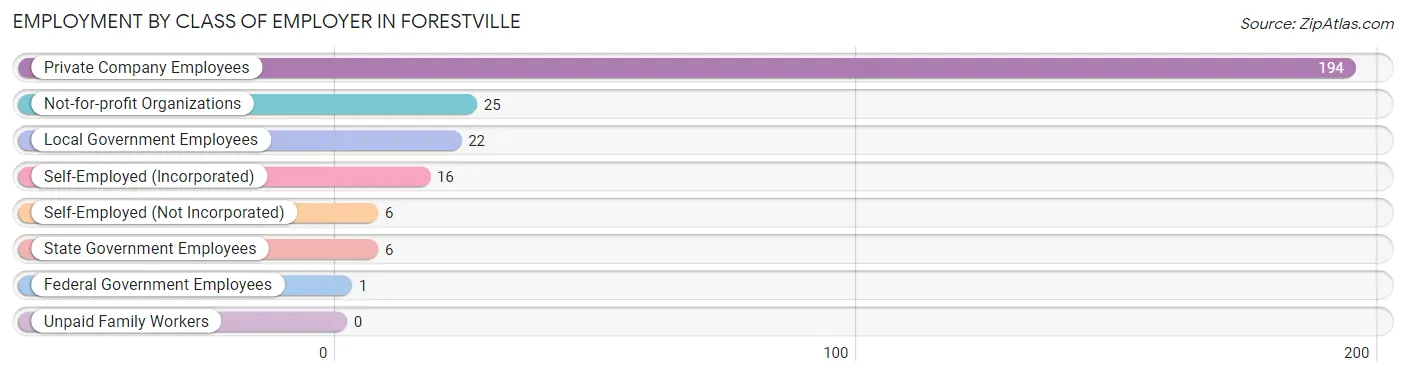
| Employer Class | # Employees | % Employees |
| Private Company Employees | 194 | 71.9% |
| Self-Employed (Incorporated) | 16 | 5.9% |
| Self-Employed (Not Incorporated) | 6 | 2.2% |
| Not-for-profit Organizations | 25 | 9.3% |
| Local Government Employees | 22 | 8.2% |
| State Government Employees | 6 | 2.2% |
| Federal Government Employees | 1 | 0.4% |
| Unpaid Family Workers | 0 | 0.0% |
| Total | 270 | 100.0% |
Employment Status by Age in Forestville
According to the labor force statistics for Forestville, out of the total population over 16 years of age (467), 60.4% or 282 individuals are in the labor force, with 2.8% or 8 of them unemployed. The age group with the highest labor force participation rate is 20 to 24 years, with 97.3% or 36 individuals in the labor force. Within the labor force, the 16 to 19 years age range has the highest percentage of unemployed individuals, with 14.3% or 1 of them being unemployed.
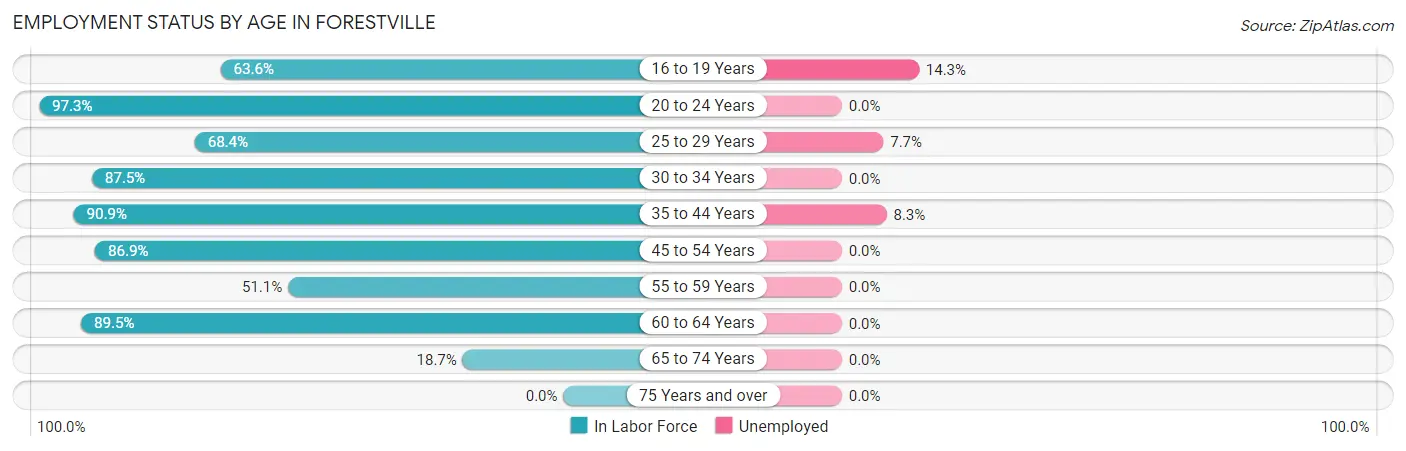
| Age Bracket | In Labor Force | Unemployed |
| 16 to 19 Years | 7 (63.6%) | 1 (14.3%) |
| 20 to 24 Years | 36 (97.3%) | 0 (0.0%) |
| 25 to 29 Years | 26 (68.4%) | 2 (7.7%) |
| 30 to 34 Years | 28 (87.5%) | 0 (0.0%) |
| 35 to 44 Years | 60 (90.9%) | 5 (8.3%) |
| 45 to 54 Years | 53 (86.9%) | 0 (0.0%) |
| 55 to 59 Years | 24 (51.1%) | 0 (0.0%) |
| 60 to 64 Years | 34 (89.5%) | 0 (0.0%) |
| 65 to 74 Years | 14 (18.7%) | 0 (0.0%) |
| 75 Years and over | 0 (0.0%) | 0 (0.0%) |
| Total | 282 (60.4%) | 8 (2.8%) |
Employment Status by Educational Attainment in Forestville
According to labor force statistics for Forestville, 79.8% of individuals (225) out of the total population between 25 and 64 years of age (282) are in the labor force, with 3.1% or 7 of them being unemployed. The group with the highest labor force participation rate are those with the educational attainment of less than high school, with 100.0% or 3 individuals in the labor force. Within the labor force, individuals with bachelor's degree or higher education have the highest percentage of unemployment, with 10.9% or 5 of them being unemployed.
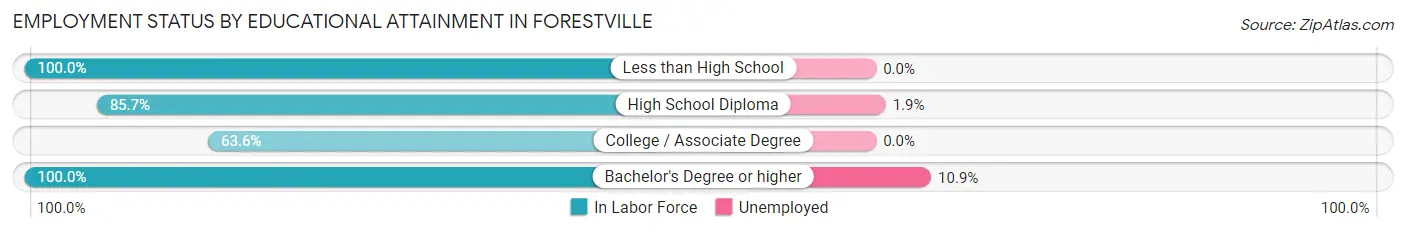
| Educational Attainment | In Labor Force | Unemployed |
| Less than High School | 3 (100.0%) | 0 (0.0%) |
| High School Diploma | 108 (85.7%) | 2 (1.9%) |
| College / Associate Degree | 68 (63.6%) | 0 (0.0%) |
| Bachelor's Degree or higher | 46 (100.0%) | 5 (10.9%) |
| Total | 225 (79.8%) | 9 (3.1%) |
Employment Occupations by Sex in Forestville
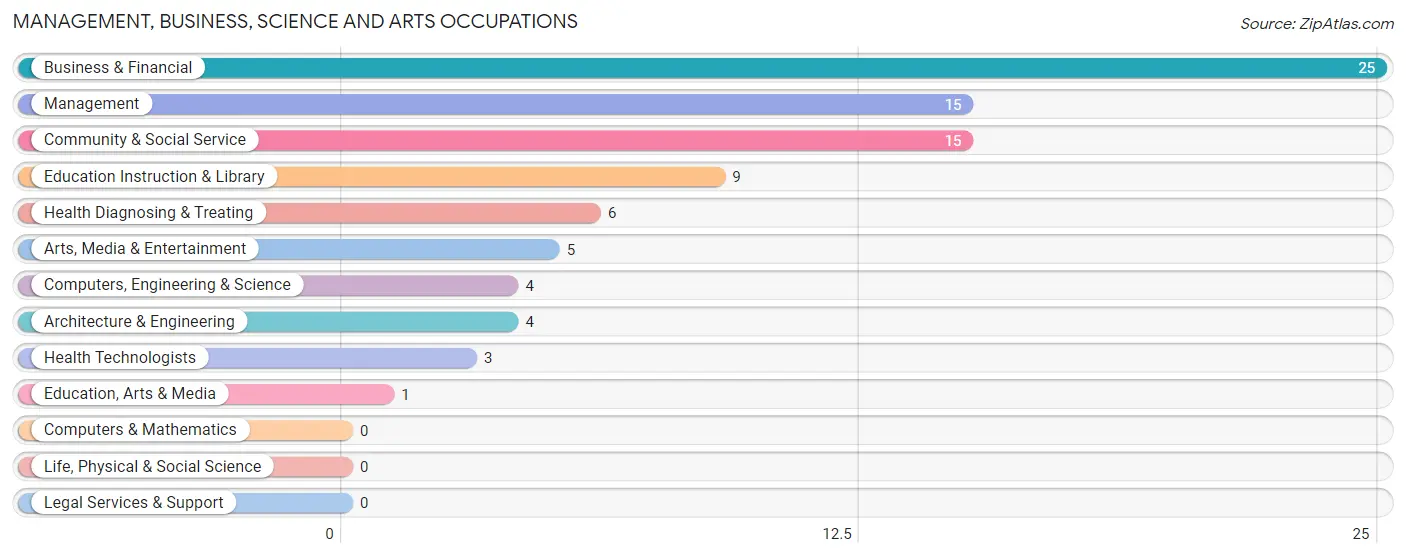
Management, Business, Science and Arts Occupations
The most common Management, Business, Science and Arts occupations in Forestville are Business & Financial (25 | 9.1%), Management (15 | 5.5%), Community & Social Service (15 | 5.5%), Education Instruction & Library (9 | 3.3%), and Health Diagnosing & Treating (6 | 2.2%).
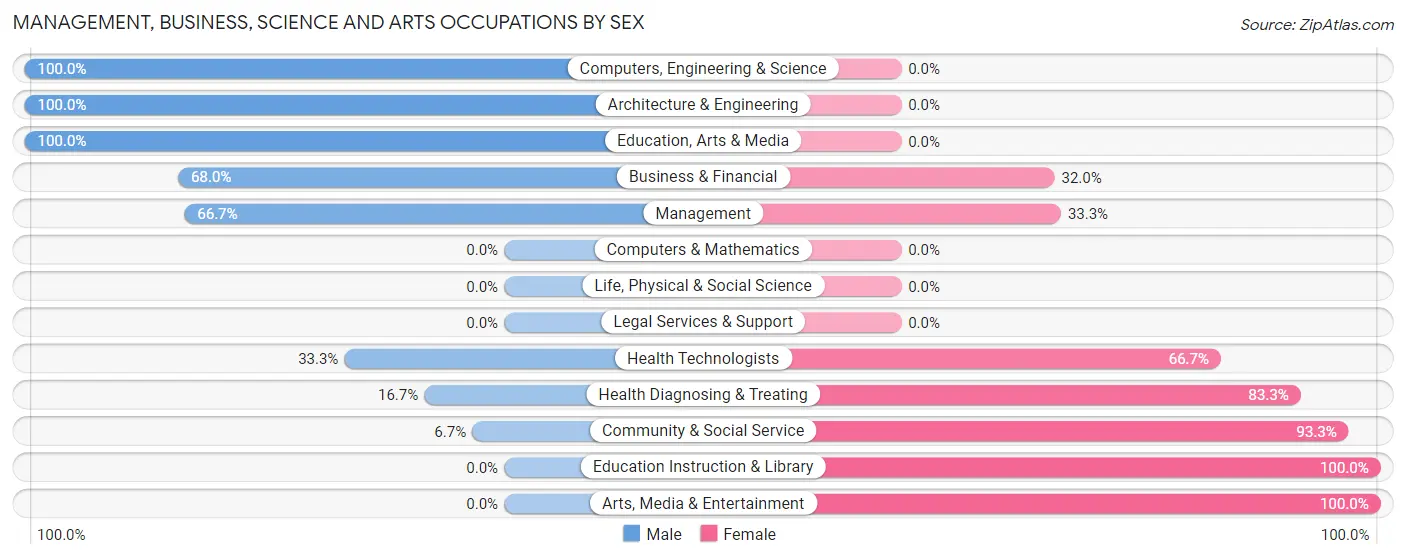
Management, Business, Science and Arts Occupations by Sex
Within the Management, Business, Science and Arts occupations in Forestville, the most male-oriented occupations are Computers, Engineering & Science (100.0%), Architecture & Engineering (100.0%), and Education, Arts & Media (100.0%), while the most female-oriented occupations are Education Instruction & Library (100.0%), Arts, Media & Entertainment (100.0%), and Community & Social Service (93.3%).
| Occupation | Male | Female |
| Management | 10 (66.7%) | 5 (33.3%) |
| Business & Financial | 17 (68.0%) | 8 (32.0%) |
| Computers, Engineering & Science | 4 (100.0%) | 0 (0.0%) |
| Computers & Mathematics | 0 (0.0%) | 0 (0.0%) |
| Architecture & Engineering | 4 (100.0%) | 0 (0.0%) |
| Life, Physical & Social Science | 0 (0.0%) | 0 (0.0%) |
| Community & Social Service | 1 (6.7%) | 14 (93.3%) |
| Education, Arts & Media | 1 (100.0%) | 0 (0.0%) |
| Legal Services & Support | 0 (0.0%) | 0 (0.0%) |
| Education Instruction & Library | 0 (0.0%) | 9 (100.0%) |
| Arts, Media & Entertainment | 0 (0.0%) | 5 (100.0%) |
| Health Diagnosing & Treating | 1 (16.7%) | 5 (83.3%) |
| Health Technologists | 1 (33.3%) | 2 (66.7%) |
| Total (Category) | 33 (50.8%) | 32 (49.2%) |
| Total (Overall) | 165 (60.2%) | 109 (39.8%) |
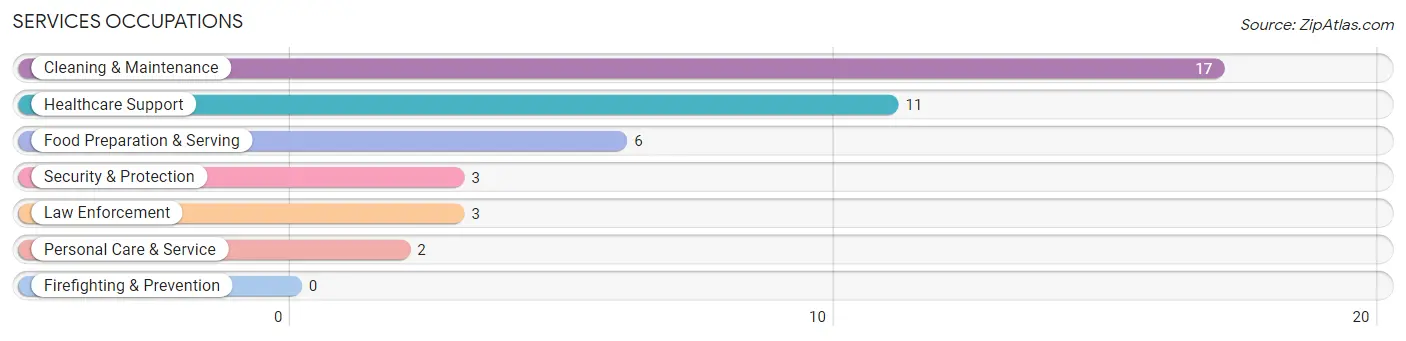
Services Occupations
The most common Services occupations in Forestville are Cleaning & Maintenance (17 | 6.2%), Healthcare Support (11 | 4.0%), Food Preparation & Serving (6 | 2.2%), Security & Protection (3 | 1.1%), and Law Enforcement (3 | 1.1%).
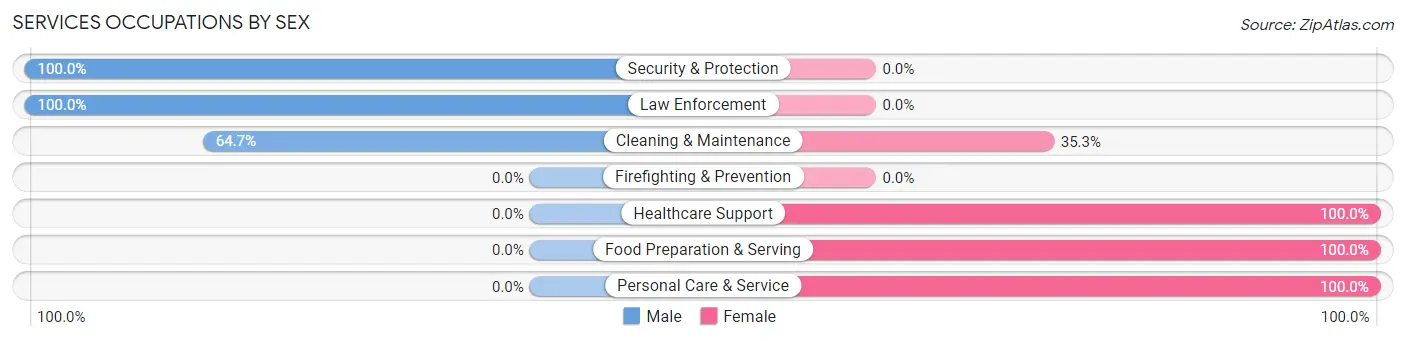
Services Occupations by Sex
Within the Services occupations in Forestville, the most male-oriented occupations are Security & Protection (100.0%), Law Enforcement (100.0%), and Cleaning & Maintenance (64.7%), while the most female-oriented occupations are Healthcare Support (100.0%), Food Preparation & Serving (100.0%), and Personal Care & Service (100.0%).
| Occupation | Male | Female |
| Healthcare Support | 0 (0.0%) | 11 (100.0%) |
| Security & Protection | 3 (100.0%) | 0 (0.0%) |
| Firefighting & Prevention | 0 (0.0%) | 0 (0.0%) |
| Law Enforcement | 3 (100.0%) | 0 (0.0%) |
| Food Preparation & Serving | 0 (0.0%) | 6 (100.0%) |
| Cleaning & Maintenance | 11 (64.7%) | 6 (35.3%) |
| Personal Care & Service | 0 (0.0%) | 2 (100.0%) |
| Total (Category) | 14 (35.9%) | 25 (64.1%) |
| Total (Overall) | 165 (60.2%) | 109 (39.8%) |
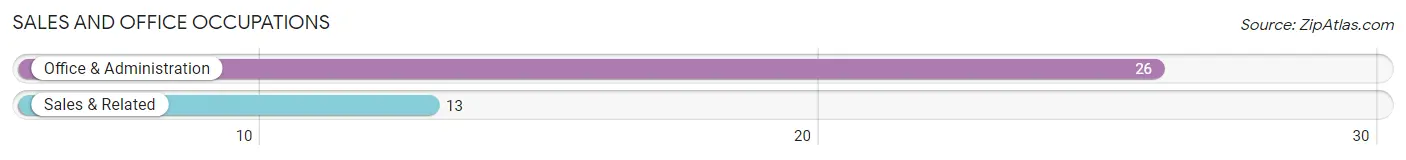
Sales and Office Occupations
The most common Sales and Office occupations in Forestville are Office & Administration (26 | 9.5%), and Sales & Related (13 | 4.7%).
Sales and Office Occupations by Sex
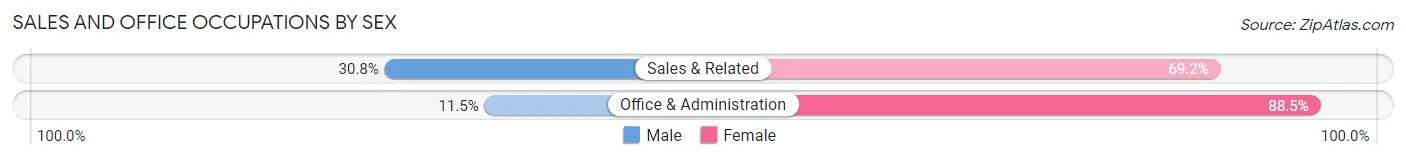
| Occupation | Male | Female |
| Sales & Related | 4 (30.8%) | 9 (69.2%) |
| Office & Administration | 3 (11.5%) | 23 (88.5%) |
| Total (Category) | 7 (17.9%) | 32 (82.1%) |
| Total (Overall) | 165 (60.2%) | 109 (39.8%) |
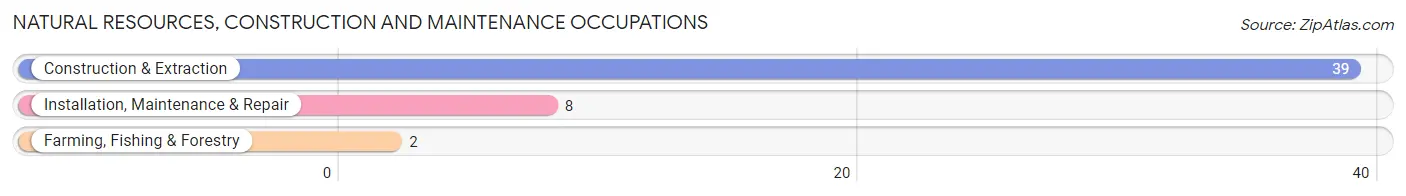
Natural Resources, Construction and Maintenance Occupations
The most common Natural Resources, Construction and Maintenance occupations in Forestville are Construction & Extraction (39 | 14.2%), Installation, Maintenance & Repair (8 | 2.9%), and Farming, Fishing & Forestry (2 | 0.7%).
Natural Resources, Construction and Maintenance Occupations by Sex
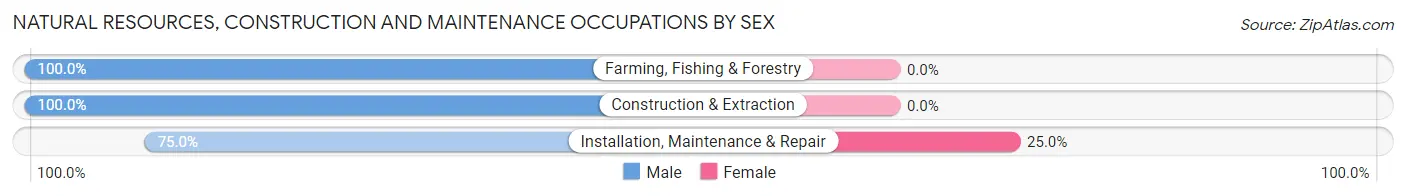
| Occupation | Male | Female |
| Farming, Fishing & Forestry | 2 (100.0%) | 0 (0.0%) |
| Construction & Extraction | 39 (100.0%) | 0 (0.0%) |
| Installation, Maintenance & Repair | 6 (75.0%) | 2 (25.0%) |
| Total (Category) | 47 (95.9%) | 2 (4.1%) |
| Total (Overall) | 165 (60.2%) | 109 (39.8%) |
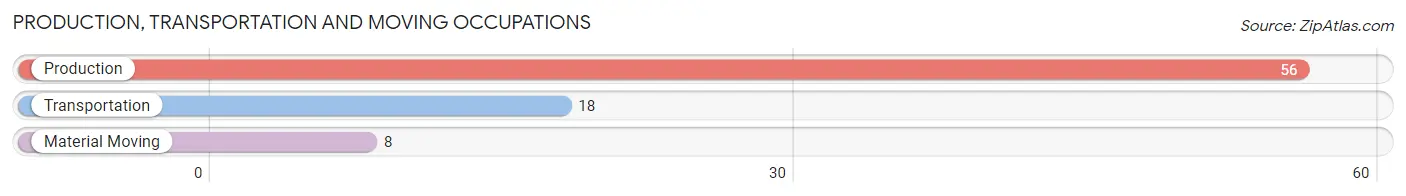
Production, Transportation and Moving Occupations
The most common Production, Transportation and Moving occupations in Forestville are Production (56 | 20.4%), Transportation (18 | 6.6%), and Material Moving (8 | 2.9%).
Production, Transportation and Moving Occupations by Sex
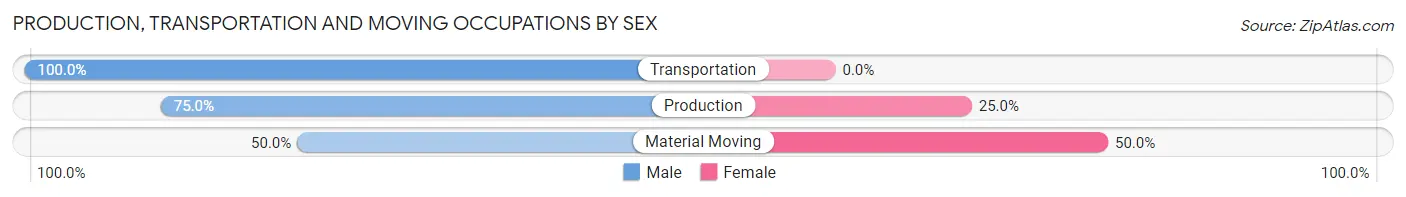
| Occupation | Male | Female |
| Production | 42 (75.0%) | 14 (25.0%) |
| Transportation | 18 (100.0%) | 0 (0.0%) |
| Material Moving | 4 (50.0%) | 4 (50.0%) |
| Total (Category) | 64 (78.0%) | 18 (22.0%) |
| Total (Overall) | 165 (60.2%) | 109 (39.8%) |
Employment Industries by Sex in Forestville
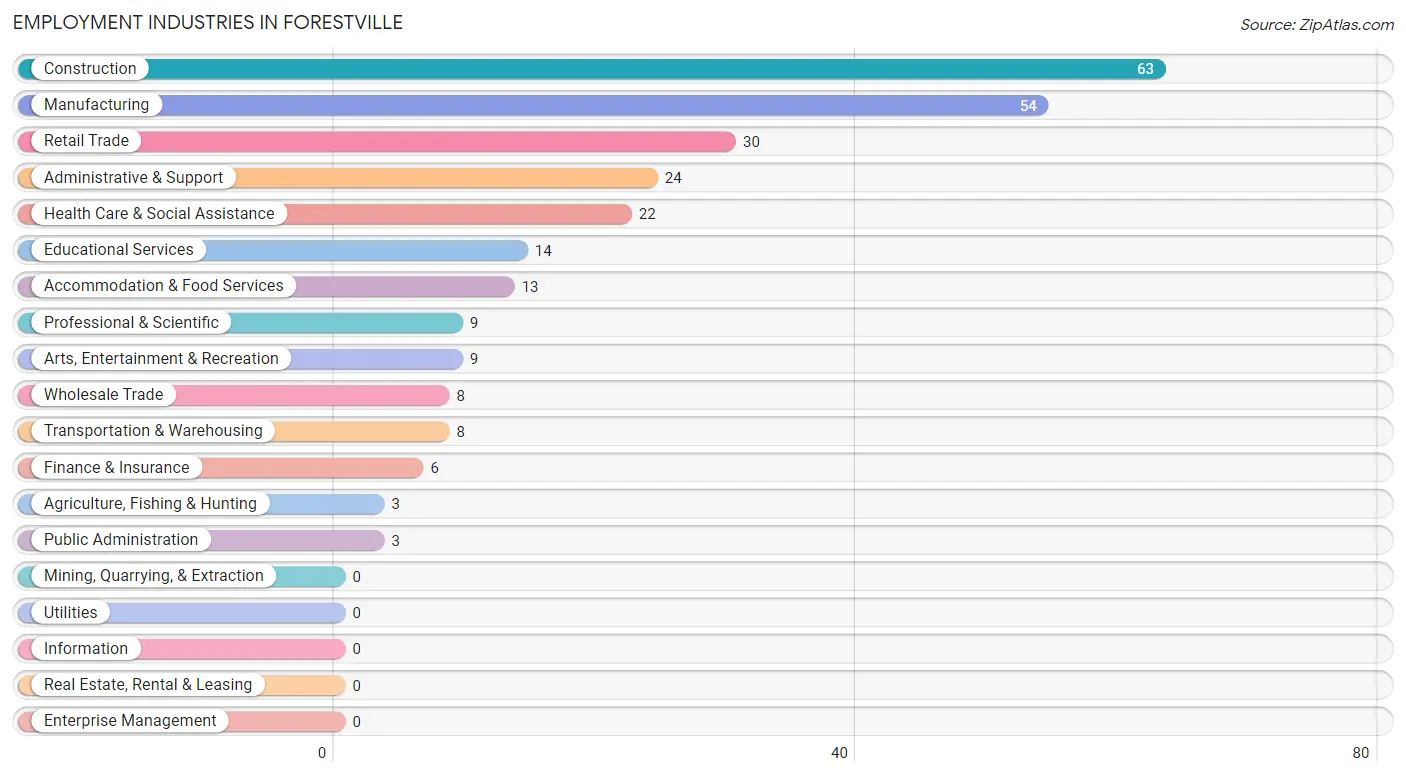
Employment Industries in Forestville
The major employment industries in Forestville include Construction (63 | 23.0%), Manufacturing (54 | 19.7%), Retail Trade (30 | 11.0%), Administrative & Support (24 | 8.8%), and Health Care & Social Assistance (22 | 8.0%).
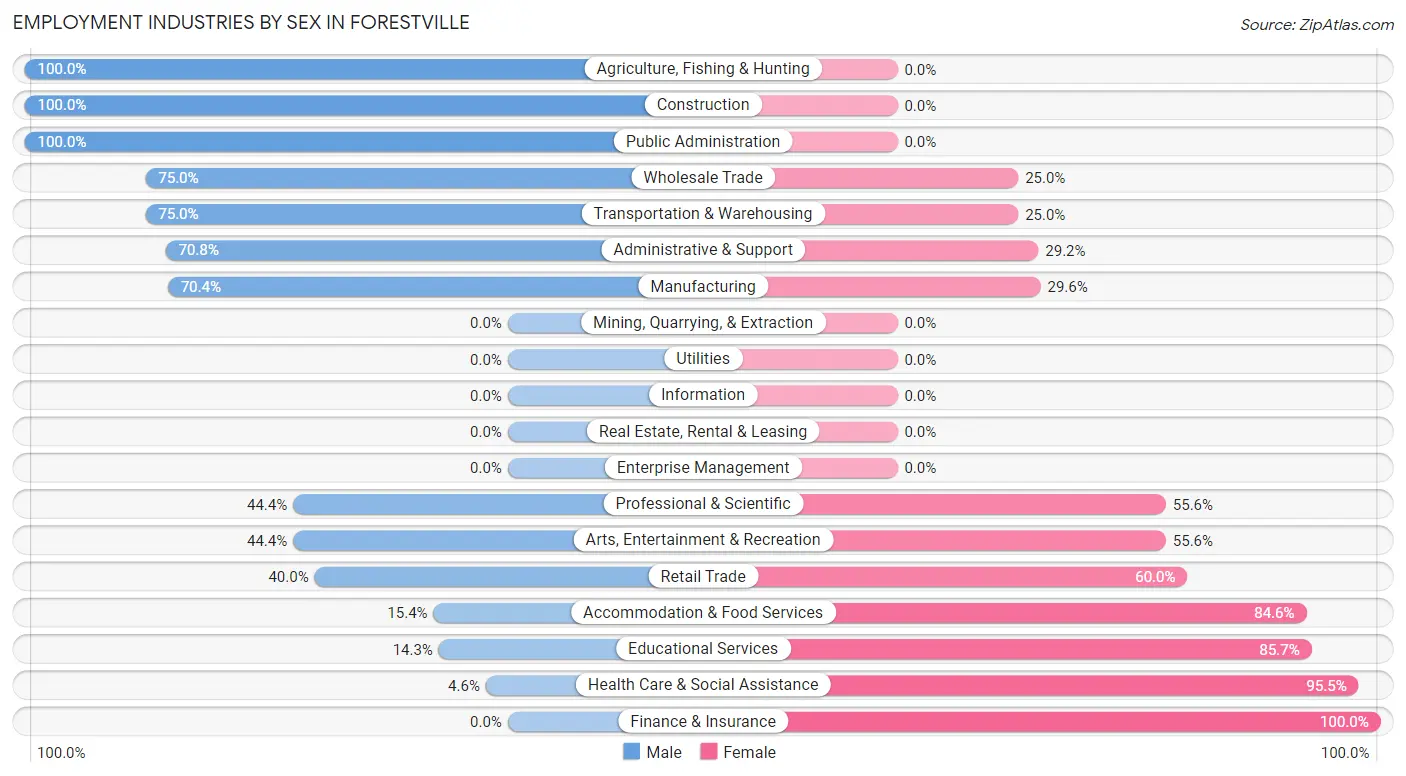
Employment Industries by Sex in Forestville
The Forestville industries that see more men than women are Agriculture, Fishing & Hunting (100.0%), Construction (100.0%), and Public Administration (100.0%), whereas the industries that tend to have a higher number of women are Finance & Insurance (100.0%), Health Care & Social Assistance (95.5%), and Educational Services (85.7%).
| Industry | Male | Female |
| Agriculture, Fishing & Hunting | 3 (100.0%) | 0 (0.0%) |
| Mining, Quarrying, & Extraction | 0 (0.0%) | 0 (0.0%) |
| Construction | 63 (100.0%) | 0 (0.0%) |
| Manufacturing | 38 (70.4%) | 16 (29.6%) |
| Wholesale Trade | 6 (75.0%) | 2 (25.0%) |
| Retail Trade | 12 (40.0%) | 18 (60.0%) |
| Transportation & Warehousing | 6 (75.0%) | 2 (25.0%) |
| Utilities | 0 (0.0%) | 0 (0.0%) |
| Information | 0 (0.0%) | 0 (0.0%) |
| Finance & Insurance | 0 (0.0%) | 6 (100.0%) |
| Real Estate, Rental & Leasing | 0 (0.0%) | 0 (0.0%) |
| Professional & Scientific | 4 (44.4%) | 5 (55.6%) |
| Enterprise Management | 0 (0.0%) | 0 (0.0%) |
| Administrative & Support | 17 (70.8%) | 7 (29.2%) |
| Educational Services | 2 (14.3%) | 12 (85.7%) |
| Health Care & Social Assistance | 1 (4.5%) | 21 (95.5%) |
| Arts, Entertainment & Recreation | 4 (44.4%) | 5 (55.6%) |
| Accommodation & Food Services | 2 (15.4%) | 11 (84.6%) |
| Public Administration | 3 (100.0%) | 0 (0.0%) |
| Total | 165 (60.2%) | 109 (39.8%) |
Education in Forestville
School Enrollment in Forestville
The most common levels of schooling among the 100 students in Forestville are middle school (34 | 34.0%), high school (21 | 21.0%), and college / undergraduate (20 | 20.0%).
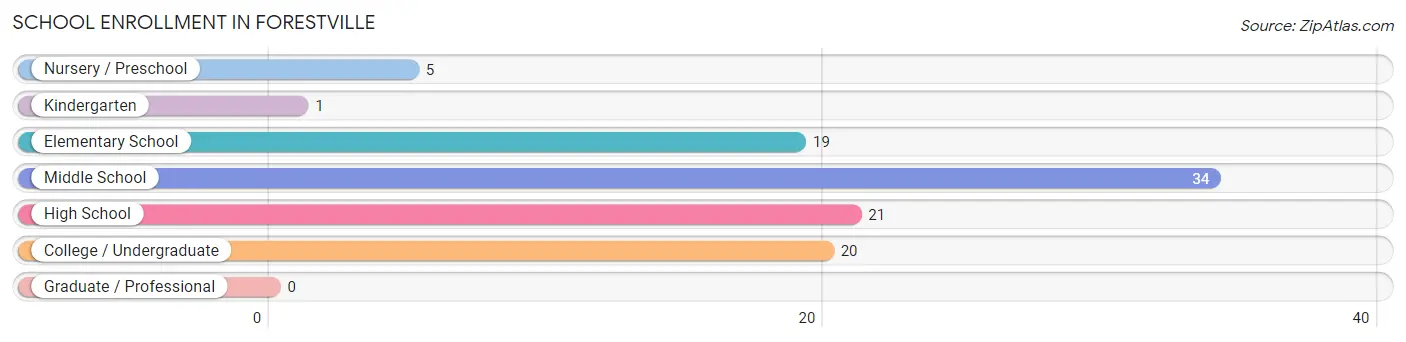
| School Level | # Students | % Students |
| Nursery / Preschool | 5 | 5.0% |
| Kindergarten | 1 | 1.0% |
| Elementary School | 19 | 19.0% |
| Middle School | 34 | 34.0% |
| High School | 21 | 21.0% |
| College / Undergraduate | 20 | 20.0% |
| Graduate / Professional | 0 | 0.0% |
| Total | 100 | 100.0% |
School Enrollment by Age by Funding Source in Forestville
Out of a total of 100 students who are enrolled in schools in Forestville, 7 (7.0%) attend a private institution, while the remaining 93 (93.0%) are enrolled in public schools. The age group of 35 years and over has the highest likelihood of being enrolled in private schools, with 1 (100.0% in the age bracket) enrolled. Conversely, the age group of 5 to 9 year old has the lowest likelihood of being enrolled in a private school, with 17 (100.0% in the age bracket) attending a public institution.
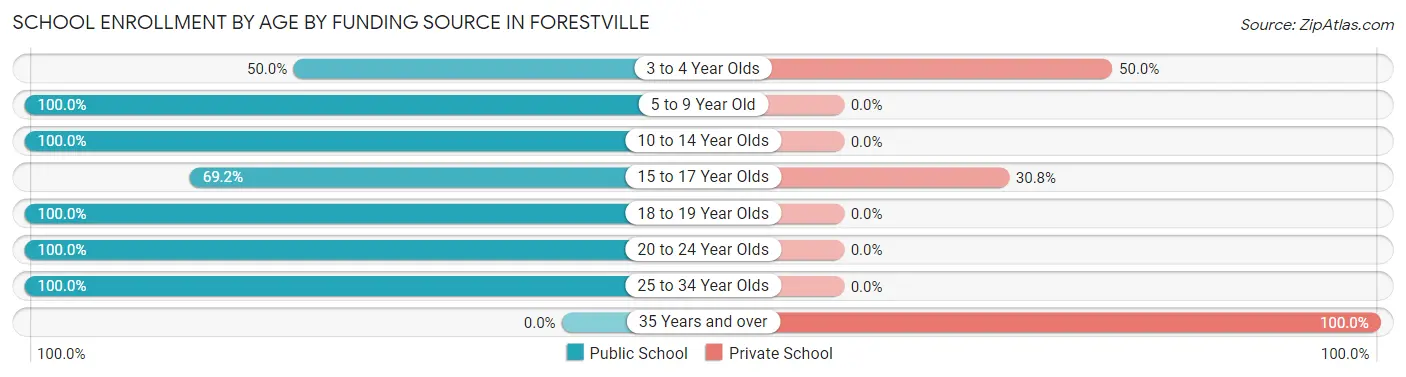
| Age Bracket | Public School | Private School |
| 3 to 4 Year Olds | 2 (50.0%) | 2 (50.0%) |
| 5 to 9 Year Old | 17 (100.0%) | 0 (0.0%) |
| 10 to 14 Year Olds | 43 (100.0%) | 0 (0.0%) |
| 15 to 17 Year Olds | 9 (69.2%) | 4 (30.8%) |
| 18 to 19 Year Olds | 3 (100.0%) | 0 (0.0%) |
| 20 to 24 Year Olds | 17 (100.0%) | 0 (0.0%) |
| 25 to 34 Year Olds | 2 (100.0%) | 0 (0.0%) |
| 35 Years and over | 0 (0.0%) | 1 (100.0%) |
| Total | 93 (93.0%) | 7 (7.0%) |
Educational Attainment by Field of Study in Forestville
Education (15 | 21.1%), business (14 | 19.7%), bio, nature & agricultural (12 | 16.9%), physical & health sciences (12 | 16.9%), and arts & humanities (6 | 8.5%) are the most common fields of study among 71 individuals in Forestville who have obtained a bachelor's degree or higher.
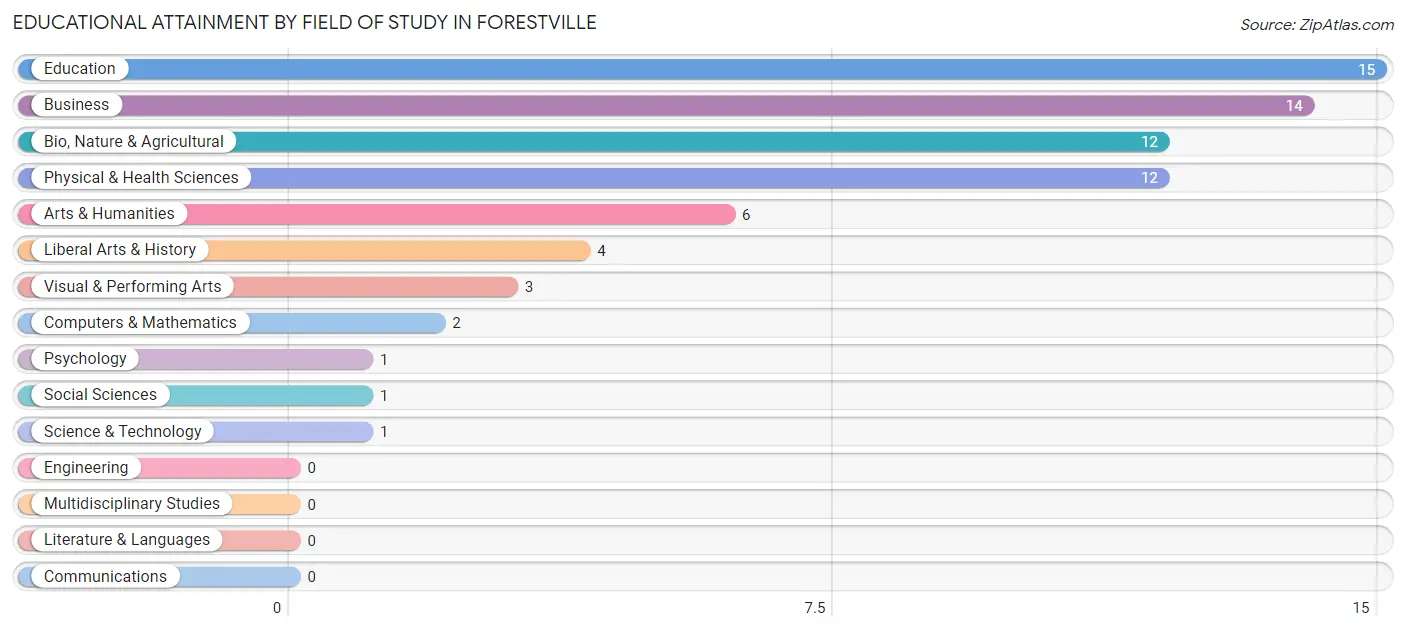
| Field of Study | # Graduates | % Graduates |
| Computers & Mathematics | 2 | 2.8% |
| Bio, Nature & Agricultural | 12 | 16.9% |
| Physical & Health Sciences | 12 | 16.9% |
| Psychology | 1 | 1.4% |
| Social Sciences | 1 | 1.4% |
| Engineering | 0 | 0.0% |
| Multidisciplinary Studies | 0 | 0.0% |
| Science & Technology | 1 | 1.4% |
| Business | 14 | 19.7% |
| Education | 15 | 21.1% |
| Literature & Languages | 0 | 0.0% |
| Liberal Arts & History | 4 | 5.6% |
| Visual & Performing Arts | 3 | 4.2% |
| Communications | 0 | 0.0% |
| Arts & Humanities | 6 | 8.5% |
| Total | 71 | 100.0% |
Transportation & Commute in Forestville
Vehicle Availability by Sex in Forestville
The most prevalent vehicle ownership categories in Forestville are males with 2 vehicles (71, accounting for 43.6%) and females with 2 vehicles (41, making up 66.4%).
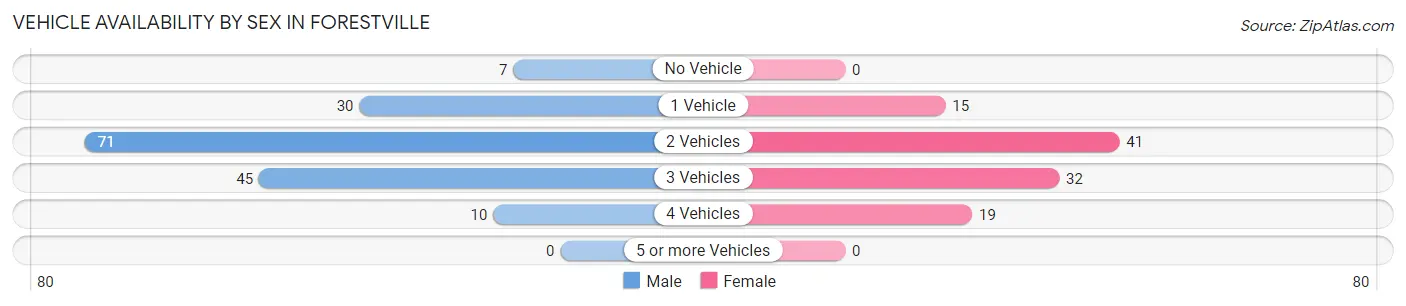
| Vehicles Available | Male | Female |
| No Vehicle | 7 (4.3%) | 0 (0.0%) |
| 1 Vehicle | 30 (18.4%) | 15 (14.0%) |
| 2 Vehicles | 71 (43.6%) | 41 (38.3%) |
| 3 Vehicles | 45 (27.6%) | 32 (29.9%) |
| 4 Vehicles | 10 (6.1%) | 19 (17.8%) |
| 5 or more Vehicles | 0 (0.0%) | 0 (0.0%) |
| Total | 163 (100.0%) | 107 (100.0%) |
Commute Time in Forestville
The most frequently occuring commute durations in Forestville are 15 to 19 minutes (69 commuters, 26.2%), 20 to 24 minutes (39 commuters, 14.8%), and 10 to 14 minutes (33 commuters, 12.6%).
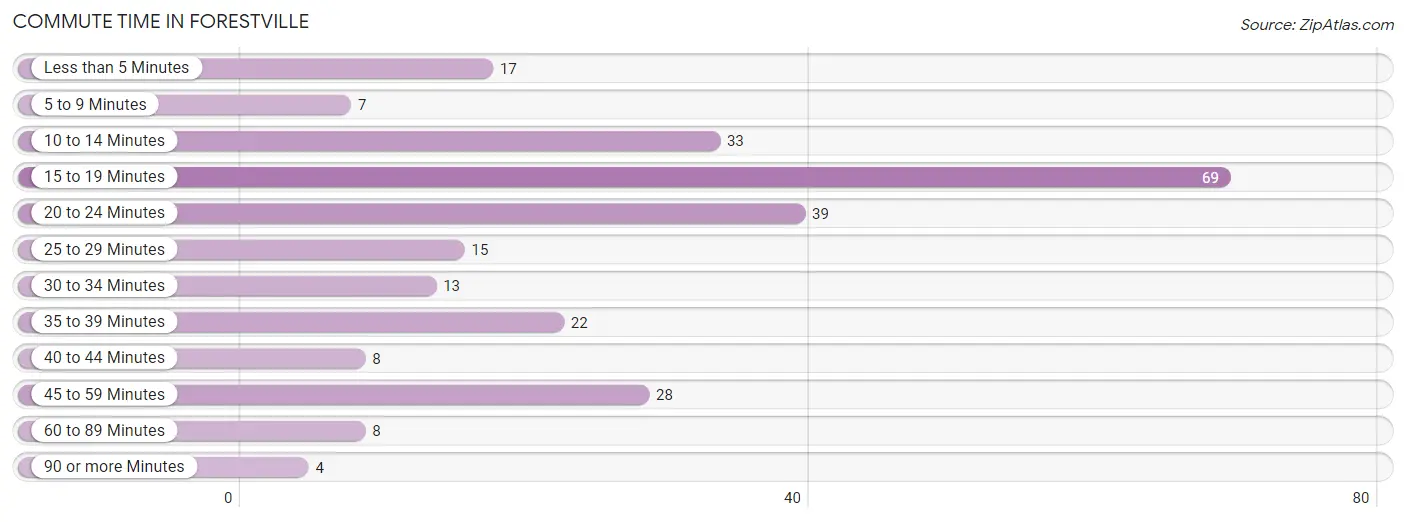
| Commute Time | # Commuters | % Commuters |
| Less than 5 Minutes | 17 | 6.5% |
| 5 to 9 Minutes | 7 | 2.7% |
| 10 to 14 Minutes | 33 | 12.6% |
| 15 to 19 Minutes | 69 | 26.2% |
| 20 to 24 Minutes | 39 | 14.8% |
| 25 to 29 Minutes | 15 | 5.7% |
| 30 to 34 Minutes | 13 | 4.9% |
| 35 to 39 Minutes | 22 | 8.4% |
| 40 to 44 Minutes | 8 | 3.0% |
| 45 to 59 Minutes | 28 | 10.6% |
| 60 to 89 Minutes | 8 | 3.0% |
| 90 or more Minutes | 4 | 1.5% |
Commute Time by Sex in Forestville
The most common commute times in Forestville are 15 to 19 minutes (49 commuters, 31.0%) for males and 15 to 19 minutes (20 commuters, 19.1%) for females.
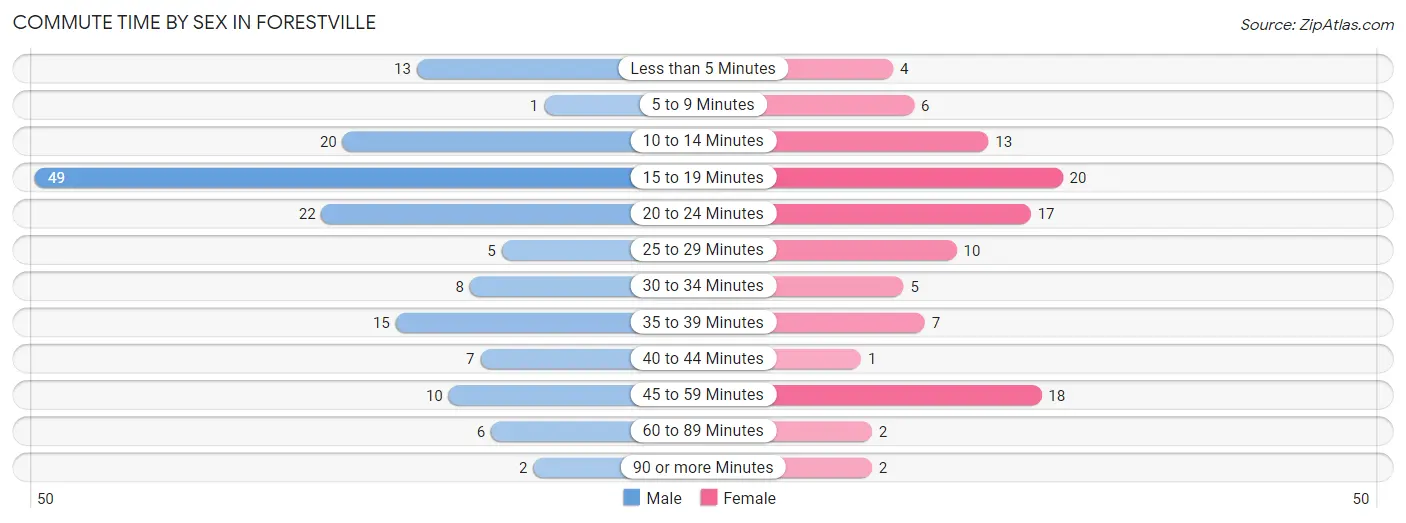
| Commute Time | Male | Female |
| Less than 5 Minutes | 13 (8.2%) | 4 (3.8%) |
| 5 to 9 Minutes | 1 (0.6%) | 6 (5.7%) |
| 10 to 14 Minutes | 20 (12.7%) | 13 (12.4%) |
| 15 to 19 Minutes | 49 (31.0%) | 20 (19.1%) |
| 20 to 24 Minutes | 22 (13.9%) | 17 (16.2%) |
| 25 to 29 Minutes | 5 (3.2%) | 10 (9.5%) |
| 30 to 34 Minutes | 8 (5.1%) | 5 (4.8%) |
| 35 to 39 Minutes | 15 (9.5%) | 7 (6.7%) |
| 40 to 44 Minutes | 7 (4.4%) | 1 (0.9%) |
| 45 to 59 Minutes | 10 (6.3%) | 18 (17.1%) |
| 60 to 89 Minutes | 6 (3.8%) | 2 (1.9%) |
| 90 or more Minutes | 2 (1.3%) | 2 (1.9%) |
Time of Departure to Work by Sex in Forestville
The most frequent times of departure to work in Forestville are 5:00 AM to 5:29 AM (32, 20.3%) for males and 6:30 AM to 6:59 AM (24, 22.9%) for females.
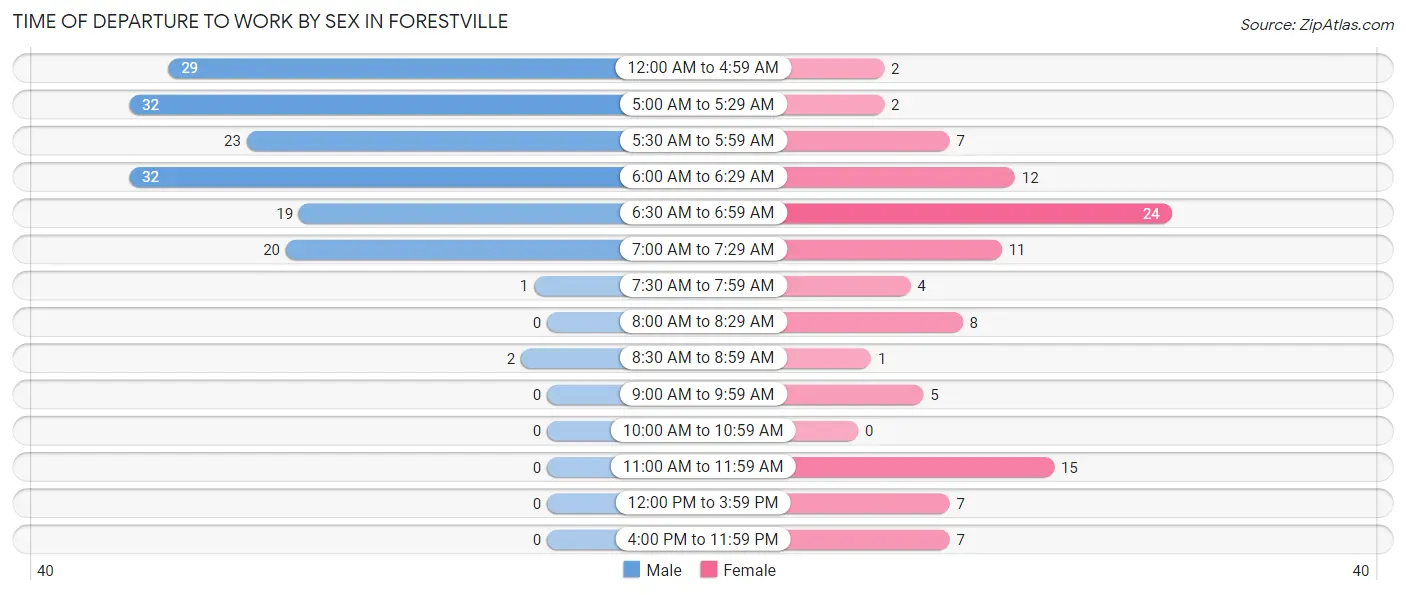
| Time of Departure | Male | Female |
| 12:00 AM to 4:59 AM | 29 (18.3%) | 2 (1.9%) |
| 5:00 AM to 5:29 AM | 32 (20.3%) | 2 (1.9%) |
| 5:30 AM to 5:59 AM | 23 (14.6%) | 7 (6.7%) |
| 6:00 AM to 6:29 AM | 32 (20.3%) | 12 (11.4%) |
| 6:30 AM to 6:59 AM | 19 (12.0%) | 24 (22.9%) |
| 7:00 AM to 7:29 AM | 20 (12.7%) | 11 (10.5%) |
| 7:30 AM to 7:59 AM | 1 (0.6%) | 4 (3.8%) |
| 8:00 AM to 8:29 AM | 0 (0.0%) | 8 (7.6%) |
| 8:30 AM to 8:59 AM | 2 (1.3%) | 1 (0.9%) |
| 9:00 AM to 9:59 AM | 0 (0.0%) | 5 (4.8%) |
| 10:00 AM to 10:59 AM | 0 (0.0%) | 0 (0.0%) |
| 11:00 AM to 11:59 AM | 0 (0.0%) | 15 (14.3%) |
| 12:00 PM to 3:59 PM | 0 (0.0%) | 7 (6.7%) |
| 4:00 PM to 11:59 PM | 0 (0.0%) | 7 (6.7%) |
| Total | 158 (100.0%) | 105 (100.0%) |
Housing Occupancy in Forestville
Occupancy by Ownership in Forestville
Of the total 238 dwellings in Forestville, owner-occupied units account for 198 (83.2%), while renter-occupied units make up 40 (16.8%).
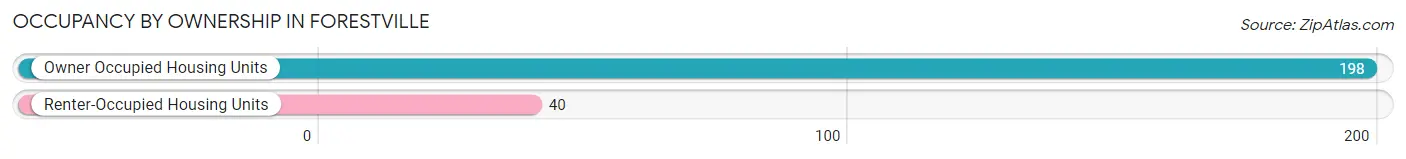
| Occupancy | # Housing Units | % Housing Units |
| Owner Occupied Housing Units | 198 | 83.2% |
| Renter-Occupied Housing Units | 40 | 16.8% |
| Total Occupied Housing Units | 238 | 100.0% |
Occupancy by Household Size in Forestville
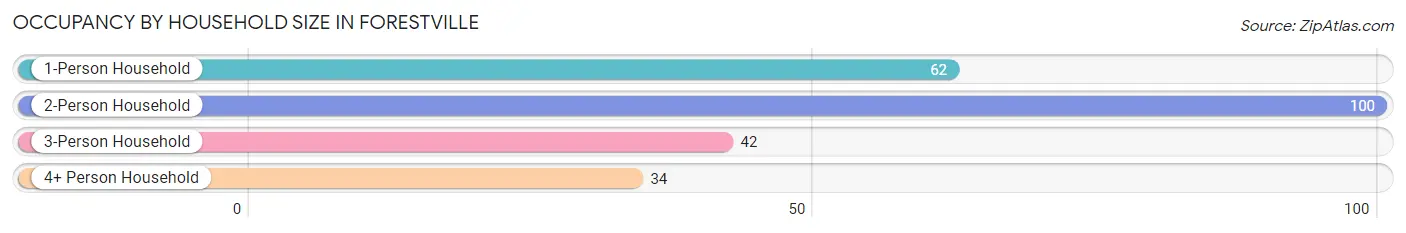
| Household Size | # Housing Units | % Housing Units |
| 1-Person Household | 62 | 26.1% |
| 2-Person Household | 100 | 42.0% |
| 3-Person Household | 42 | 17.6% |
| 4+ Person Household | 34 | 14.3% |
| Total Housing Units | 238 | 100.0% |
Occupancy by Ownership by Household Size in Forestville
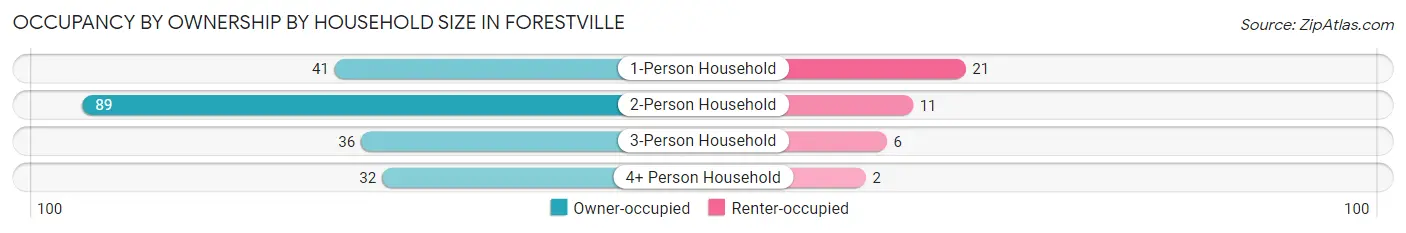
| Household Size | Owner-occupied | Renter-occupied |
| 1-Person Household | 41 (66.1%) | 21 (33.9%) |
| 2-Person Household | 89 (89.0%) | 11 (11.0%) |
| 3-Person Household | 36 (85.7%) | 6 (14.3%) |
| 4+ Person Household | 32 (94.1%) | 2 (5.9%) |
| Total Housing Units | 198 (83.2%) | 40 (16.8%) |
Occupancy by Educational Attainment in Forestville
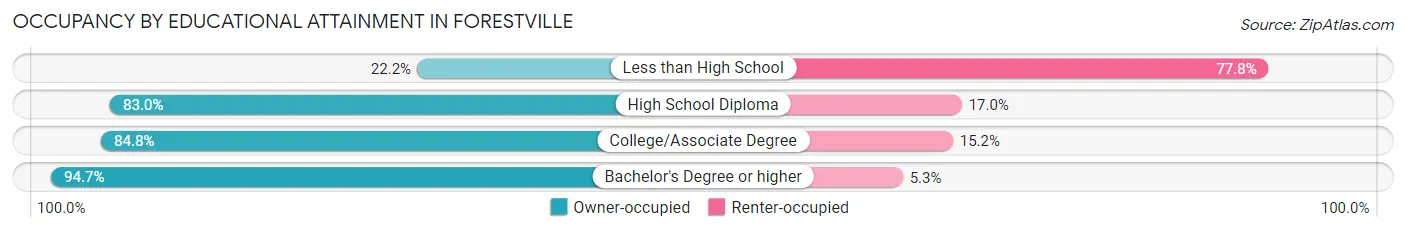
| Household Size | Owner-occupied | Renter-occupied |
| Less than High School | 2 (22.2%) | 7 (77.8%) |
| High School Diploma | 93 (83.0%) | 19 (17.0%) |
| College/Associate Degree | 67 (84.8%) | 12 (15.2%) |
| Bachelor's Degree or higher | 36 (94.7%) | 2 (5.3%) |
Occupancy by Age of Householder in Forestville
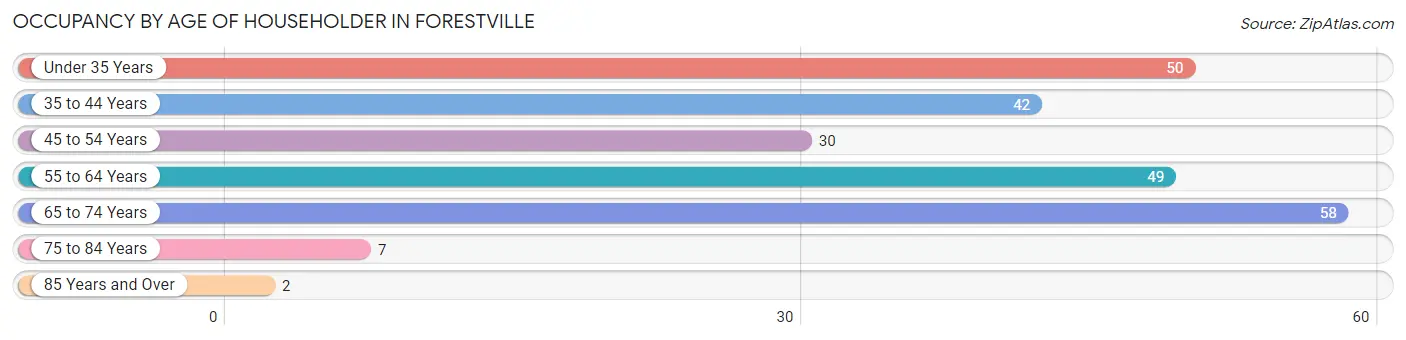
| Age Bracket | # Households | % Households |
| Under 35 Years | 50 | 21.0% |
| 35 to 44 Years | 42 | 17.6% |
| 45 to 54 Years | 30 | 12.6% |
| 55 to 64 Years | 49 | 20.6% |
| 65 to 74 Years | 58 | 24.4% |
| 75 to 84 Years | 7 | 2.9% |
| 85 Years and Over | 2 | 0.8% |
| Total | 238 | 100.0% |
Housing Finances in Forestville
Median Income by Occupancy in Forestville
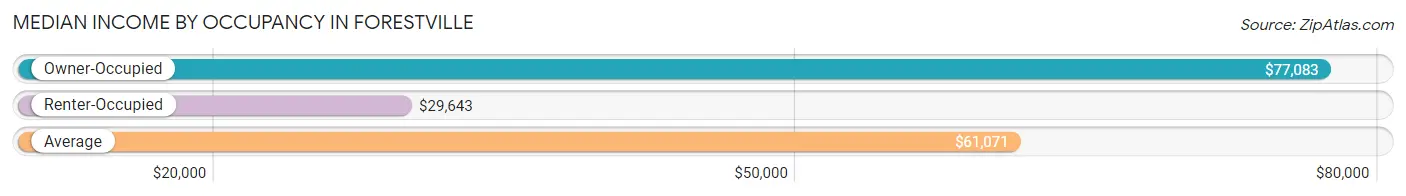
| Occupancy Type | # Households | Median Income |
| Owner-Occupied | 198 (83.2%) | $77,083 |
| Renter-Occupied | 40 (16.8%) | $29,643 |
| Average | 238 (100.0%) | $61,071 |
Occupancy by Householder Income Bracket in Forestville
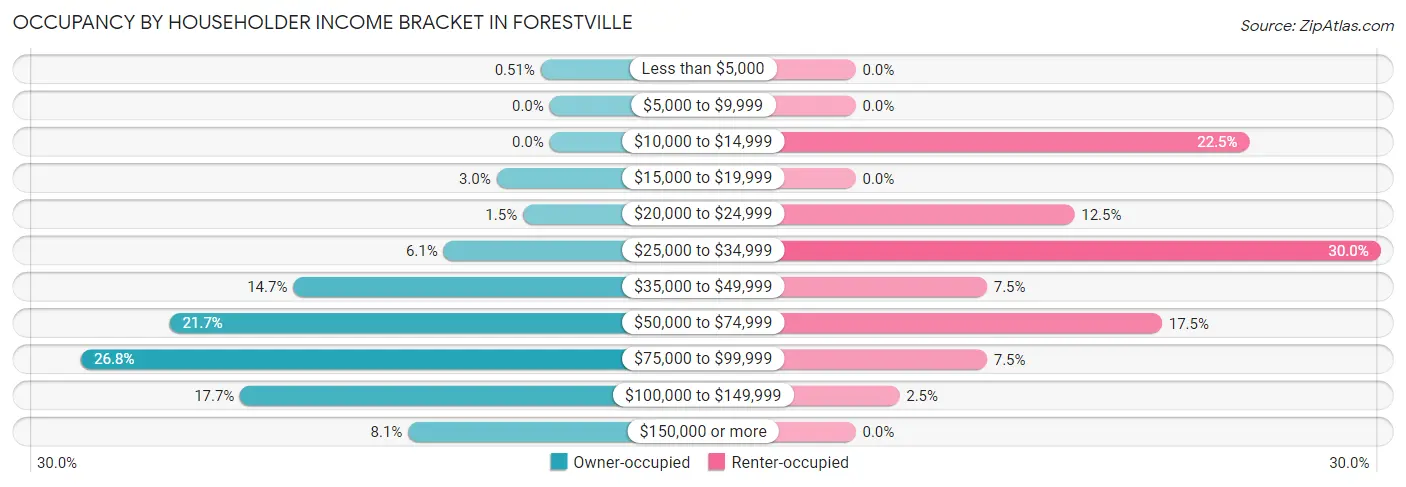
| Income Bracket | Owner-occupied | Renter-occupied |
| Less than $5,000 | 1 (0.5%) | 0 (0.0%) |
| $5,000 to $9,999 | 0 (0.0%) | 0 (0.0%) |
| $10,000 to $14,999 | 0 (0.0%) | 9 (22.5%) |
| $15,000 to $19,999 | 6 (3.0%) | 0 (0.0%) |
| $20,000 to $24,999 | 3 (1.5%) | 5 (12.5%) |
| $25,000 to $34,999 | 12 (6.1%) | 12 (30.0%) |
| $35,000 to $49,999 | 29 (14.6%) | 3 (7.5%) |
| $50,000 to $74,999 | 43 (21.7%) | 7 (17.5%) |
| $75,000 to $99,999 | 53 (26.8%) | 3 (7.5%) |
| $100,000 to $149,999 | 35 (17.7%) | 1 (2.5%) |
| $150,000 or more | 16 (8.1%) | 0 (0.0%) |
| Total | 198 (100.0%) | 40 (100.0%) |
Monthly Housing Cost Tiers in Forestville
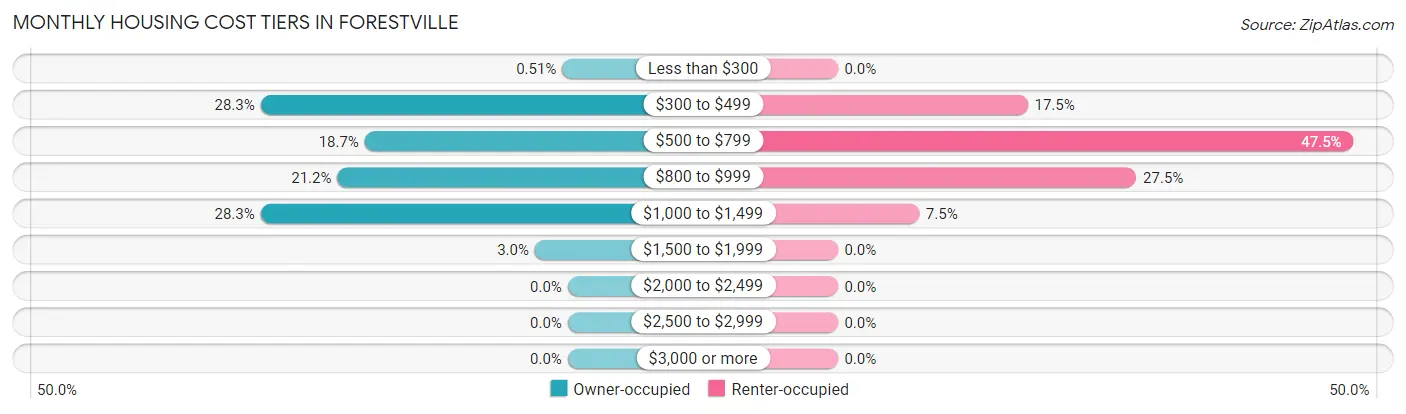
| Monthly Cost | Owner-occupied | Renter-occupied |
| Less than $300 | 1 (0.5%) | 0 (0.0%) |
| $300 to $499 | 56 (28.3%) | 7 (17.5%) |
| $500 to $799 | 37 (18.7%) | 19 (47.5%) |
| $800 to $999 | 42 (21.2%) | 11 (27.5%) |
| $1,000 to $1,499 | 56 (28.3%) | 3 (7.5%) |
| $1,500 to $1,999 | 6 (3.0%) | 0 (0.0%) |
| $2,000 to $2,499 | 0 (0.0%) | 0 (0.0%) |
| $2,500 to $2,999 | 0 (0.0%) | 0 (0.0%) |
| $3,000 or more | 0 (0.0%) | 0 (0.0%) |
| Total | 198 (100.0%) | 40 (100.0%) |
Physical Housing Characteristics in Forestville
Housing Structures in Forestville
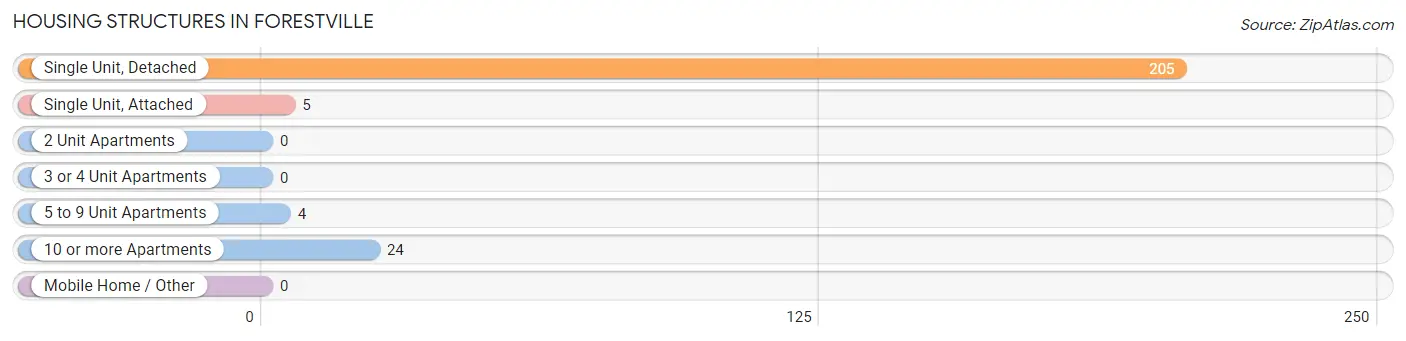
| Structure Type | # Housing Units | % Housing Units |
| Single Unit, Detached | 205 | 86.1% |
| Single Unit, Attached | 5 | 2.1% |
| 2 Unit Apartments | 0 | 0.0% |
| 3 or 4 Unit Apartments | 0 | 0.0% |
| 5 to 9 Unit Apartments | 4 | 1.7% |
| 10 or more Apartments | 24 | 10.1% |
| Mobile Home / Other | 0 | 0.0% |
| Total | 238 | 100.0% |
Housing Structures by Occupancy in Forestville
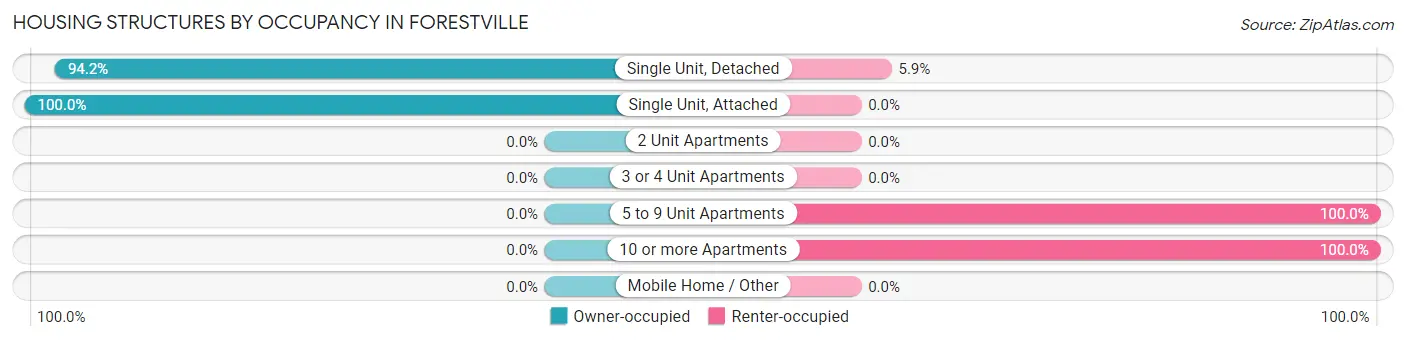
| Structure Type | Owner-occupied | Renter-occupied |
| Single Unit, Detached | 193 (94.2%) | 12 (5.9%) |
| Single Unit, Attached | 5 (100.0%) | 0 (0.0%) |
| 2 Unit Apartments | 0 (0.0%) | 0 (0.0%) |
| 3 or 4 Unit Apartments | 0 (0.0%) | 0 (0.0%) |
| 5 to 9 Unit Apartments | 0 (0.0%) | 4 (100.0%) |
| 10 or more Apartments | 0 (0.0%) | 24 (100.0%) |
| Mobile Home / Other | 0 (0.0%) | 0 (0.0%) |
| Total | 198 (83.2%) | 40 (16.8%) |
Housing Structures by Number of Rooms in Forestville
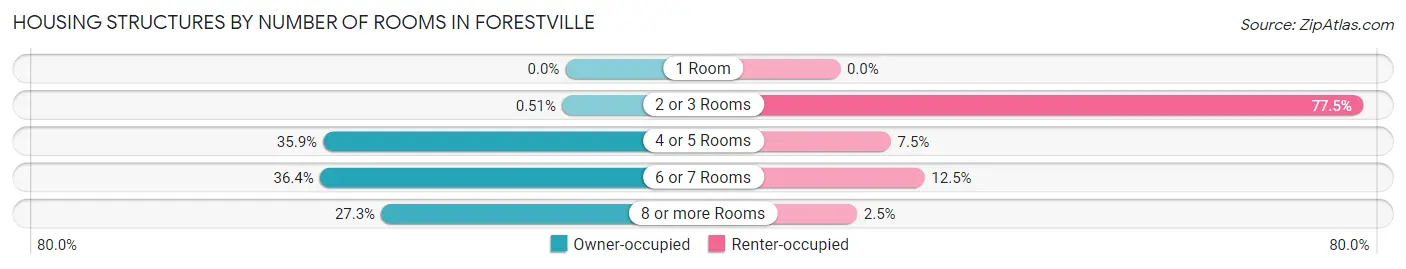
| Number of Rooms | Owner-occupied | Renter-occupied |
| 1 Room | 0 (0.0%) | 0 (0.0%) |
| 2 or 3 Rooms | 1 (0.5%) | 31 (77.5%) |
| 4 or 5 Rooms | 71 (35.9%) | 3 (7.5%) |
| 6 or 7 Rooms | 72 (36.4%) | 5 (12.5%) |
| 8 or more Rooms | 54 (27.3%) | 1 (2.5%) |
| Total | 198 (100.0%) | 40 (100.0%) |
Housing Structure by Heating Type in Forestville
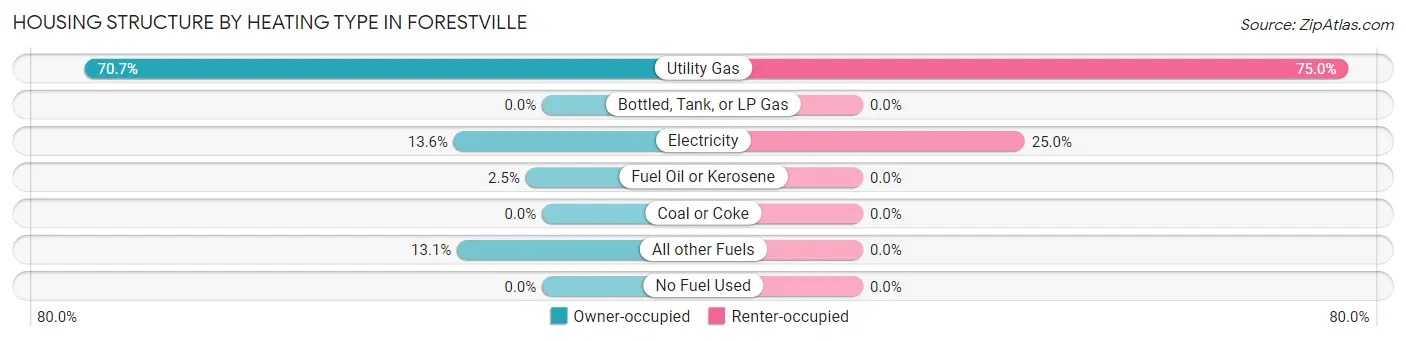
| Heating Type | Owner-occupied | Renter-occupied |
| Utility Gas | 140 (70.7%) | 30 (75.0%) |
| Bottled, Tank, or LP Gas | 0 (0.0%) | 0 (0.0%) |
| Electricity | 27 (13.6%) | 10 (25.0%) |
| Fuel Oil or Kerosene | 5 (2.5%) | 0 (0.0%) |
| Coal or Coke | 0 (0.0%) | 0 (0.0%) |
| All other Fuels | 26 (13.1%) | 0 (0.0%) |
| No Fuel Used | 0 (0.0%) | 0 (0.0%) |
| Total | 198 (100.0%) | 40 (100.0%) |
Household Vehicle Usage in Forestville
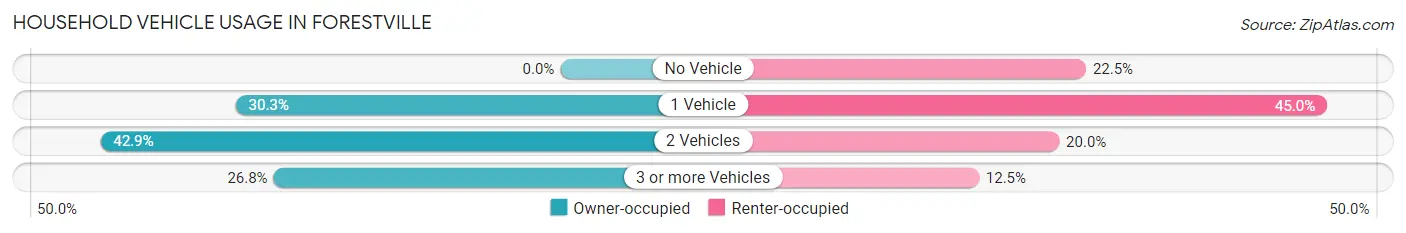
| Vehicles per Household | Owner-occupied | Renter-occupied |
| No Vehicle | 0 (0.0%) | 9 (22.5%) |
| 1 Vehicle | 60 (30.3%) | 18 (45.0%) |
| 2 Vehicles | 85 (42.9%) | 8 (20.0%) |
| 3 or more Vehicles | 53 (26.8%) | 5 (12.5%) |
| Total | 198 (100.0%) | 40 (100.0%) |
Real Estate & Mortgages in Forestville
Real Estate and Mortgage Overview in Forestville
| Characteristic | Without Mortgage | With Mortgage |
| Housing Units | 76 | 122 |
| Median Property Value | $155,600 | $140,000 |
| Median Household Income | $56,019 | $15 |
| Monthly Housing Costs | $461 | $0 |
| Real Estate Taxes | $1,742 | $2 |
Property Value by Mortgage Status in Forestville
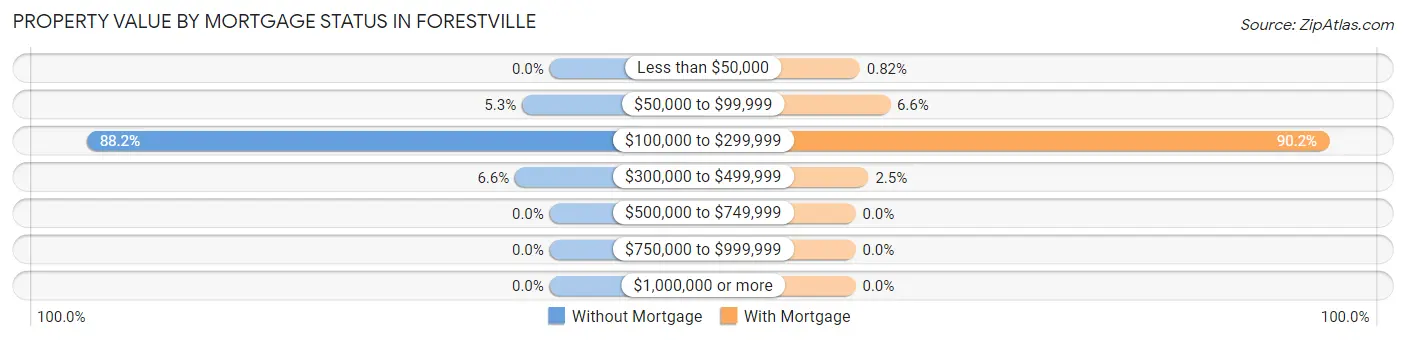
| Property Value | Without Mortgage | With Mortgage |
| Less than $50,000 | 0 (0.0%) | 1 (0.8%) |
| $50,000 to $99,999 | 4 (5.3%) | 8 (6.6%) |
| $100,000 to $299,999 | 67 (88.2%) | 110 (90.2%) |
| $300,000 to $499,999 | 5 (6.6%) | 3 (2.5%) |
| $500,000 to $749,999 | 0 (0.0%) | 0 (0.0%) |
| $750,000 to $999,999 | 0 (0.0%) | 0 (0.0%) |
| $1,000,000 or more | 0 (0.0%) | 0 (0.0%) |
| Total | 76 (100.0%) | 122 (100.0%) |
Household Income by Mortgage Status in Forestville
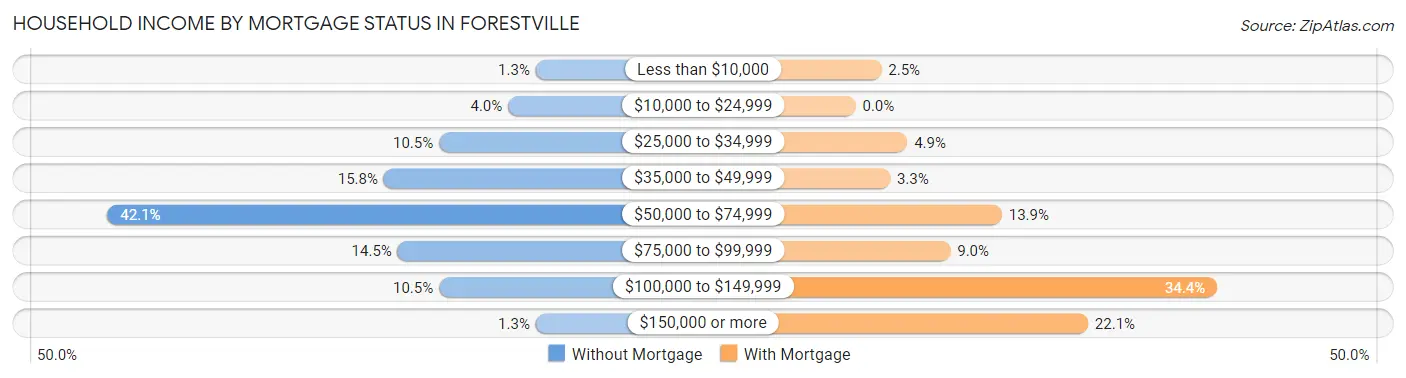
| Household Income | Without Mortgage | With Mortgage |
| Less than $10,000 | 1 (1.3%) | 3 (2.5%) |
| $10,000 to $24,999 | 3 (4.0%) | 0 (0.0%) |
| $25,000 to $34,999 | 8 (10.5%) | 6 (4.9%) |
| $35,000 to $49,999 | 12 (15.8%) | 4 (3.3%) |
| $50,000 to $74,999 | 32 (42.1%) | 17 (13.9%) |
| $75,000 to $99,999 | 11 (14.5%) | 11 (9.0%) |
| $100,000 to $149,999 | 8 (10.5%) | 42 (34.4%) |
| $150,000 or more | 1 (1.3%) | 27 (22.1%) |
| Total | 76 (100.0%) | 122 (100.0%) |
Property Value to Household Income Ratio in Forestville
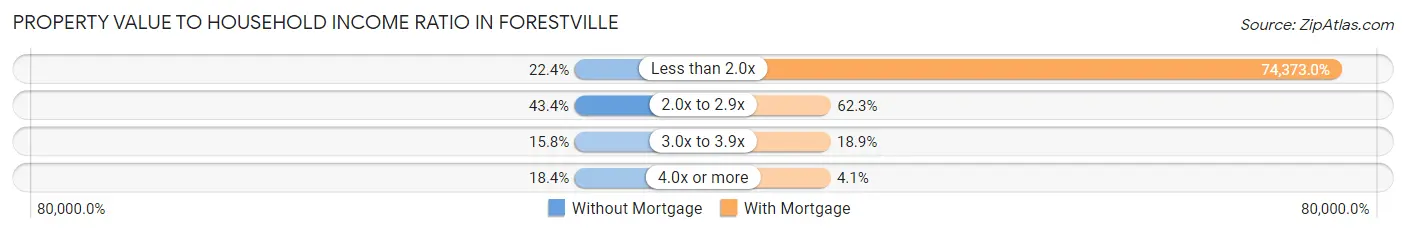
| Value-to-Income Ratio | Without Mortgage | With Mortgage |
| Less than 2.0x | 17 (22.4%) | 90,735 (74,373.0%) |
| 2.0x to 2.9x | 33 (43.4%) | 76 (62.3%) |
| 3.0x to 3.9x | 12 (15.8%) | 23 (18.9%) |
| 4.0x or more | 14 (18.4%) | 5 (4.1%) |
| Total | 76 (100.0%) | 122 (100.0%) |
Real Estate Taxes by Mortgage Status in Forestville
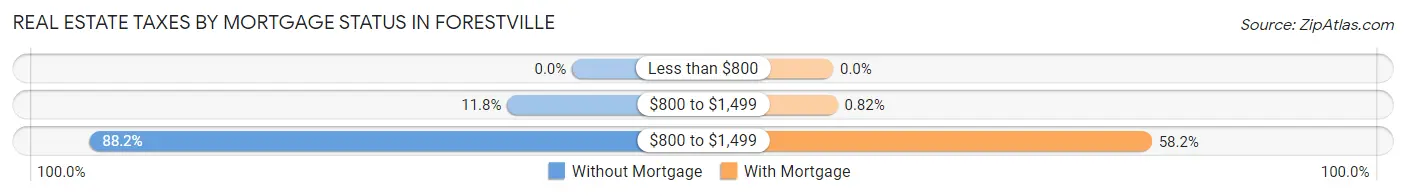
| Property Taxes | Without Mortgage | With Mortgage |
| Less than $800 | 0 (0.0%) | 0 (0.0%) |
| $800 to $1,499 | 9 (11.8%) | 1 (0.8%) |
| $800 to $1,499 | 67 (88.2%) | 71 (58.2%) |
| Total | 76 (100.0%) | 122 (100.0%) |
Health & Disability in Forestville
Health Insurance Coverage by Age in Forestville
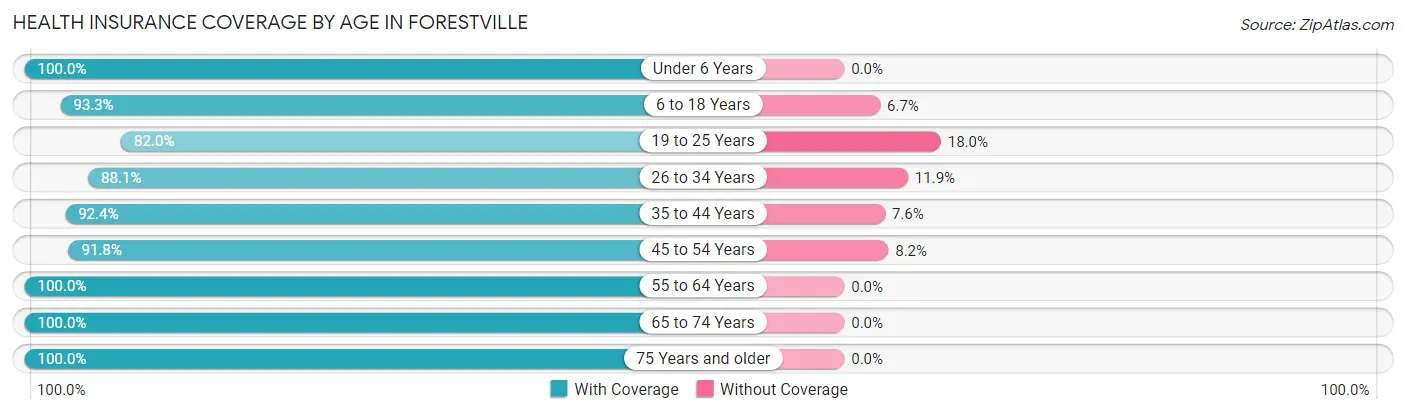
| Age Bracket | With Coverage | Without Coverage |
| Under 6 Years | 25 (100.0%) | 0 (0.0%) |
| 6 to 18 Years | 70 (93.3%) | 5 (6.7%) |
| 19 to 25 Years | 41 (82.0%) | 9 (18.0%) |
| 26 to 34 Years | 52 (88.1%) | 7 (11.9%) |
| 35 to 44 Years | 61 (92.4%) | 5 (7.6%) |
| 45 to 54 Years | 56 (91.8%) | 5 (8.2%) |
| 55 to 64 Years | 85 (100.0%) | 0 (0.0%) |
| 65 to 74 Years | 75 (100.0%) | 0 (0.0%) |
| 75 Years and older | 62 (100.0%) | 0 (0.0%) |
| Total | 527 (94.4%) | 31 (5.6%) |
Health Insurance Coverage by Citizenship Status in Forestville
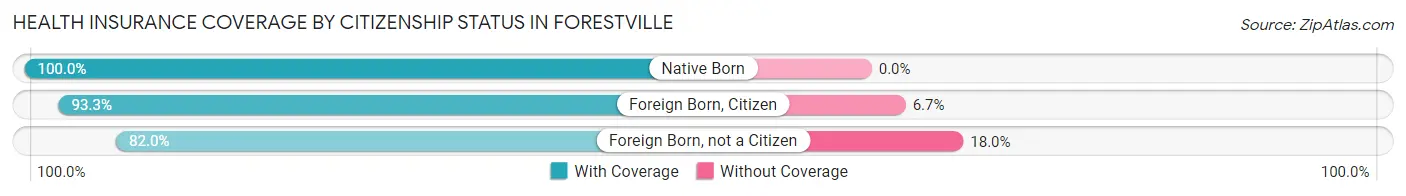
| Citizenship Status | With Coverage | Without Coverage |
| Native Born | 25 (100.0%) | 0 (0.0%) |
| Foreign Born, Citizen | 70 (93.3%) | 5 (6.7%) |
| Foreign Born, not a Citizen | 41 (82.0%) | 9 (18.0%) |
Health Insurance Coverage by Household Income in Forestville
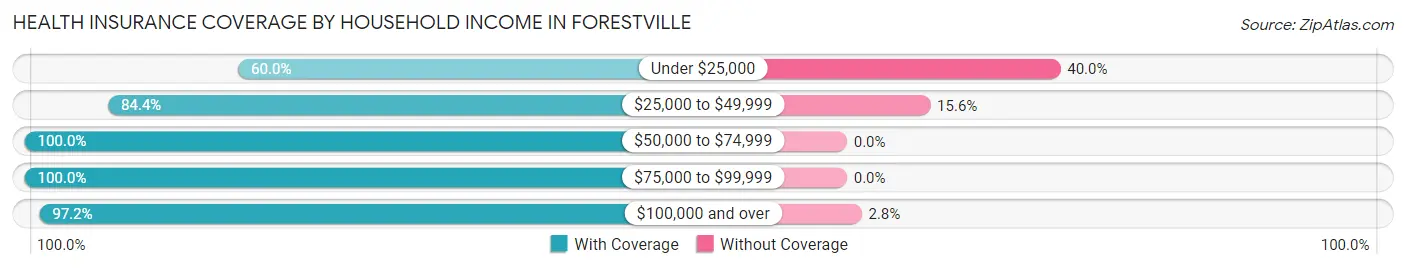
| Household Income | With Coverage | Without Coverage |
| Under $25,000 | 18 (60.0%) | 12 (40.0%) |
| $25,000 to $49,999 | 81 (84.4%) | 15 (15.6%) |
| $50,000 to $74,999 | 124 (100.0%) | 0 (0.0%) |
| $75,000 to $99,999 | 163 (100.0%) | 0 (0.0%) |
| $100,000 and over | 141 (97.2%) | 4 (2.8%) |
Public vs Private Health Insurance Coverage by Age in Forestville
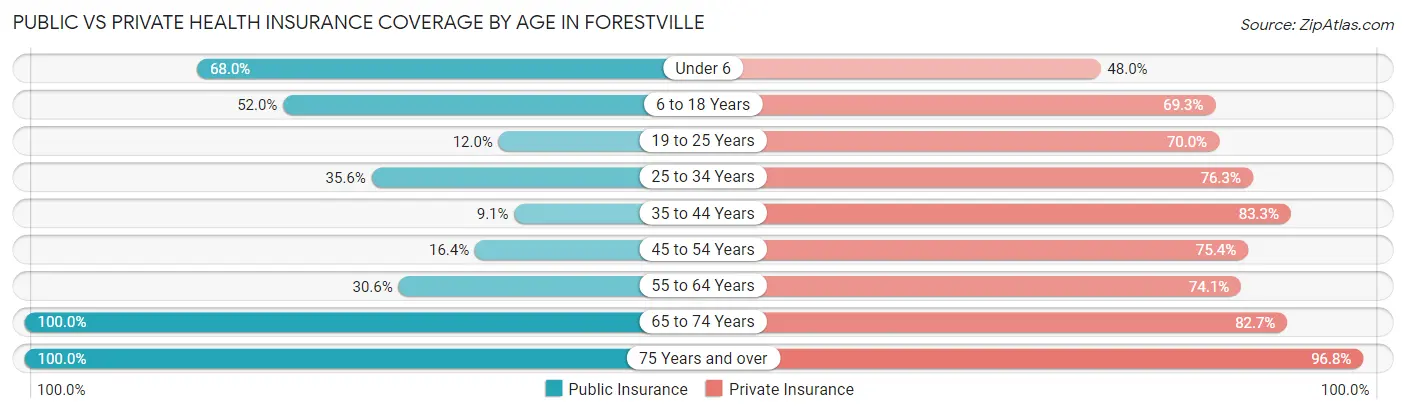
| Age Bracket | Public Insurance | Private Insurance |
| Under 6 | 17 (68.0%) | 12 (48.0%) |
| 6 to 18 Years | 39 (52.0%) | 52 (69.3%) |
| 19 to 25 Years | 6 (12.0%) | 35 (70.0%) |
| 25 to 34 Years | 21 (35.6%) | 45 (76.3%) |
| 35 to 44 Years | 6 (9.1%) | 55 (83.3%) |
| 45 to 54 Years | 10 (16.4%) | 46 (75.4%) |
| 55 to 64 Years | 26 (30.6%) | 63 (74.1%) |
| 65 to 74 Years | 75 (100.0%) | 62 (82.7%) |
| 75 Years and over | 62 (100.0%) | 60 (96.8%) |
| Total | 262 (46.9%) | 430 (77.1%) |
Disability Status by Sex by Age in Forestville
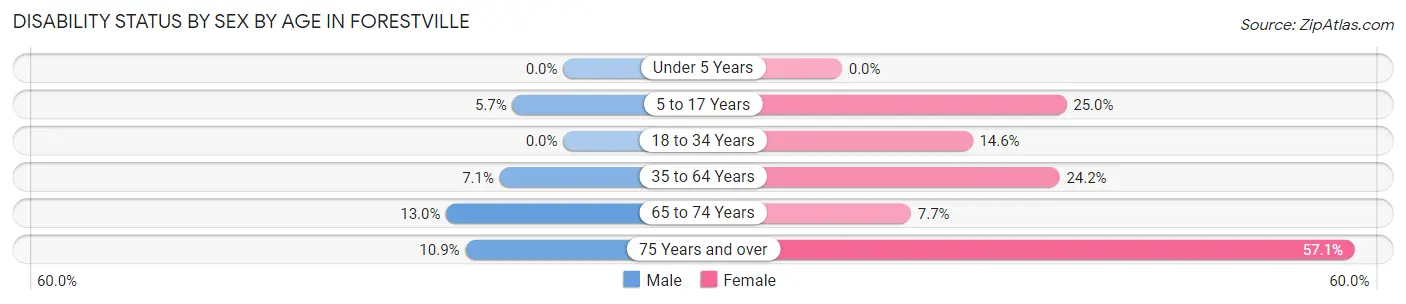
| Age Bracket | Male | Female |
| Under 5 Years | 0 (0.0%) | 0 (0.0%) |
| 5 to 17 Years | 3 (5.7%) | 5 (25.0%) |
| 18 to 34 Years | 0 (0.0%) | 8 (14.5%) |
| 35 to 64 Years | 8 (7.1%) | 24 (24.2%) |
| 65 to 74 Years | 3 (13.0%) | 4 (7.7%) |
| 75 Years and over | 6 (10.9%) | 4 (57.1%) |
Disability Class by Sex by Age in Forestville
Disability Class: Hearing Difficulty
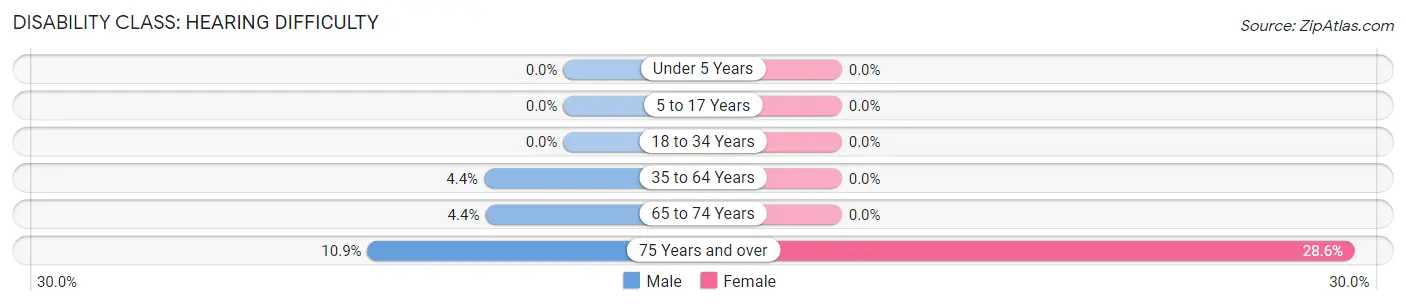
| Age Bracket | Male | Female |
| Under 5 Years | 0 (0.0%) | 0 (0.0%) |
| 5 to 17 Years | 0 (0.0%) | 0 (0.0%) |
| 18 to 34 Years | 0 (0.0%) | 0 (0.0%) |
| 35 to 64 Years | 5 (4.4%) | 0 (0.0%) |
| 65 to 74 Years | 1 (4.3%) | 0 (0.0%) |
| 75 Years and over | 6 (10.9%) | 2 (28.6%) |
Disability Class: Vision Difficulty
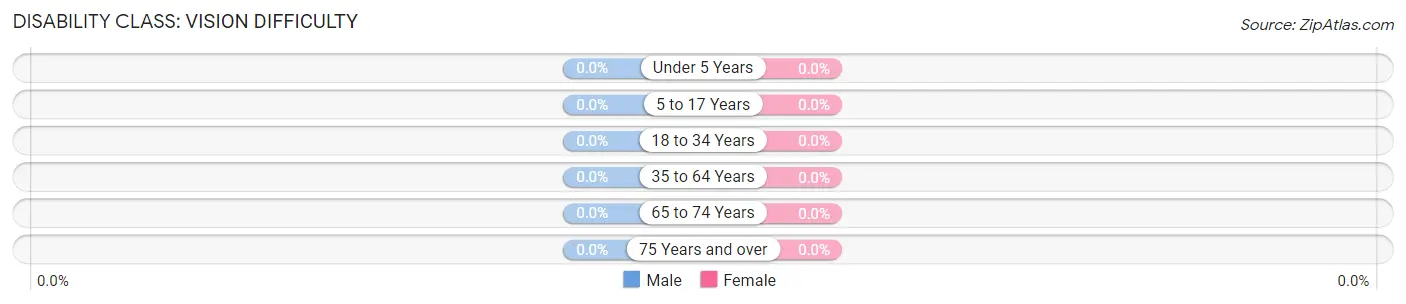
| Age Bracket | Male | Female |
| Under 5 Years | 0 (0.0%) | 0 (0.0%) |
| 5 to 17 Years | 0 (0.0%) | 0 (0.0%) |
| 18 to 34 Years | 0 (0.0%) | 0 (0.0%) |
| 35 to 64 Years | 0 (0.0%) | 0 (0.0%) |
| 65 to 74 Years | 0 (0.0%) | 0 (0.0%) |
| 75 Years and over | 0 (0.0%) | 0 (0.0%) |
Disability Class: Cognitive Difficulty
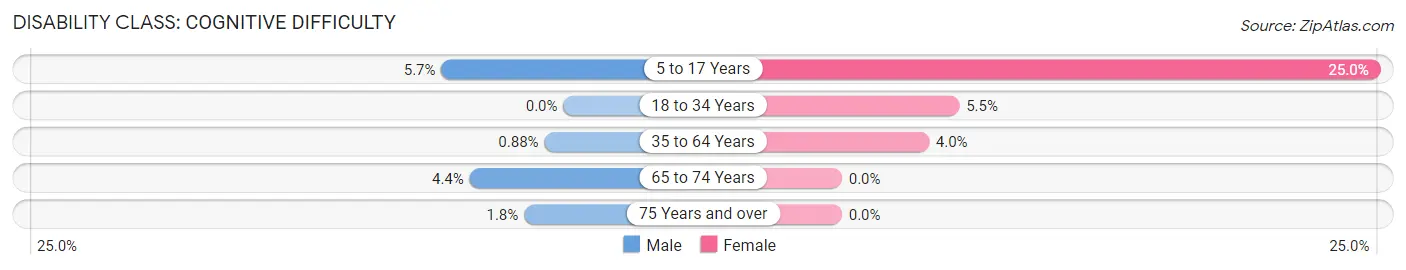
| Age Bracket | Male | Female |
| 5 to 17 Years | 3 (5.7%) | 5 (25.0%) |
| 18 to 34 Years | 0 (0.0%) | 3 (5.4%) |
| 35 to 64 Years | 1 (0.9%) | 4 (4.0%) |
| 65 to 74 Years | 1 (4.3%) | 0 (0.0%) |
| 75 Years and over | 1 (1.8%) | 0 (0.0%) |
Disability Class: Ambulatory Difficulty
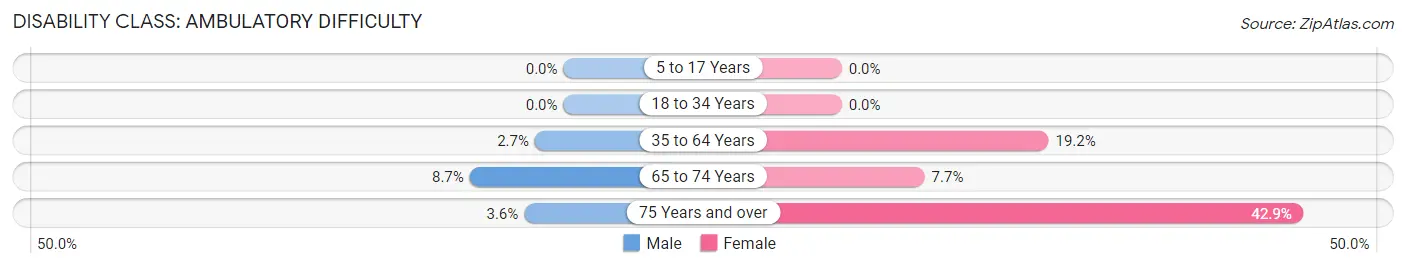
| Age Bracket | Male | Female |
| 5 to 17 Years | 0 (0.0%) | 0 (0.0%) |
| 18 to 34 Years | 0 (0.0%) | 0 (0.0%) |
| 35 to 64 Years | 3 (2.6%) | 19 (19.2%) |
| 65 to 74 Years | 2 (8.7%) | 4 (7.7%) |
| 75 Years and over | 2 (3.6%) | 3 (42.9%) |
Disability Class: Self-Care Difficulty
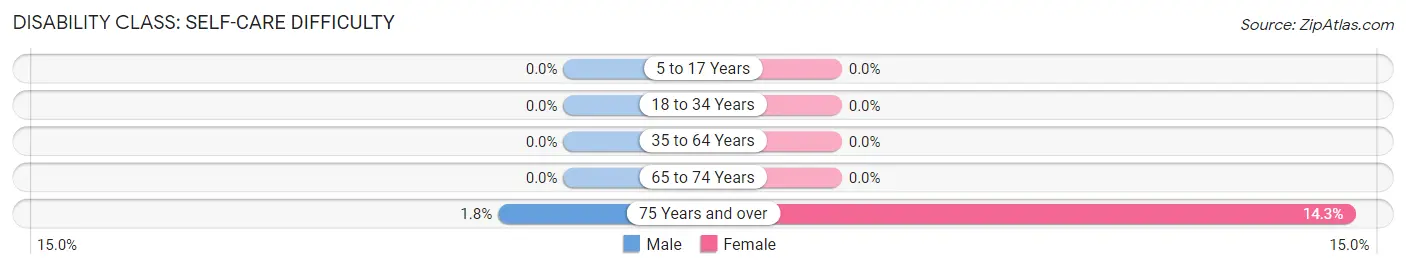
| Age Bracket | Male | Female |
| 5 to 17 Years | 0 (0.0%) | 0 (0.0%) |
| 18 to 34 Years | 0 (0.0%) | 0 (0.0%) |
| 35 to 64 Years | 0 (0.0%) | 0 (0.0%) |
| 65 to 74 Years | 0 (0.0%) | 0 (0.0%) |
| 75 Years and over | 1 (1.8%) | 1 (14.3%) |
Technology Access in Forestville
Computing Device Access in Forestville
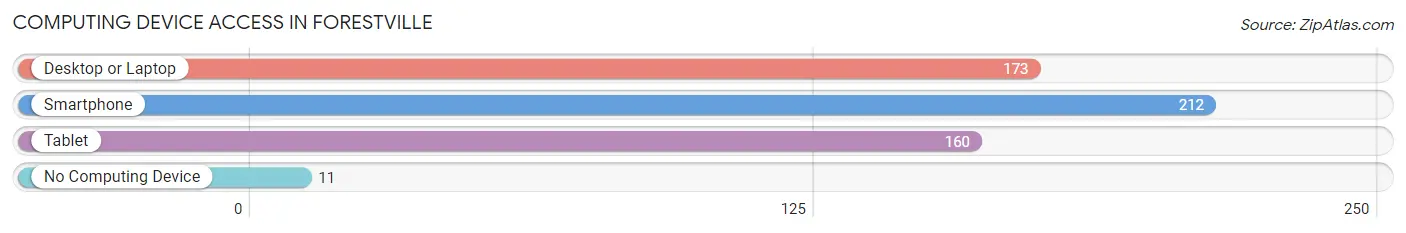
| Device Type | # Households | % Households |
| Desktop or Laptop | 173 | 72.7% |
| Smartphone | 212 | 89.1% |
| Tablet | 160 | 67.2% |
| No Computing Device | 11 | 4.6% |
| Total | 238 | 100.0% |
Internet Access in Forestville
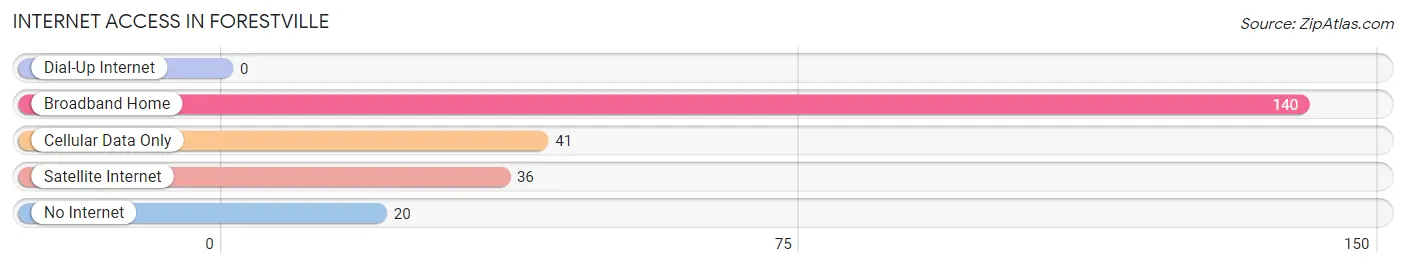
| Internet Type | # Households | % Households |
| Dial-Up Internet | 0 | 0.0% |
| Broadband Home | 140 | 58.8% |
| Cellular Data Only | 41 | 17.2% |
| Satellite Internet | 36 | 15.1% |
| No Internet | 20 | 8.4% |
| Total | 238 | 100.0% |
Forestville Summary
History
The small town of Forestville, Wisconsin is located in Door County, Wisconsin, and is part of the Sturgeon Bay Micropolitan Statistical Area. The town was first settled in 1848 by a group of settlers from New York. The town was originally called “New York Settlement”, but was later changed to Forestville in 1854. The town was named after the nearby forest, which was filled with oak, maple, and other trees.
The town was originally a farming community, with the main crops being wheat, oats, and potatoes. The town also had a sawmill, a gristmill, and a blacksmith shop. In the late 1800s, the town began to grow and develop, with the addition of a post office, a school, and a church.
In the early 1900s, the town began to experience a population boom, as more people moved to the area to take advantage of the fertile land and the abundance of natural resources. The town also began to attract tourists, as the area was known for its beautiful scenery and outdoor activities.
In the 1950s, the town began to experience a decline in population, as many of the younger residents moved away to pursue better opportunities in larger cities. However, the town has since experienced a resurgence in population, as more people have moved to the area to take advantage of the small-town atmosphere and the abundance of outdoor activities.
Geography
Forestville is located in Door County, Wisconsin, and is part of the Sturgeon Bay Micropolitan Statistical Area. The town is situated on the western shore of Lake Michigan, and is surrounded by forests and rolling hills. The town is located approximately 30 miles north of Green Bay, and is approximately 90 miles north of Milwaukee.
The town has a total area of 2.2 square miles, all of which is land. The town is located at an elevation of 645 feet above sea level. The town is located in a temperate climate, with warm summers and cold winters.
Economy
The economy of Forestville is largely based on tourism and agriculture. The town is home to several tourist attractions, including the Door County Maritime Museum, the Door County Historical Museum, and the Door County Visitor Center. The town is also home to several wineries, breweries, and distilleries, which attract visitors from all over the country.
The town is also home to several farms, which produce a variety of crops, including wheat, oats, potatoes, and other vegetables. The town is also home to several businesses, including restaurants, retail stores, and other services.
Demographics
As of the 2010 census, the town of Forestville had a population of 1,845 people. The population was spread out, with 48.3% male and 51.7% female. The median age was 44.7 years, and the median household income was $45,938.
The racial makeup of the town was 97.2% White, 0.2% African American, 0.2% Native American, 0.7% Asian, 0.2% from other races, and 1.7% from two or more races. Hispanic or Latino of any race were 1.2% of the population.
Conclusion
The small town of Forestville, Wisconsin is located in Door County, Wisconsin, and is part of the Sturgeon Bay Micropolitan Statistical Area. The town was first settled in 1848 by a group of settlers from New York, and has since experienced a resurgence in population, as more people have moved to the area to take advantage of the small-town atmosphere and the abundance of outdoor activities. The town has a total area of 2.2 square miles, all of which is land, and is located at an elevation of 645 feet above sea level. The economy of Forestville is largely based on tourism and agriculture, and the town is home to several tourist attractions, wineries, breweries, and distilleries. As of the 2010 census, the town of Forestville had a population of 1,845 people, with a median age of 44.7 years and a median household income of $45,938.
Common Questions
What is Per Capita Income in Forestville?
Per Capita income in Forestville is $31,668.
What is the Median Family Income in Forestville?
Median Family Income in Forestville is $83,750.
What is the Median Household income in Forestville?
Median Household Income in Forestville is $61,071.
What is Income or Wage Gap in Forestville?
Income or Wage Gap in Forestville is 24.9%.
Women in Forestville earn 75.1 cents for every dollar earned by a man.
What is Family Income Deficit in Forestville?
Family Income Deficit in Forestville is $7,938.
Families that are below poverty line in Forestville earn $7,938 less on average than the poverty threshold level.
What is Inequality or Gini Index in Forestville?
Inequality or Gini Index in Forestville is 0.40.
What is the Total Population of Forestville?
Total Population of Forestville is 558.
What is the Total Male Population of Forestville?
Total Male Population of Forestville is 314.
What is the Total Female Population of Forestville?
Total Female Population of Forestville is 244.
What is the Ratio of Males per 100 Females in Forestville?
There are 128.69 Males per 100 Females in Forestville.
What is the Ratio of Females per 100 Males in Forestville?
There are 77.71 Females per 100 Males in Forestville.
What is the Median Population Age in Forestville?
Median Population Age in Forestville is 46.3 Years.
What is the Average Family Size in Forestville
Average Family Size in Forestville is 2.7 People.
What is the Average Household Size in Forestville
Average Household Size in Forestville is 2.3 People.
How Large is the Labor Force in Forestville?
There are 282 People in the Labor Forcein in Forestville.
What is the Percentage of People in the Labor Force in Forestville?
60.4% of People are in the Labor Force in Forestville.
What is the Unemployment Rate in Forestville?
Unemployment Rate in Forestville is 2.8%.