West Salem, WI Map & Demographics
West Salem Map
West Salem Overview
$38,310
PER CAPITA INCOME
$100,524
AVG FAMILY INCOME
$79,891
AVG HOUSEHOLD INCOME
25.2%
WAGE / INCOME GAP [ % ]
74.8¢/ $1
WAGE / INCOME GAP [ $ ]
0.39
INEQUALITY / GINI INDEX
5,253
TOTAL POPULATION
2,531
MALE POPULATION
2,722
FEMALE POPULATION
92.98
MALES / 100 FEMALES
107.55
FEMALES / 100 MALES
43.2
MEDIAN AGE
3.1
AVG FAMILY SIZE
2.5
AVG HOUSEHOLD SIZE
2,695
LABOR FORCE [ PEOPLE ]
67.9%
PERCENT IN LABOR FORCE
2.4%
UNEMPLOYMENT RATE
West Salem Zip Codes
West Salem Area Codes
Income in West Salem
Income Overview in West Salem
Per Capita Income in West Salem is $38,310, while median incomes of families and households are $100,524 and $79,891 respectively.
| Characteristic | Number | Measure |
| Per Capita Income | 5,253 | $38,310 |
| Median Family Income | 1,399 | $100,524 |
| Mean Family Income | 1,399 | $119,356 |
| Median Household Income | 2,018 | $79,891 |
| Mean Household Income | 2,018 | $97,610 |
| Income Deficit | 1,399 | $0 |
| Wage / Income Gap (%) | 5,253 | 25.18% |
| Wage / Income Gap ($) | 5,253 | 74.82¢ per $1 |
| Gini / Inequality Index | 5,253 | 0.39 |
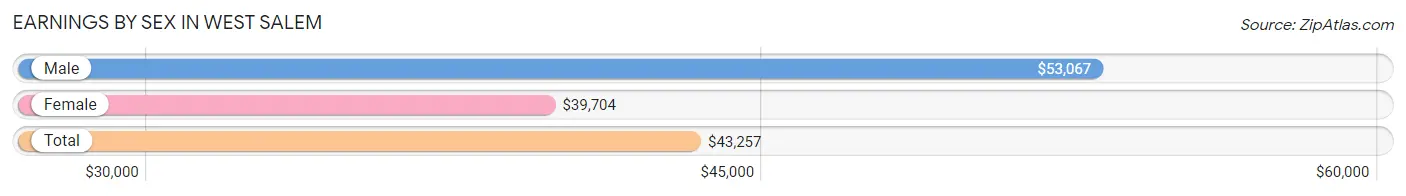
Earnings by Sex in West Salem
Average Earnings in West Salem are $43,257, $53,067 for men and $39,704 for women, a difference of 25.2%.
| Sex | Number | Average Earnings |
| Male | 1,368 (48.7%) | $53,067 |
| Female | 1,441 (51.3%) | $39,704 |
| Total | 2,809 (100.0%) | $43,257 |
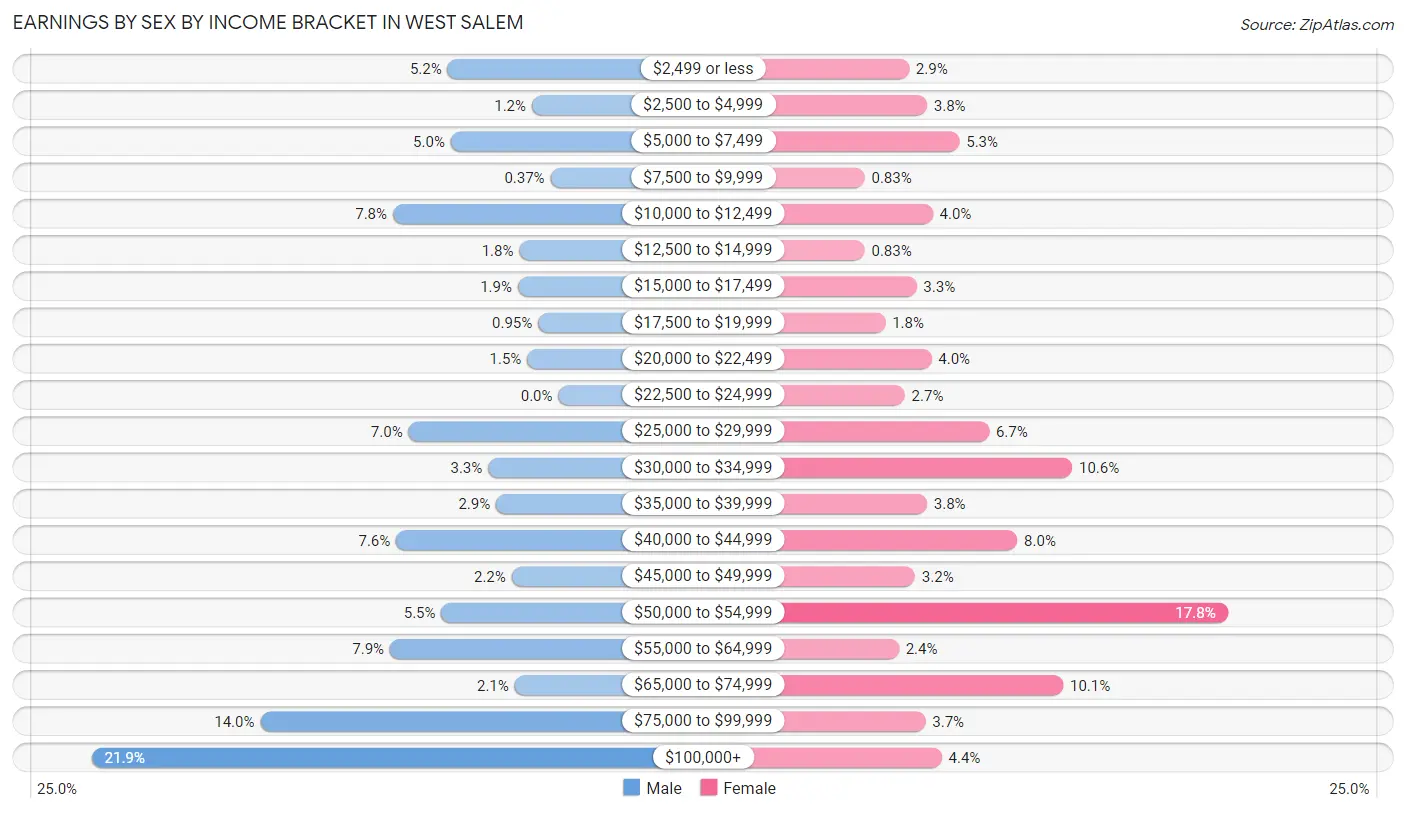
Earnings by Sex by Income Bracket in West Salem
The most common earnings brackets in West Salem are $100,000+ for men (299 | 21.9%) and $50,000 to $54,999 for women (257 | 17.8%).
| Income | Male | Female |
| $2,499 or less | 71 (5.2%) | 42 (2.9%) |
| $2,500 to $4,999 | 17 (1.2%) | 54 (3.7%) |
| $5,000 to $7,499 | 69 (5.0%) | 76 (5.3%) |
| $7,500 to $9,999 | 5 (0.4%) | 12 (0.8%) |
| $10,000 to $12,499 | 106 (7.7%) | 58 (4.0%) |
| $12,500 to $14,999 | 25 (1.8%) | 12 (0.8%) |
| $15,000 to $17,499 | 26 (1.9%) | 47 (3.3%) |
| $17,500 to $19,999 | 13 (0.9%) | 26 (1.8%) |
| $20,000 to $22,499 | 20 (1.5%) | 57 (4.0%) |
| $22,500 to $24,999 | 0 (0.0%) | 39 (2.7%) |
| $25,000 to $29,999 | 96 (7.0%) | 96 (6.7%) |
| $30,000 to $34,999 | 45 (3.3%) | 152 (10.5%) |
| $35,000 to $39,999 | 40 (2.9%) | 54 (3.7%) |
| $40,000 to $44,999 | 104 (7.6%) | 115 (8.0%) |
| $45,000 to $49,999 | 30 (2.2%) | 46 (3.2%) |
| $50,000 to $54,999 | 75 (5.5%) | 257 (17.8%) |
| $55,000 to $64,999 | 108 (7.9%) | 35 (2.4%) |
| $65,000 to $74,999 | 28 (2.1%) | 146 (10.1%) |
| $75,000 to $99,999 | 191 (14.0%) | 53 (3.7%) |
| $100,000+ | 299 (21.9%) | 64 (4.4%) |
| Total | 1,368 (100.0%) | 1,441 (100.0%) |
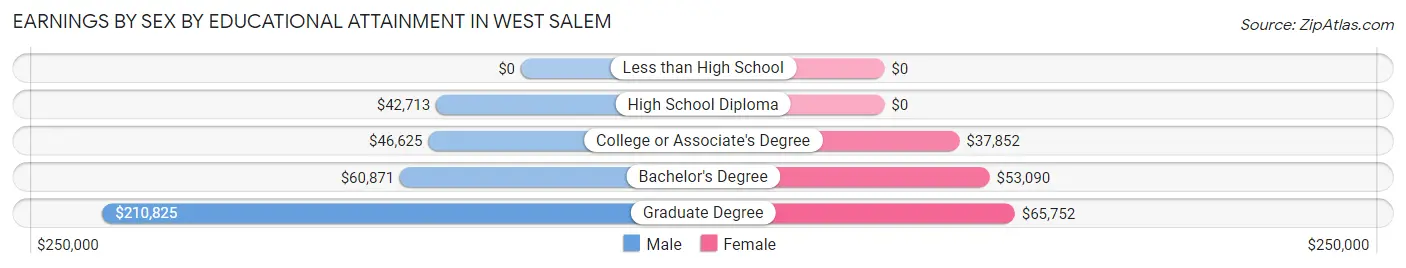
Earnings by Sex by Educational Attainment in West Salem
Average earnings in West Salem are $59,327 for men and $46,111 for women, a difference of 22.3%. Men with an educational attainment of graduate degree enjoy the highest average annual earnings of $210,825, while those with high school diploma education earn the least with $42,713. Women with an educational attainment of graduate degree earn the most with the average annual earnings of $65,752, while those with college or associate's degree education have the smallest earnings of $37,852.
| Educational Attainment | Male Income | Female Income |
| Less than High School | - | - |
| High School Diploma | $42,713 | $0 |
| College or Associate's Degree | $46,625 | $37,852 |
| Bachelor's Degree | $60,871 | $53,090 |
| Graduate Degree | $210,825 | $65,752 |
| Total | $59,327 | $46,111 |
Family Income in West Salem
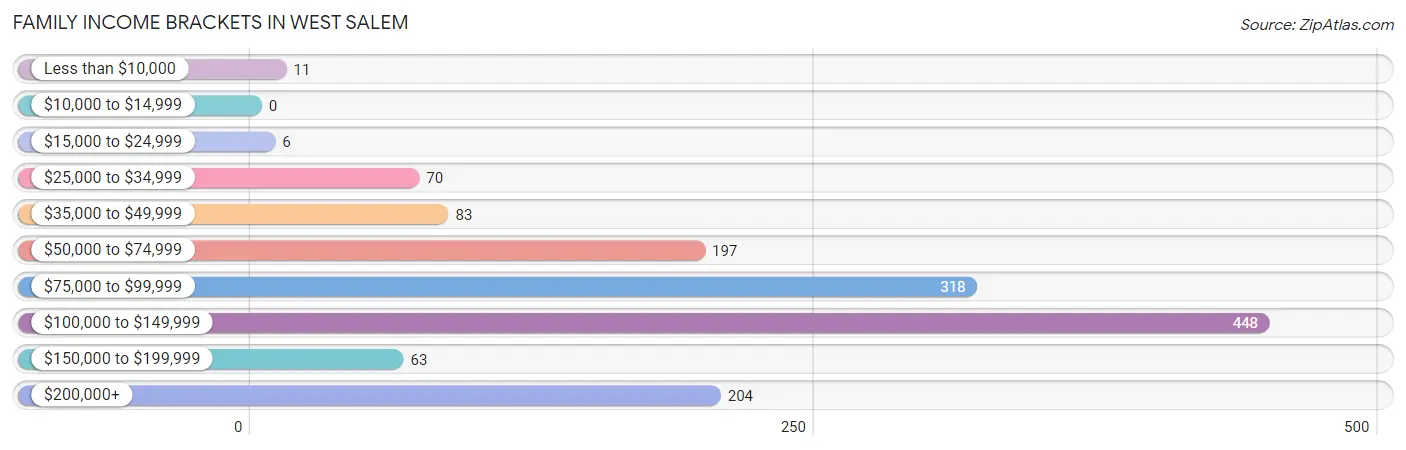
Family Income Brackets in West Salem
According to the West Salem family income data, there are 448 families falling into the $100,000 to $149,999 income range, which is the most common income bracket and makes up 32.0% of all families.
| Income Bracket | # Families | % Families |
| Less than $10,000 | 11 | 0.8% |
| $10,000 to $14,999 | 0 | 0.0% |
| $15,000 to $24,999 | 6 | 0.4% |
| $25,000 to $34,999 | 70 | 5.0% |
| $35,000 to $49,999 | 83 | 5.9% |
| $50,000 to $74,999 | 197 | 14.1% |
| $75,000 to $99,999 | 318 | 22.7% |
| $100,000 to $149,999 | 448 | 32.0% |
| $150,000 to $199,999 | 63 | 4.5% |
| $200,000+ | 204 | 14.6% |
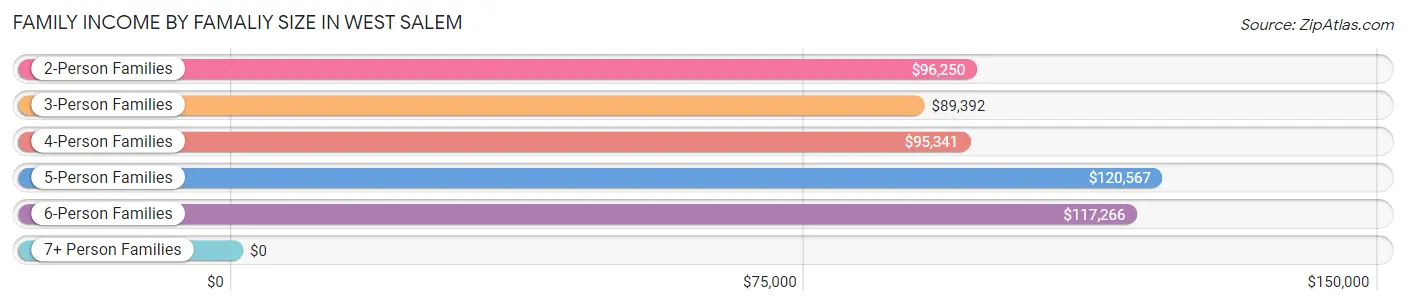
Family Income by Famaliy Size in West Salem
5-person families (211 | 15.1%) account for the highest median family income in West Salem with $120,567 per family, while 2-person families (736 | 52.6%) have the highest median income of $48,125 per family member.
| Income Bracket | # Families | Median Income |
| 2-Person Families | 736 (52.6%) | $96,250 |
| 3-Person Families | 198 (14.1%) | $89,392 |
| 4-Person Families | 201 (14.4%) | $95,341 |
| 5-Person Families | 211 (15.1%) | $120,567 |
| 6-Person Families | 53 (3.8%) | $117,266 |
| 7+ Person Families | 0 (0.0%) | $0 |
| Total | 1,399 (100.0%) | $100,524 |
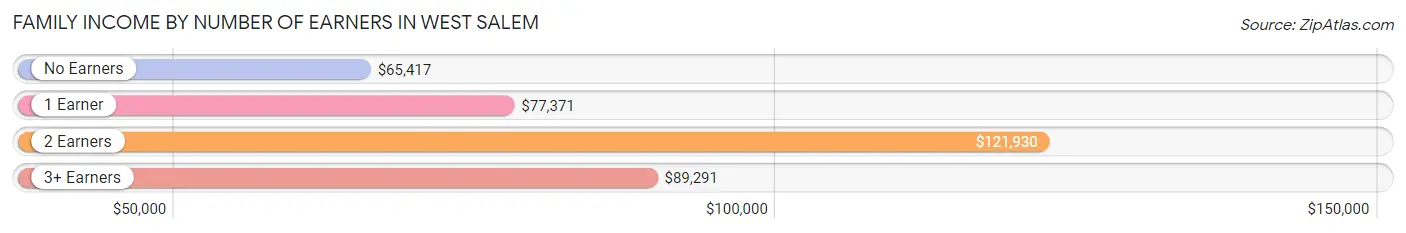
Family Income by Number of Earners in West Salem
The median family income in West Salem is $100,524, with families comprising 2 earners (693) having the highest median family income of $121,930, while families with no earners (146) have the lowest median family income of $65,417, accounting for 49.5% and 10.4% of families, respectively.
| Number of Earners | # Families | Median Income |
| No Earners | 146 (10.4%) | $65,417 |
| 1 Earner | 375 (26.8%) | $77,371 |
| 2 Earners | 693 (49.5%) | $121,930 |
| 3+ Earners | 185 (13.2%) | $89,291 |
| Total | 1,399 (100.0%) | $100,524 |
Household Income in West Salem
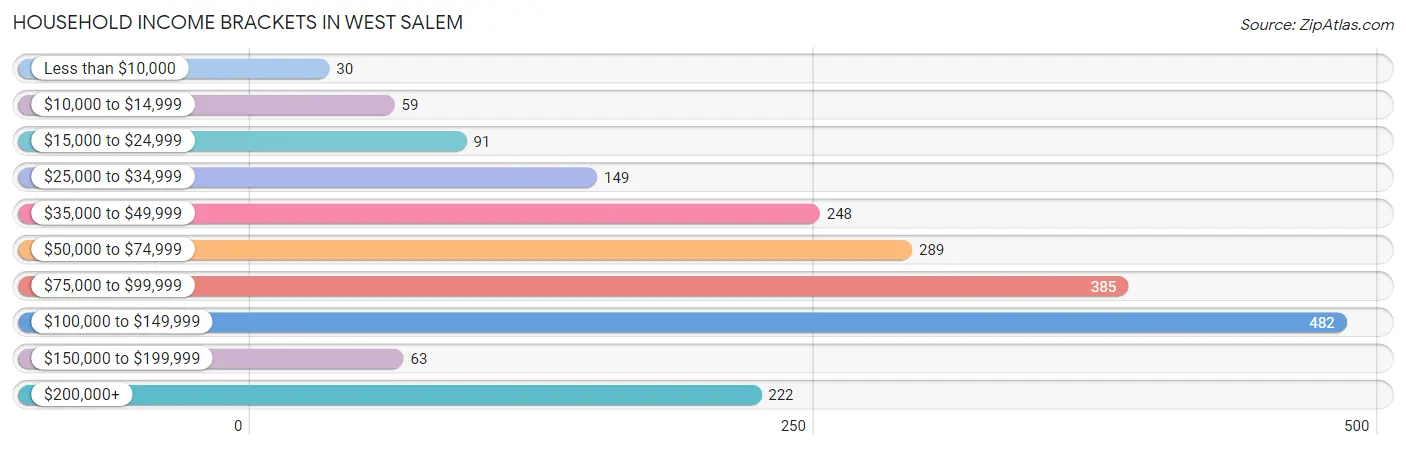
Household Income Brackets in West Salem
With 482 households falling in the category, the $100,000 to $149,999 income range is the most frequent in West Salem, accounting for 23.9% of all households. In contrast, only 30 households (1.5%) fall into the less than $10,000 income bracket, making it the least populous group.
| Income Bracket | # Households | % Households |
| Less than $10,000 | 30 | 1.5% |
| $10,000 to $14,999 | 59 | 2.9% |
| $15,000 to $24,999 | 91 | 4.5% |
| $25,000 to $34,999 | 149 | 7.4% |
| $35,000 to $49,999 | 248 | 12.3% |
| $50,000 to $74,999 | 289 | 14.3% |
| $75,000 to $99,999 | 385 | 19.1% |
| $100,000 to $149,999 | 482 | 23.9% |
| $150,000 to $199,999 | 63 | 3.1% |
| $200,000+ | 222 | 11.0% |
Household Income by Householder Age in West Salem
The median household income in West Salem is $79,891, with the highest median household income of $121,618 found in the 45 to 64 years age bracket for the primary householder. A total of 726 households (36.0%) fall into this category. Meanwhile, the 15 to 24 years age bracket for the primary householder has the lowest median household income of $0, with 36 households (1.8%) in this group.
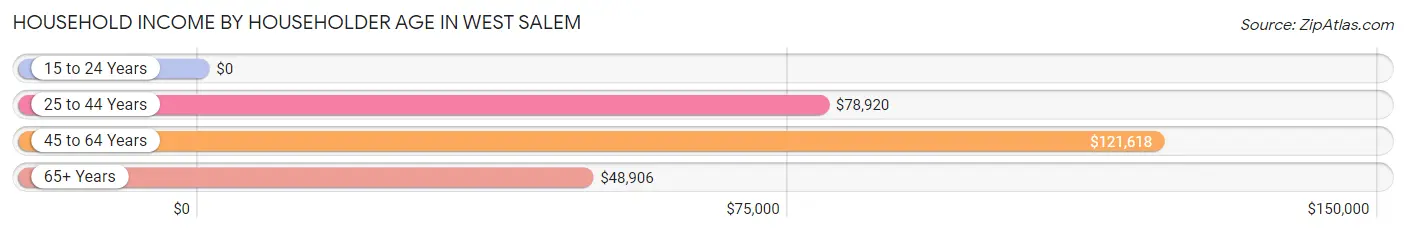
| Income Bracket | # Households | Median Income |
| 15 to 24 Years | 36 (1.8%) | $0 |
| 25 to 44 Years | 642 (31.8%) | $78,920 |
| 45 to 64 Years | 726 (36.0%) | $121,618 |
| 65+ Years | 614 (30.4%) | $48,906 |
| Total | 2,018 (100.0%) | $79,891 |
Poverty in West Salem
Income Below Poverty by Sex and Age in West Salem
With 3.4% poverty level for males and 5.8% for females among the residents of West Salem, 5 year old males and 16 and 17 year old females are the most vulnerable to poverty, with 7 males (25.9%) and 12 females (20.3%) in their respective age groups living below the poverty level.
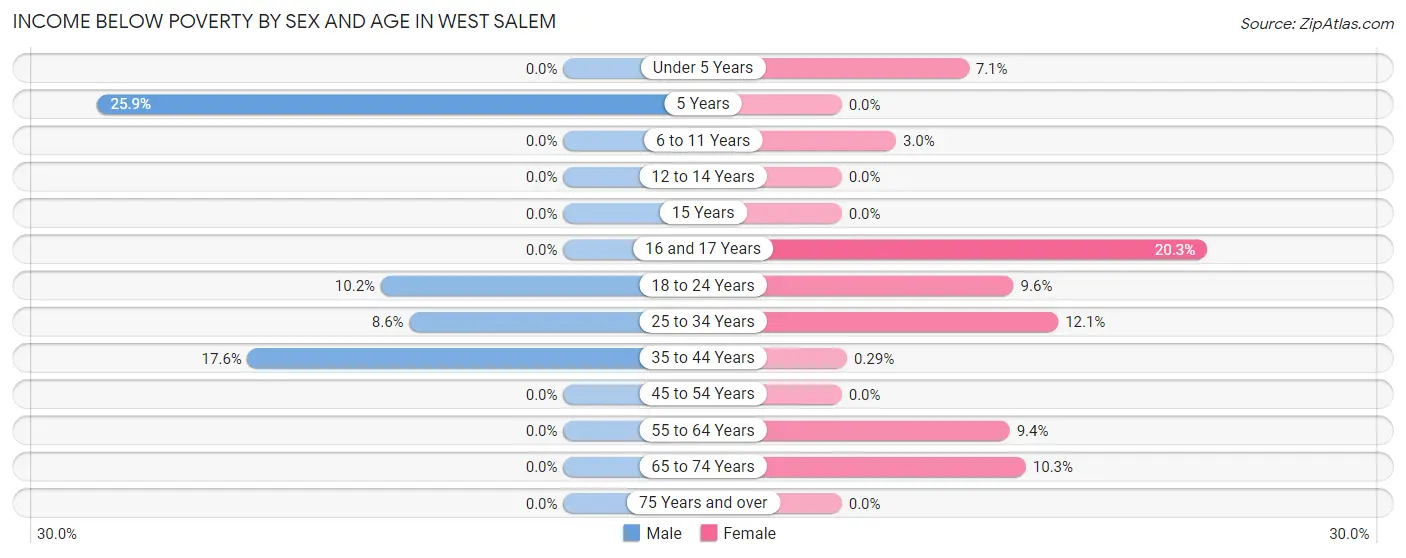
| Age Bracket | Male | Female |
| Under 5 Years | 0 (0.0%) | 7 (7.1%) |
| 5 Years | 7 (25.9%) | 0 (0.0%) |
| 6 to 11 Years | 0 (0.0%) | 7 (3.0%) |
| 12 to 14 Years | 0 (0.0%) | 0 (0.0%) |
| 15 Years | 0 (0.0%) | 0 (0.0%) |
| 16 and 17 Years | 0 (0.0%) | 12 (20.3%) |
| 18 to 24 Years | 13 (10.2%) | 18 (9.6%) |
| 25 to 34 Years | 18 (8.6%) | 30 (12.0%) |
| 35 to 44 Years | 45 (17.6%) | 1 (0.3%) |
| 45 to 54 Years | 0 (0.0%) | 0 (0.0%) |
| 55 to 64 Years | 0 (0.0%) | 42 (9.3%) |
| 65 to 74 Years | 0 (0.0%) | 33 (10.2%) |
| 75 Years and over | 0 (0.0%) | 0 (0.0%) |
| Total | 83 (3.4%) | 150 (5.8%) |
Income Above Poverty by Sex and Age in West Salem
According to the poverty statistics in West Salem, males aged under 5 years and females aged 5 years are the age groups that are most secure financially, with 100.0% of males and 100.0% of females in these age groups living above the poverty line.
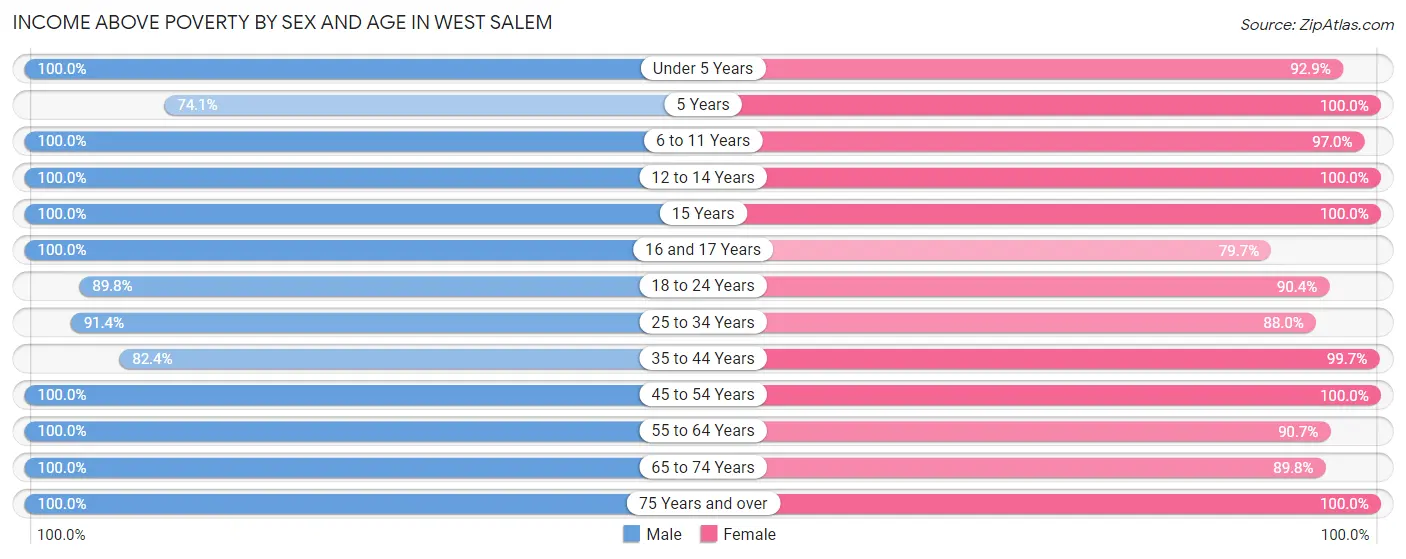
| Age Bracket | Male | Female |
| Under 5 Years | 110 (100.0%) | 92 (92.9%) |
| 5 Years | 20 (74.1%) | 38 (100.0%) |
| 6 to 11 Years | 551 (100.0%) | 225 (97.0%) |
| 12 to 14 Years | 92 (100.0%) | 83 (100.0%) |
| 15 Years | 18 (100.0%) | 24 (100.0%) |
| 16 and 17 Years | 112 (100.0%) | 47 (79.7%) |
| 18 to 24 Years | 115 (89.8%) | 170 (90.4%) |
| 25 to 34 Years | 192 (91.4%) | 219 (87.9%) |
| 35 to 44 Years | 211 (82.4%) | 339 (99.7%) |
| 45 to 54 Years | 278 (100.0%) | 310 (100.0%) |
| 55 to 64 Years | 392 (100.0%) | 407 (90.6%) |
| 65 to 74 Years | 193 (100.0%) | 289 (89.7%) |
| 75 Years and over | 103 (100.0%) | 203 (100.0%) |
| Total | 2,387 (96.6%) | 2,446 (94.2%) |
Income Below Poverty Among Married-Couple Families in West Salem
The poverty statistics for married-couple families in West Salem show that 1.4% or 16 of the total 1,127 families live below the poverty line. Families with 1 or 2 children have the highest poverty rate of 8.6%, comprising of 16 families. On the other hand, families with no children have the lowest poverty rate of 0.0%, which includes 0 families.
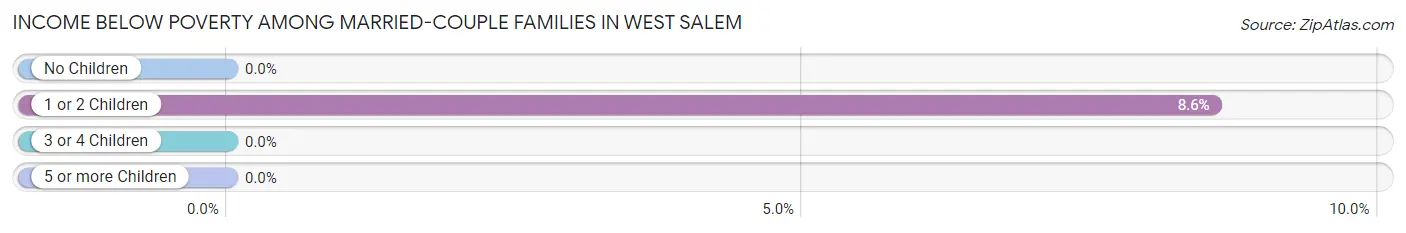
| Children | Above Poverty | Below Poverty |
| No Children | 694 (100.0%) | 0 (0.0%) |
| 1 or 2 Children | 171 (91.4%) | 16 (8.6%) |
| 3 or 4 Children | 246 (100.0%) | 0 (0.0%) |
| 5 or more Children | 0 (0.0%) | 0 (0.0%) |
| Total | 1,111 (98.6%) | 16 (1.4%) |
Income Below Poverty Among Single-Parent Households in West Salem
| Children | Single Father | Single Mother |
| No Children | 0 (0.0%) | 0 (0.0%) |
| 1 or 2 Children | 0 (0.0%) | 0 (0.0%) |
| 3 or 4 Children | 0 (0.0%) | 0 (0.0%) |
| 5 or more Children | 0 (0.0%) | 0 (0.0%) |
| Total | 0 (0.0%) | 0 (0.0%) |
Income Below Poverty Among Married-Couple vs Single-Parent Households in West Salem
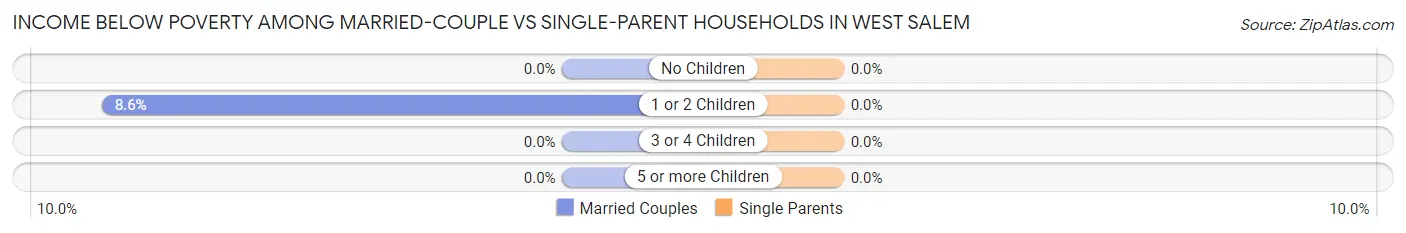
| Children | Married-Couple Families | Single-Parent Households |
| No Children | 0 (0.0%) | 0 (0.0%) |
| 1 or 2 Children | 16 (8.6%) | 0 (0.0%) |
| 3 or 4 Children | 0 (0.0%) | 0 (0.0%) |
| 5 or more Children | 0 (0.0%) | 0 (0.0%) |
| Total | 16 (1.4%) | 0 (0.0%) |
Race in West Salem
The most populous races in West Salem are White / Caucasian (4,754 | 90.5%), Two or more Races (311 | 5.9%), and Asian (160 | 3.0%).
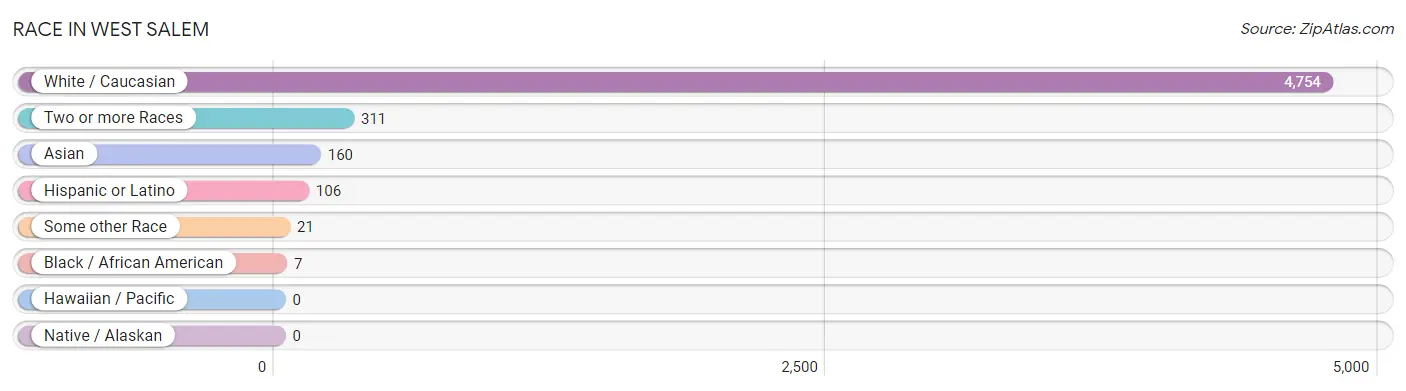
| Race | # Population | % Population |
| Asian | 160 | 3.0% |
| Black / African American | 7 | 0.1% |
| Hawaiian / Pacific | 0 | 0.0% |
| Hispanic or Latino | 106 | 2.0% |
| Native / Alaskan | 0 | 0.0% |
| White / Caucasian | 4,754 | 90.5% |
| Two or more Races | 311 | 5.9% |
| Some other Race | 21 | 0.4% |
| Total | 5,253 | 100.0% |
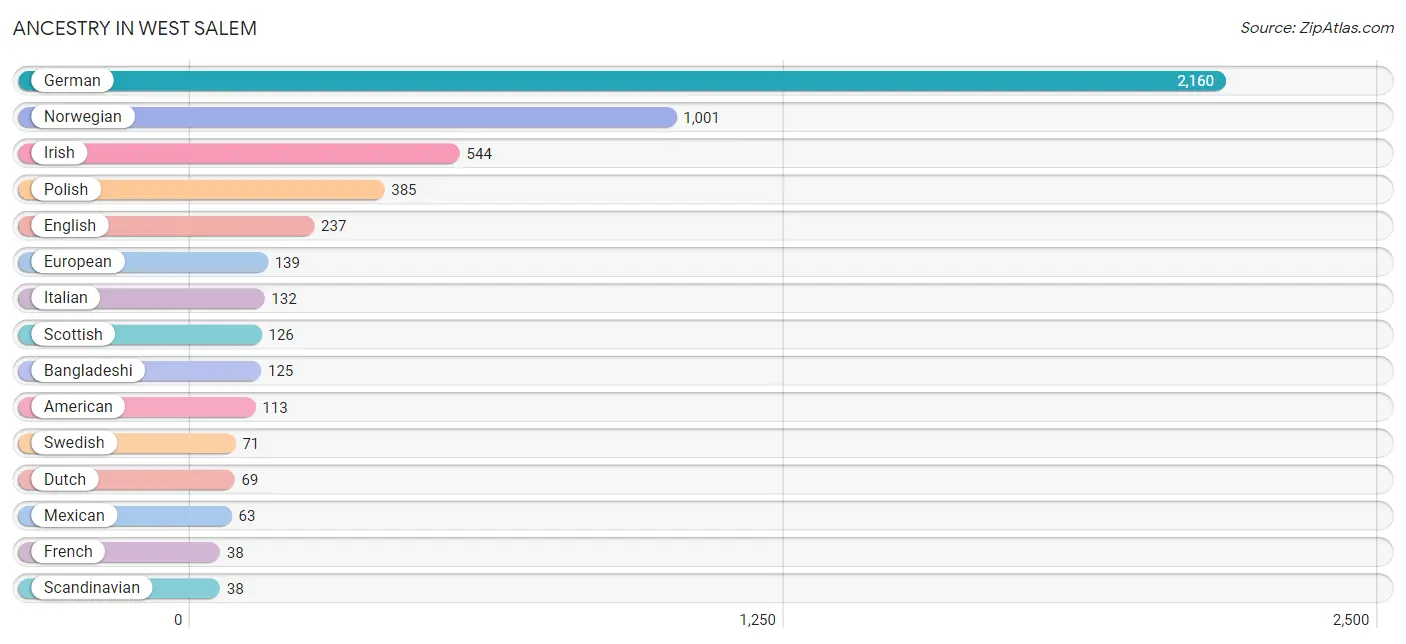
Ancestry in West Salem
The most populous ancestries reported in West Salem are German (2,160 | 41.1%), Norwegian (1,001 | 19.1%), Irish (544 | 10.4%), Polish (385 | 7.3%), and English (237 | 4.5%), together accounting for 82.4% of all West Salem residents.
| Ancestry | # Population | % Population |
| American | 113 | 2.1% |
| Bangladeshi | 125 | 2.4% |
| Cherokee | 17 | 0.3% |
| Chickasaw | 2 | 0.0% |
| Cuban | 28 | 0.5% |
| Czech | 17 | 0.3% |
| Czechoslovakian | 26 | 0.5% |
| Danish | 22 | 0.4% |
| Dutch | 69 | 1.3% |
| Eastern European | 14 | 0.3% |
| English | 237 | 4.5% |
| European | 139 | 2.6% |
| Finnish | 23 | 0.4% |
| French | 38 | 0.7% |
| French Canadian | 16 | 0.3% |
| German | 2,160 | 41.1% |
| Indian (Asian) | 35 | 0.7% |
| Irish | 544 | 10.4% |
| Italian | 132 | 2.5% |
| Mexican | 63 | 1.2% |
| Norwegian | 1,001 | 19.1% |
| Polish | 385 | 7.3% |
| Russian | 37 | 0.7% |
| Scandinavian | 38 | 0.7% |
| Scotch-Irish | 17 | 0.3% |
| Scottish | 126 | 2.4% |
| Swedish | 71 | 1.3% |
| Swiss | 27 | 0.5% |
| Ukrainian | 10 | 0.2% |
| Welsh | 30 | 0.6% | View All 30 Rows |
Immigrants in West Salem
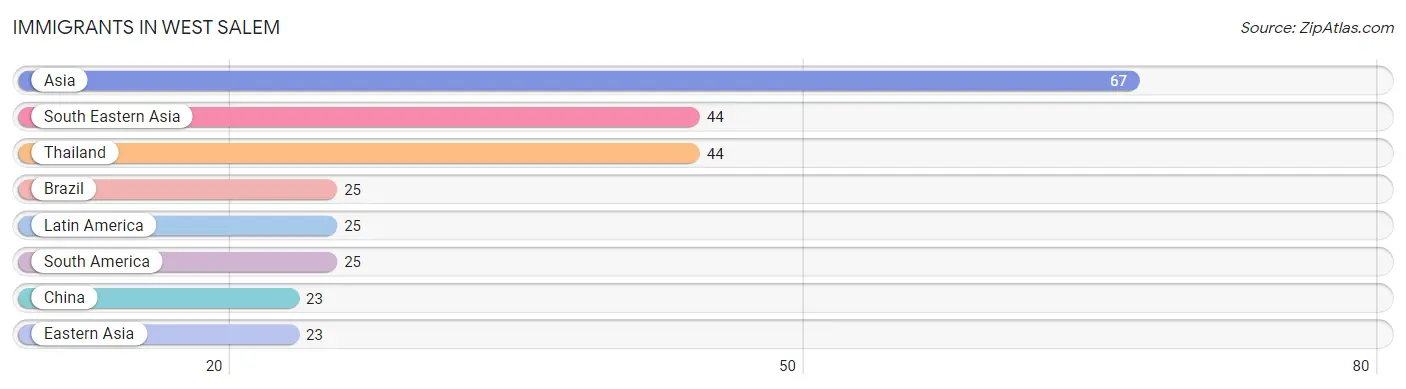
The most numerous immigrant groups reported in West Salem came from Asia (67 | 1.3%), South Eastern Asia (44 | 0.8%), Thailand (44 | 0.8%), Brazil (25 | 0.5%), and Latin America (25 | 0.5%), together accounting for 3.9% of all West Salem residents.
| Immigration Origin | # Population | % Population |
| Asia | 67 | 1.3% |
| Brazil | 25 | 0.5% |
| China | 23 | 0.4% |
| Eastern Asia | 23 | 0.4% |
| Latin America | 25 | 0.5% |
| South America | 25 | 0.5% |
| South Eastern Asia | 44 | 0.8% |
| Thailand | 44 | 0.8% | View All 8 Rows |
Sex and Age in West Salem
Sex and Age in West Salem
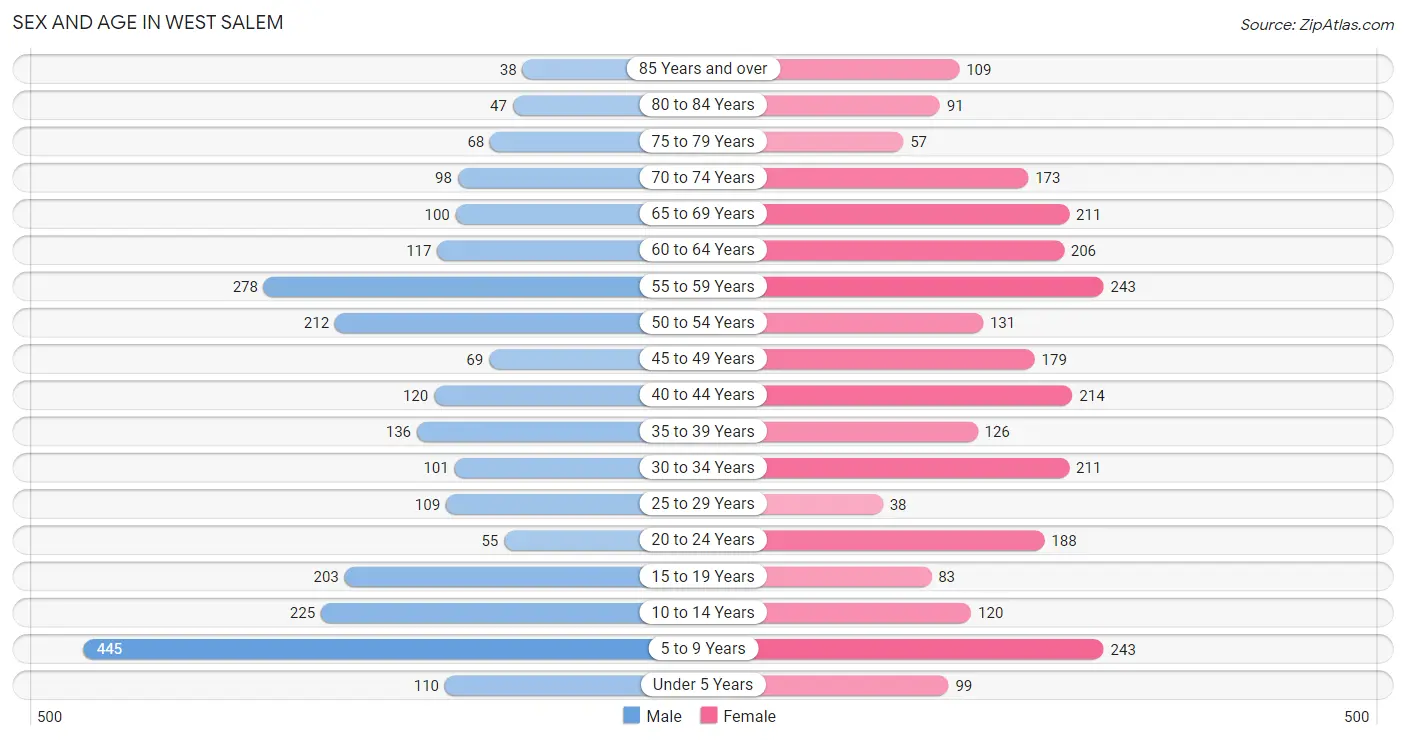
The most populous age groups in West Salem are 5 to 9 Years (445 | 17.6%) for men and 5 to 9 Years (243 | 8.9%) for women.
| Age Bracket | Male | Female |
| Under 5 Years | 110 (4.3%) | 99 (3.6%) |
| 5 to 9 Years | 445 (17.6%) | 243 (8.9%) |
| 10 to 14 Years | 225 (8.9%) | 120 (4.4%) |
| 15 to 19 Years | 203 (8.0%) | 83 (3.0%) |
| 20 to 24 Years | 55 (2.2%) | 188 (6.9%) |
| 25 to 29 Years | 109 (4.3%) | 38 (1.4%) |
| 30 to 34 Years | 101 (4.0%) | 211 (7.7%) |
| 35 to 39 Years | 136 (5.4%) | 126 (4.6%) |
| 40 to 44 Years | 120 (4.7%) | 214 (7.9%) |
| 45 to 49 Years | 69 (2.7%) | 179 (6.6%) |
| 50 to 54 Years | 212 (8.4%) | 131 (4.8%) |
| 55 to 59 Years | 278 (11.0%) | 243 (8.9%) |
| 60 to 64 Years | 117 (4.6%) | 206 (7.6%) |
| 65 to 69 Years | 100 (4.0%) | 211 (7.7%) |
| 70 to 74 Years | 98 (3.9%) | 173 (6.4%) |
| 75 to 79 Years | 68 (2.7%) | 57 (2.1%) |
| 80 to 84 Years | 47 (1.9%) | 91 (3.3%) |
| 85 Years and over | 38 (1.5%) | 109 (4.0%) |
| Total | 2,531 (100.0%) | 2,722 (100.0%) |
Families and Households in West Salem
Median Family Size in West Salem
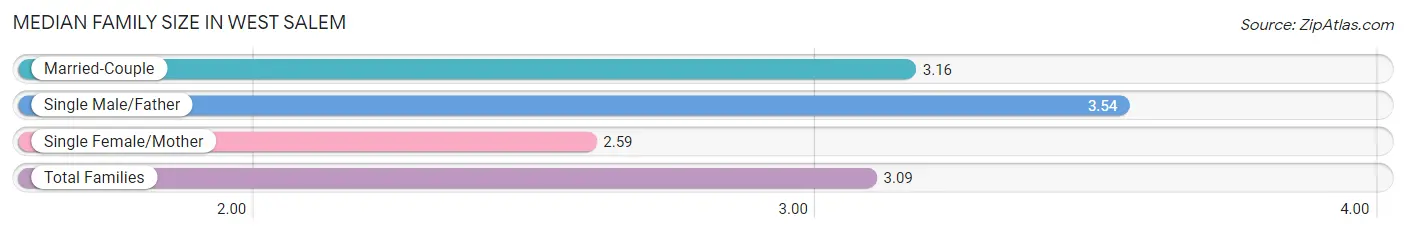
The median family size in West Salem is 3.09 persons per family, with single male/father families (56 | 4.0%) accounting for the largest median family size of 3.54 persons per family. On the other hand, single female/mother families (216 | 15.4%) represent the smallest median family size with 2.59 persons per family.
| Family Type | # Families | Family Size |
| Married-Couple | 1,127 (80.6%) | 3.16 |
| Single Male/Father | 56 (4.0%) | 3.54 |
| Single Female/Mother | 216 (15.4%) | 2.59 |
| Total Families | 1,399 (100.0%) | 3.09 |
Median Household Size in West Salem
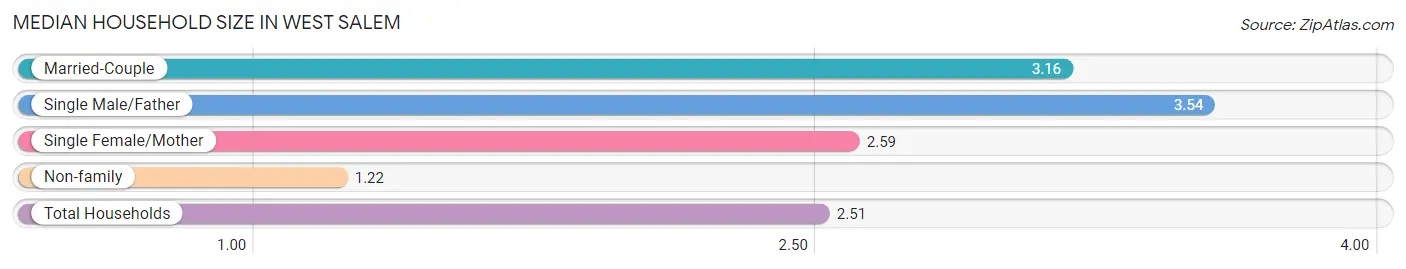
The median household size in West Salem is 2.51 persons per household, with single male/father households (56 | 2.8%) accounting for the largest median household size of 3.54 persons per household. non-family households (619 | 30.7%) represent the smallest median household size with 1.22 persons per household.
| Household Type | # Households | Household Size |
| Married-Couple | 1,127 (55.8%) | 3.16 |
| Single Male/Father | 56 (2.8%) | 3.54 |
| Single Female/Mother | 216 (10.7%) | 2.59 |
| Non-family | 619 (30.7%) | 1.22 |
| Total Households | 2,018 (100.0%) | 2.51 |
Household Size by Marriage Status in West Salem
Out of a total of 2,018 households in West Salem, 1,399 (69.3%) are family households, while 619 (30.7%) are nonfamily households. The most numerous type of family households are 2-person households, comprising 736, and the most common type of nonfamily households are 1-person households, comprising 531.
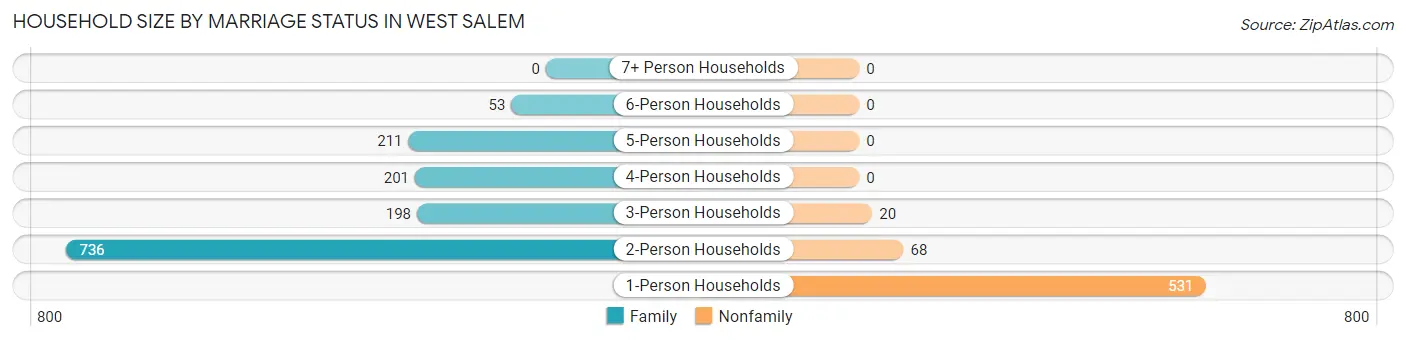
| Household Size | Family Households | Nonfamily Households |
| 1-Person Households | - | 531 (26.3%) |
| 2-Person Households | 736 (36.5%) | 68 (3.4%) |
| 3-Person Households | 198 (9.8%) | 20 (1.0%) |
| 4-Person Households | 201 (10.0%) | 0 (0.0%) |
| 5-Person Households | 211 (10.5%) | 0 (0.0%) |
| 6-Person Households | 53 (2.6%) | 0 (0.0%) |
| 7+ Person Households | 0 (0.0%) | 0 (0.0%) |
| Total | 1,399 (69.3%) | 619 (30.7%) |
Female Fertility in West Salem
Fertility by Age in West Salem
Average fertility rate in West Salem is 20.0 births per 1,000 women. Women in the age bracket of 20 to 34 years have the highest fertility rate with 50.0 births per 1,000 women. Women in the age bracket of 20 to 34 years acount for 100.0% of all women with births.
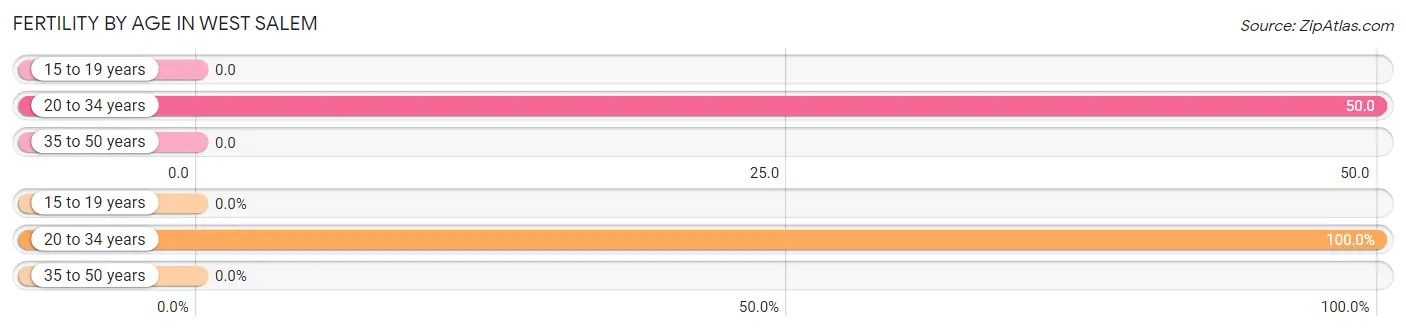
| Age Bracket | Women with Births | Births / 1,000 Women |
| 15 to 19 years | 0 (0.0%) | 0.0 |
| 20 to 34 years | 22 (100.0%) | 50.0 |
| 35 to 50 years | 0 (0.0%) | 0.0 |
| Total | 22 (100.0%) | 20.0 |
Fertility by Age by Marriage Status in West Salem
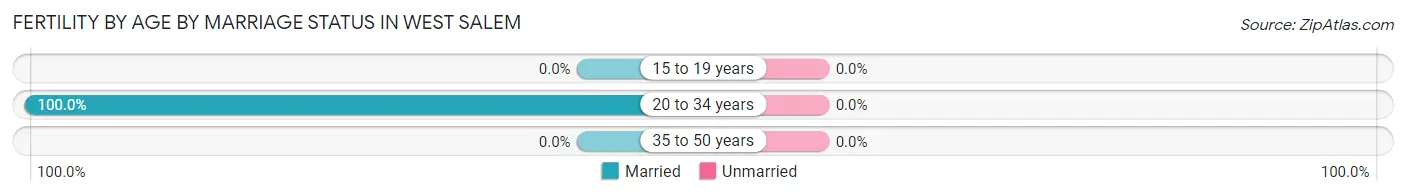
| Age Bracket | Married | Unmarried |
| 15 to 19 years | 0 (0.0%) | 0 (0.0%) |
| 20 to 34 years | 22 (100.0%) | 0 (0.0%) |
| 35 to 50 years | 0 (0.0%) | 0 (0.0%) |
| Total | 22 (100.0%) | 0 (0.0%) |
Fertility by Education in West Salem
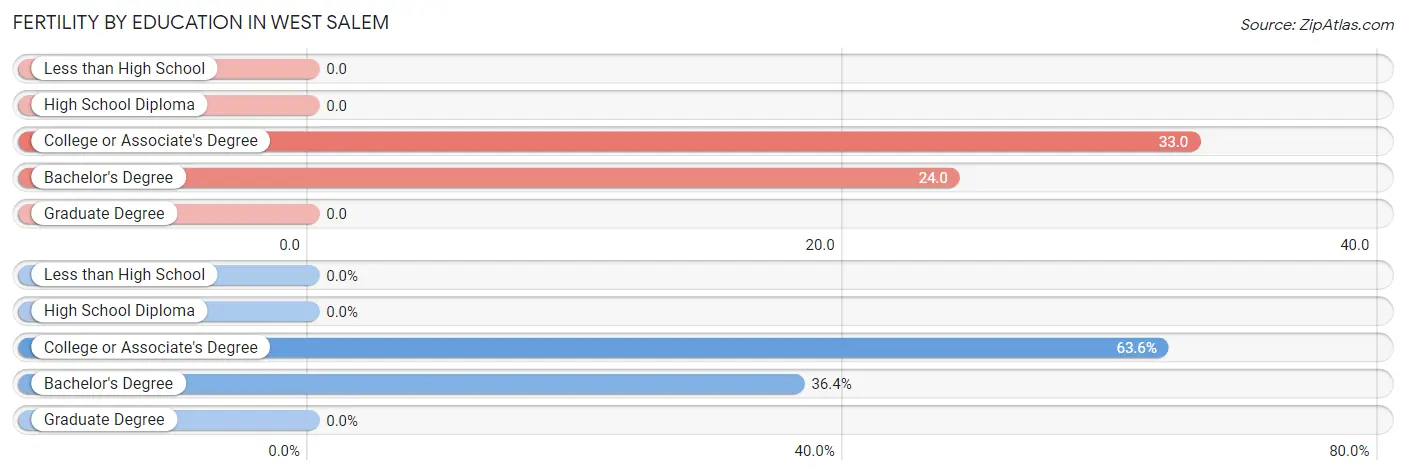
| Educational Attainment | Women with Births | Births / 1,000 Women |
| Less than High School | 0 (0.0%) | 0.0 |
| High School Diploma | 0 (0.0%) | 0.0 |
| College or Associate's Degree | 14 (63.6%) | 33.0 |
| Bachelor's Degree | 8 (36.4%) | 24.0 |
| Graduate Degree | 0 (0.0%) | 0.0 |
| Total | 22 (100.0%) | 20.0 |
Fertility by Education by Marriage Status in West Salem
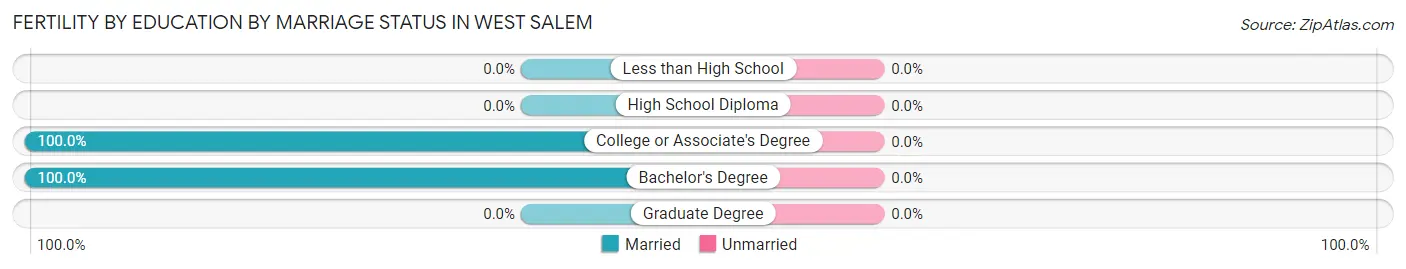
| Educational Attainment | Married | Unmarried |
| Less than High School | 0 (0.0%) | 0 (0.0%) |
| High School Diploma | 0 (0.0%) | 0 (0.0%) |
| College or Associate's Degree | 14 (100.0%) | 0 (0.0%) |
| Bachelor's Degree | 8 (100.0%) | 0 (0.0%) |
| Graduate Degree | 0 (0.0%) | 0 (0.0%) |
| Total | 22 (100.0%) | 0 (0.0%) |
Employment Characteristics in West Salem
Employment by Class of Employer in West Salem
Among the 2,550 employed individuals in West Salem, private company employees (1,466 | 57.5%), not-for-profit organizations (490 | 19.2%), and state government employees (266 | 10.4%) make up the most common classes of employment.
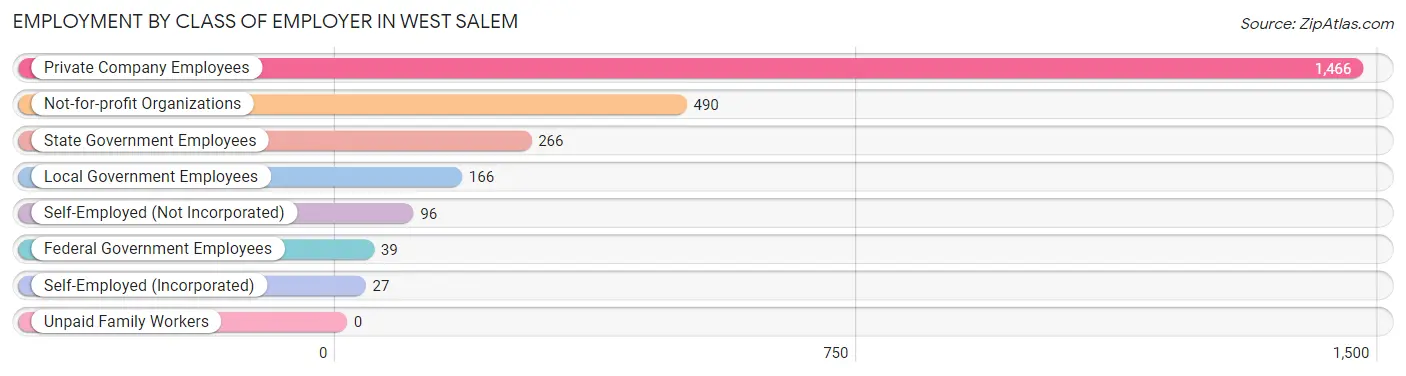
| Employer Class | # Employees | % Employees |
| Private Company Employees | 1,466 | 57.5% |
| Self-Employed (Incorporated) | 27 | 1.1% |
| Self-Employed (Not Incorporated) | 96 | 3.8% |
| Not-for-profit Organizations | 490 | 19.2% |
| Local Government Employees | 166 | 6.5% |
| State Government Employees | 266 | 10.4% |
| Federal Government Employees | 39 | 1.5% |
| Unpaid Family Workers | 0 | 0.0% |
| Total | 2,550 | 100.0% |
Employment Status by Age in West Salem
According to the labor force statistics for West Salem, out of the total population over 16 years of age (3,969), 67.9% or 2,695 individuals are in the labor force, with 2.4% or 65 of them unemployed. The age group with the highest labor force participation rate is 20 to 24 years, with 100.0% or 243 individuals in the labor force. Within the labor force, the 20 to 24 years age range has the highest percentage of unemployed individuals, with 7.4% or 18 of them being unemployed.
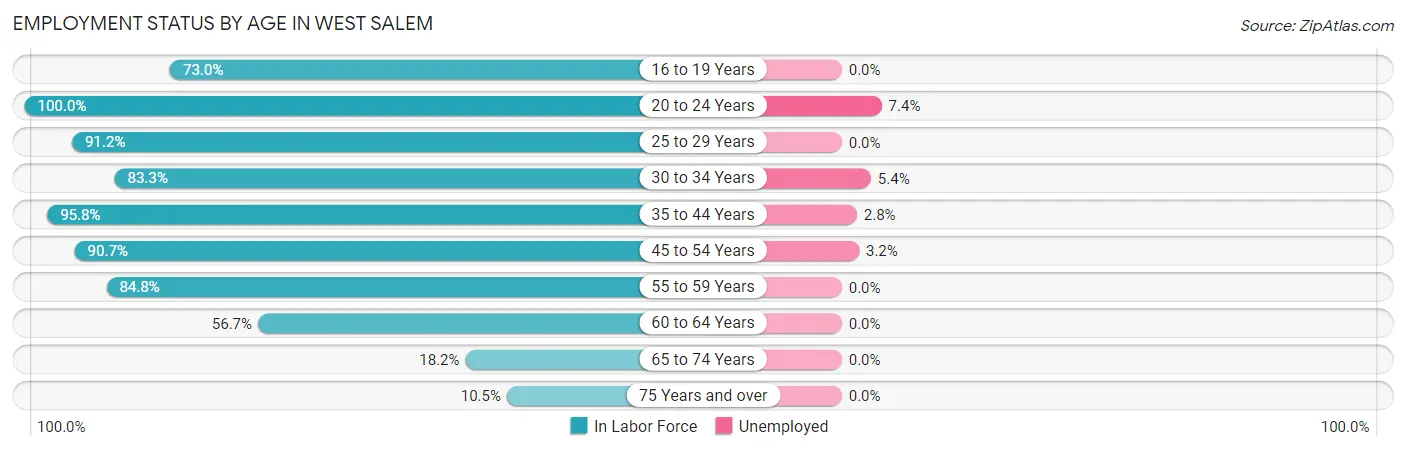
| Age Bracket | In Labor Force | Unemployed |
| 16 to 19 Years | 178 (73.0%) | 0 (0.0%) |
| 20 to 24 Years | 243 (100.0%) | 18 (7.4%) |
| 25 to 29 Years | 134 (91.2%) | 0 (0.0%) |
| 30 to 34 Years | 260 (83.3%) | 14 (5.4%) |
| 35 to 44 Years | 571 (95.8%) | 16 (2.8%) |
| 45 to 54 Years | 536 (90.7%) | 17 (3.2%) |
| 55 to 59 Years | 442 (84.8%) | 0 (0.0%) |
| 60 to 64 Years | 183 (56.7%) | 0 (0.0%) |
| 65 to 74 Years | 106 (18.2%) | 0 (0.0%) |
| 75 Years and over | 43 (10.5%) | 0 (0.0%) |
| Total | 2,695 (67.9%) | 65 (2.4%) |
Employment Status by Educational Attainment in West Salem
According to labor force statistics for West Salem, 85.4% of individuals (2,126) out of the total population between 25 and 64 years of age (2,490) are in the labor force, with 2.2% or 47 of them being unemployed. The group with the highest labor force participation rate are those with the educational attainment of bachelor's degree or higher, with 95.8% or 1,044 individuals in the labor force. Within the labor force, individuals with high school diploma education have the highest percentage of unemployment, with 4.9% or 13 of them being unemployed.
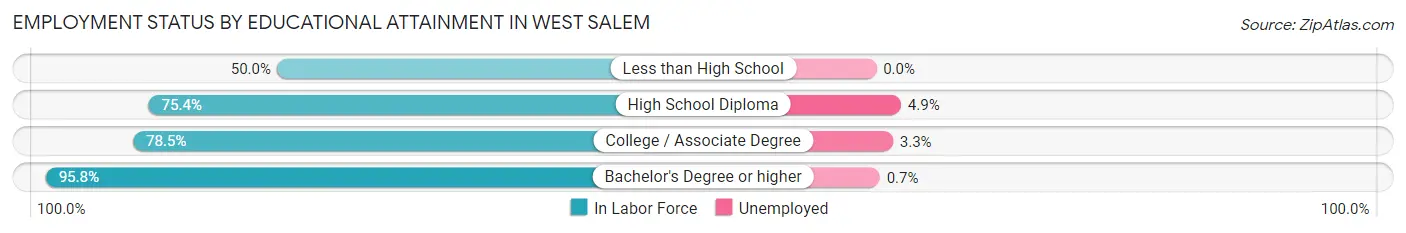
| Educational Attainment | In Labor Force | Unemployed |
| Less than High School | 10 (50.0%) | 0 (0.0%) |
| High School Diploma | 263 (75.4%) | 17 (4.9%) |
| College / Associate Degree | 809 (78.5%) | 34 (3.3%) |
| Bachelor's Degree or higher | 1,044 (95.8%) | 8 (0.7%) |
| Total | 2,126 (85.4%) | 55 (2.2%) |
Employment Occupations by Sex in West Salem
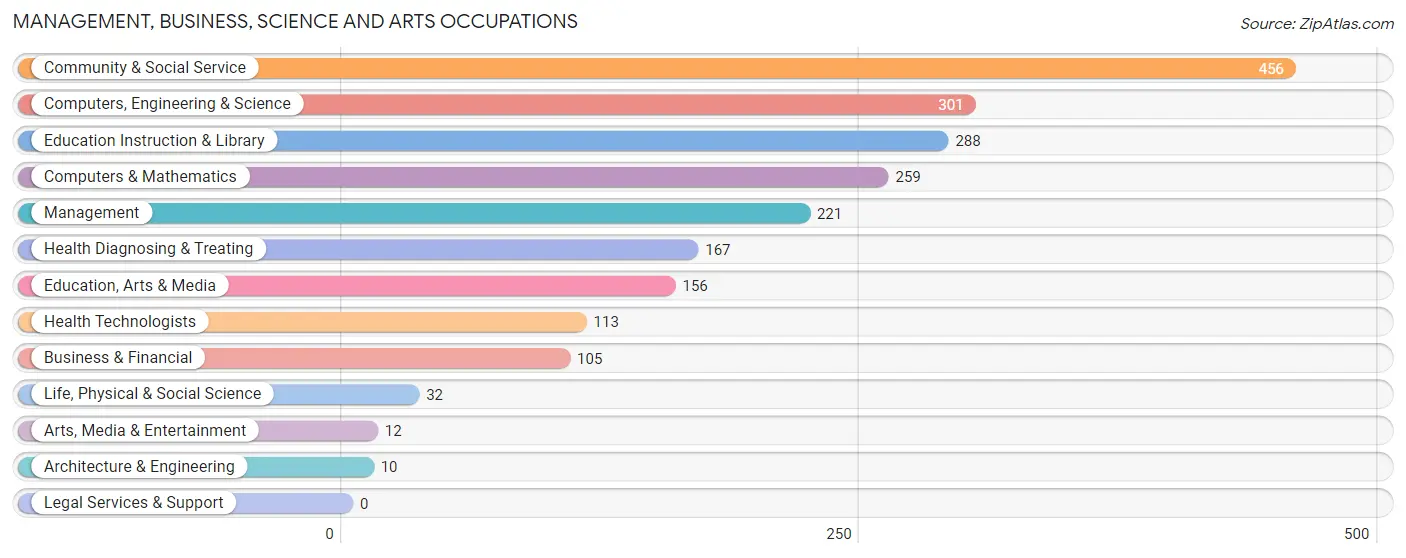
Management, Business, Science and Arts Occupations
The most common Management, Business, Science and Arts occupations in West Salem are Community & Social Service (456 | 17.3%), Computers, Engineering & Science (301 | 11.4%), Education Instruction & Library (288 | 11.0%), Computers & Mathematics (259 | 9.8%), and Management (221 | 8.4%).
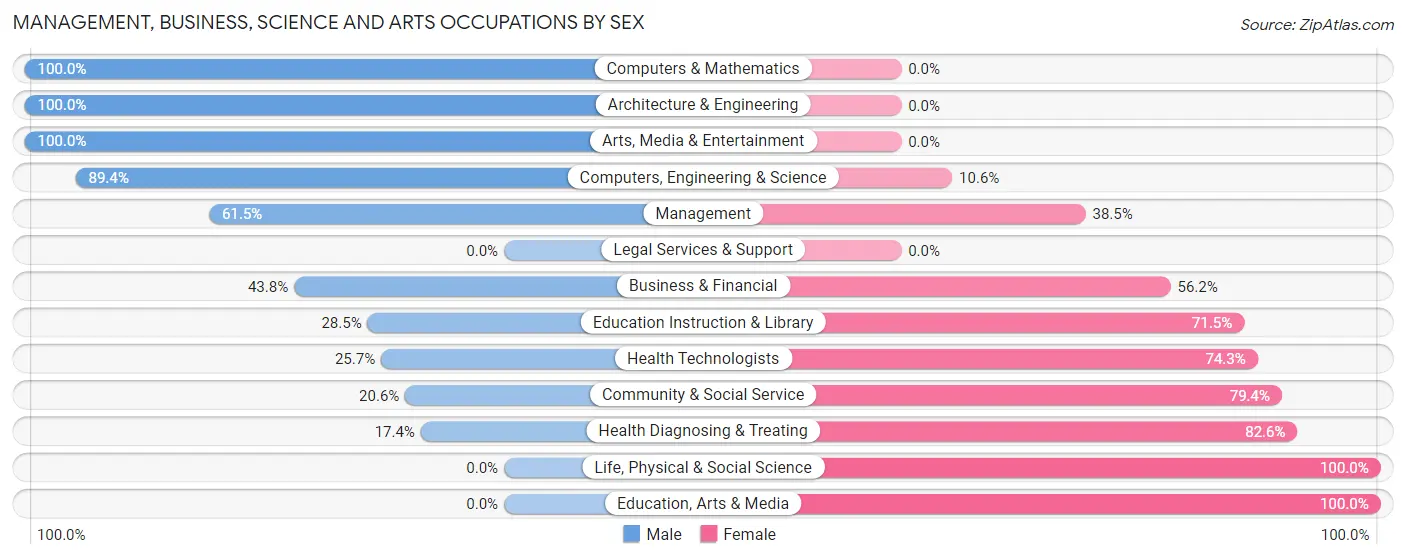
Management, Business, Science and Arts Occupations by Sex
Within the Management, Business, Science and Arts occupations in West Salem, the most male-oriented occupations are Computers & Mathematics (100.0%), Architecture & Engineering (100.0%), and Arts, Media & Entertainment (100.0%), while the most female-oriented occupations are Life, Physical & Social Science (100.0%), Education, Arts & Media (100.0%), and Health Diagnosing & Treating (82.6%).
| Occupation | Male | Female |
| Management | 136 (61.5%) | 85 (38.5%) |
| Business & Financial | 46 (43.8%) | 59 (56.2%) |
| Computers, Engineering & Science | 269 (89.4%) | 32 (10.6%) |
| Computers & Mathematics | 259 (100.0%) | 0 (0.0%) |
| Architecture & Engineering | 10 (100.0%) | 0 (0.0%) |
| Life, Physical & Social Science | 0 (0.0%) | 32 (100.0%) |
| Community & Social Service | 94 (20.6%) | 362 (79.4%) |
| Education, Arts & Media | 0 (0.0%) | 156 (100.0%) |
| Legal Services & Support | 0 (0.0%) | 0 (0.0%) |
| Education Instruction & Library | 82 (28.5%) | 206 (71.5%) |
| Arts, Media & Entertainment | 12 (100.0%) | 0 (0.0%) |
| Health Diagnosing & Treating | 29 (17.4%) | 138 (82.6%) |
| Health Technologists | 29 (25.7%) | 84 (74.3%) |
| Total (Category) | 574 (45.9%) | 676 (54.1%) |
| Total (Overall) | 1,257 (47.8%) | 1,374 (52.2%) |
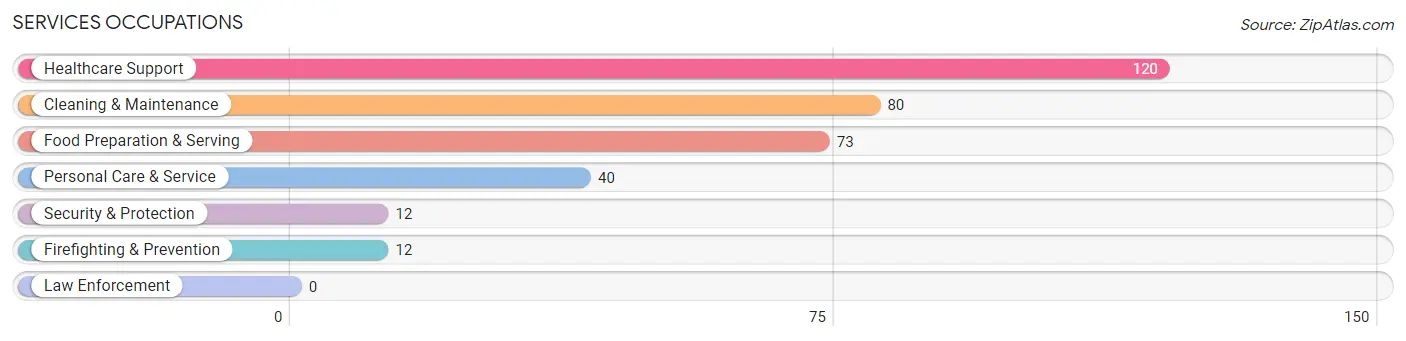
Services Occupations
The most common Services occupations in West Salem are Healthcare Support (120 | 4.6%), Cleaning & Maintenance (80 | 3.0%), Food Preparation & Serving (73 | 2.8%), Personal Care & Service (40 | 1.5%), and Security & Protection (12 | 0.5%).
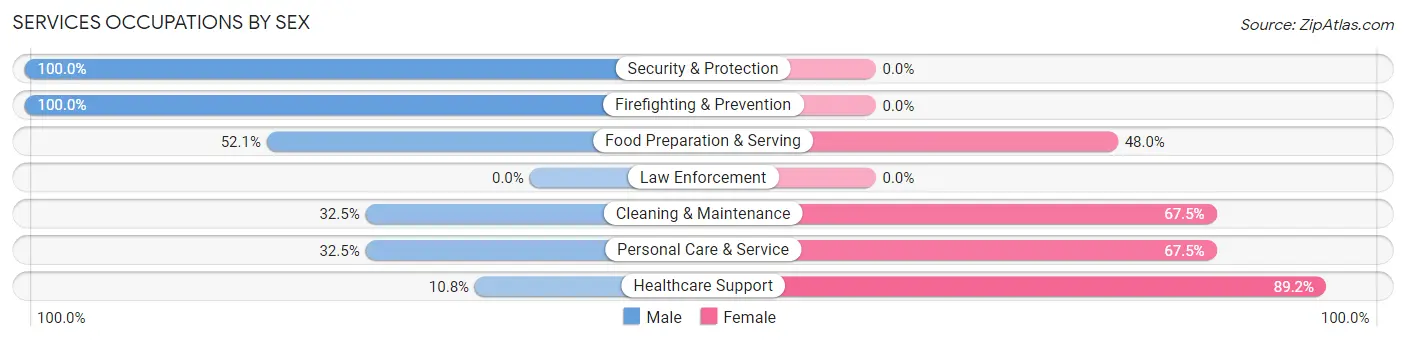
Services Occupations by Sex
Within the Services occupations in West Salem, the most male-oriented occupations are Security & Protection (100.0%), Firefighting & Prevention (100.0%), and Food Preparation & Serving (52.0%), while the most female-oriented occupations are Healthcare Support (89.2%), Cleaning & Maintenance (67.5%), and Personal Care & Service (67.5%).
| Occupation | Male | Female |
| Healthcare Support | 13 (10.8%) | 107 (89.2%) |
| Security & Protection | 12 (100.0%) | 0 (0.0%) |
| Firefighting & Prevention | 12 (100.0%) | 0 (0.0%) |
| Law Enforcement | 0 (0.0%) | 0 (0.0%) |
| Food Preparation & Serving | 38 (52.0%) | 35 (47.9%) |
| Cleaning & Maintenance | 26 (32.5%) | 54 (67.5%) |
| Personal Care & Service | 13 (32.5%) | 27 (67.5%) |
| Total (Category) | 102 (31.4%) | 223 (68.6%) |
| Total (Overall) | 1,257 (47.8%) | 1,374 (52.2%) |
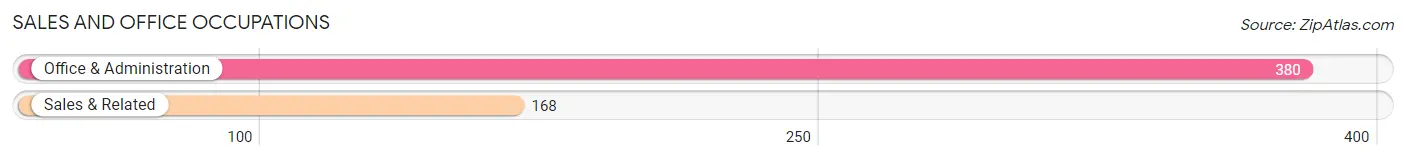
Sales and Office Occupations
The most common Sales and Office occupations in West Salem are Office & Administration (380 | 14.4%), and Sales & Related (168 | 6.4%).
Sales and Office Occupations by Sex
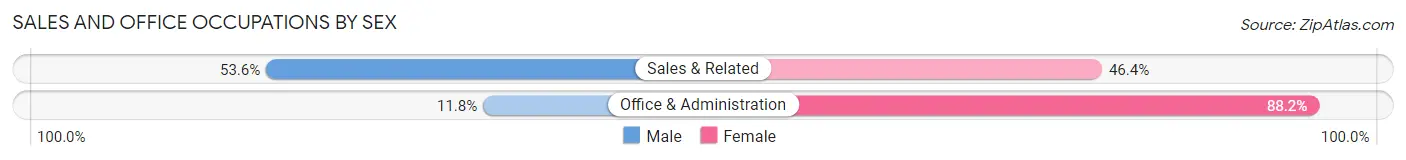
| Occupation | Male | Female |
| Sales & Related | 90 (53.6%) | 78 (46.4%) |
| Office & Administration | 45 (11.8%) | 335 (88.2%) |
| Total (Category) | 135 (24.6%) | 413 (75.4%) |
| Total (Overall) | 1,257 (47.8%) | 1,374 (52.2%) |
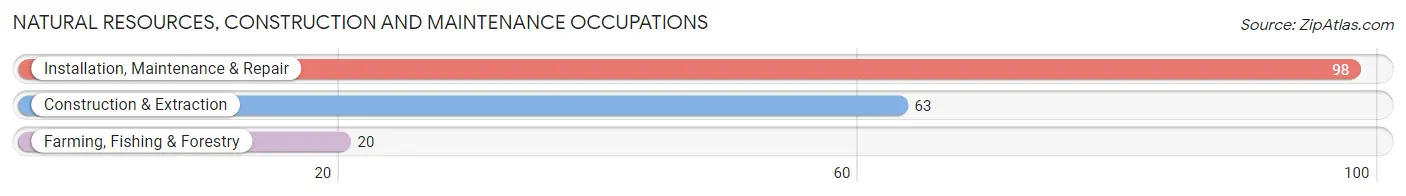
Natural Resources, Construction and Maintenance Occupations
The most common Natural Resources, Construction and Maintenance occupations in West Salem are Installation, Maintenance & Repair (98 | 3.7%), Construction & Extraction (63 | 2.4%), and Farming, Fishing & Forestry (20 | 0.8%).
Natural Resources, Construction and Maintenance Occupations by Sex
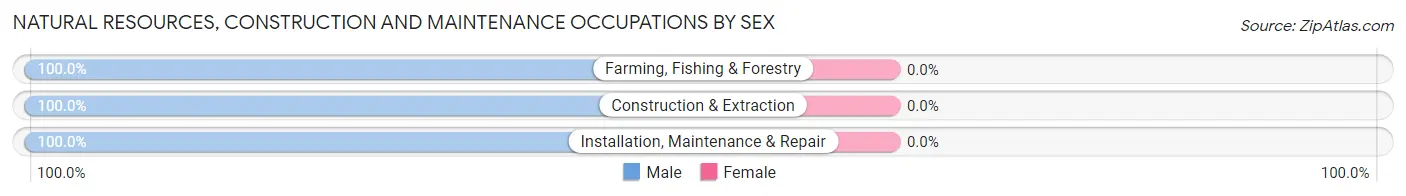
| Occupation | Male | Female |
| Farming, Fishing & Forestry | 20 (100.0%) | 0 (0.0%) |
| Construction & Extraction | 63 (100.0%) | 0 (0.0%) |
| Installation, Maintenance & Repair | 98 (100.0%) | 0 (0.0%) |
| Total (Category) | 181 (100.0%) | 0 (0.0%) |
| Total (Overall) | 1,257 (47.8%) | 1,374 (52.2%) |
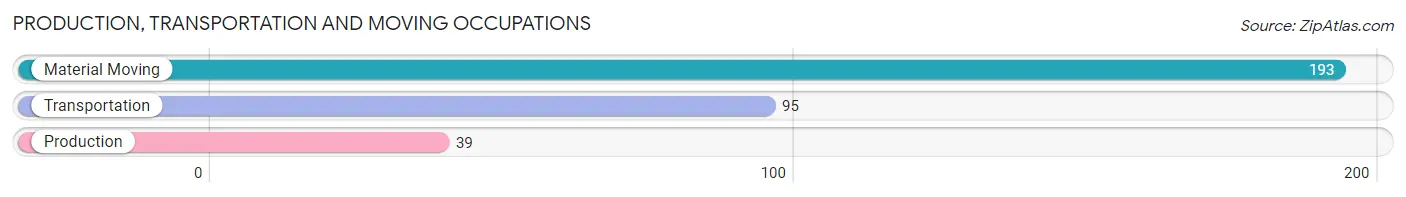
Production, Transportation and Moving Occupations
The most common Production, Transportation and Moving occupations in West Salem are Material Moving (193 | 7.3%), Transportation (95 | 3.6%), and Production (39 | 1.5%).
Production, Transportation and Moving Occupations by Sex
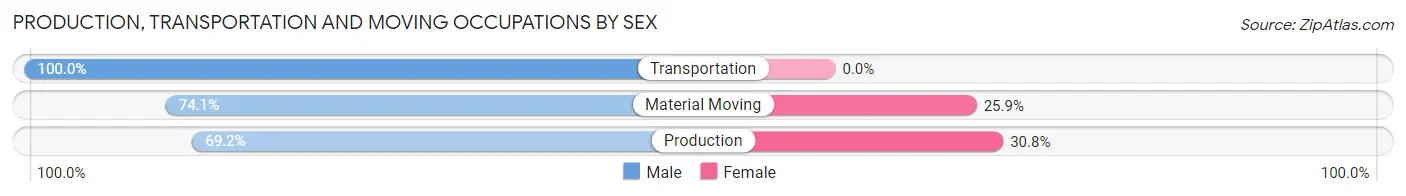
| Occupation | Male | Female |
| Production | 27 (69.2%) | 12 (30.8%) |
| Transportation | 95 (100.0%) | 0 (0.0%) |
| Material Moving | 143 (74.1%) | 50 (25.9%) |
| Total (Category) | 265 (81.0%) | 62 (19.0%) |
| Total (Overall) | 1,257 (47.8%) | 1,374 (52.2%) |
Employment Industries by Sex in West Salem
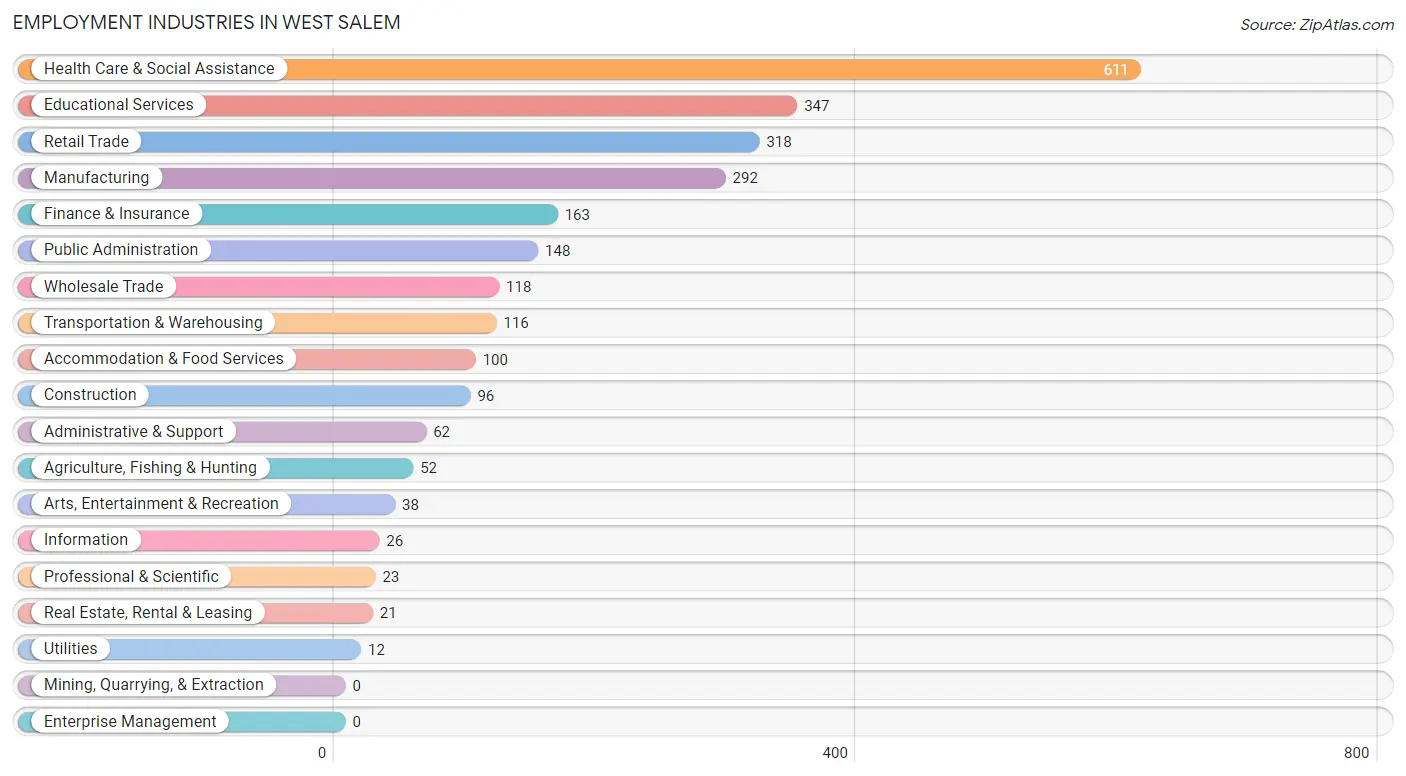
Employment Industries in West Salem
The major employment industries in West Salem include Health Care & Social Assistance (611 | 23.2%), Educational Services (347 | 13.2%), Retail Trade (318 | 12.1%), Manufacturing (292 | 11.1%), and Finance & Insurance (163 | 6.2%).
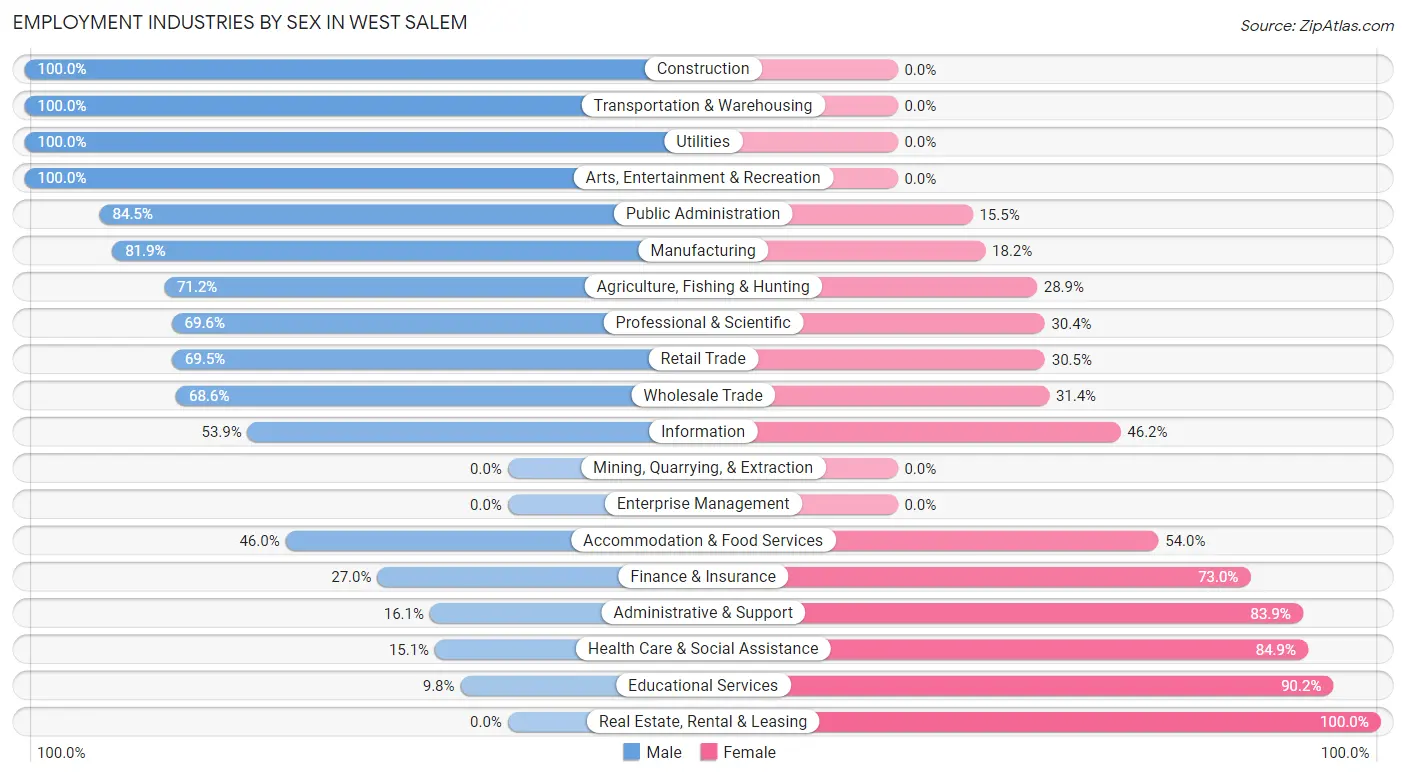
Employment Industries by Sex in West Salem
The West Salem industries that see more men than women are Construction (100.0%), Transportation & Warehousing (100.0%), and Utilities (100.0%), whereas the industries that tend to have a higher number of women are Real Estate, Rental & Leasing (100.0%), Educational Services (90.2%), and Health Care & Social Assistance (84.9%).
| Industry | Male | Female |
| Agriculture, Fishing & Hunting | 37 (71.2%) | 15 (28.8%) |
| Mining, Quarrying, & Extraction | 0 (0.0%) | 0 (0.0%) |
| Construction | 96 (100.0%) | 0 (0.0%) |
| Manufacturing | 239 (81.9%) | 53 (18.1%) |
| Wholesale Trade | 81 (68.6%) | 37 (31.4%) |
| Retail Trade | 221 (69.5%) | 97 (30.5%) |
| Transportation & Warehousing | 116 (100.0%) | 0 (0.0%) |
| Utilities | 12 (100.0%) | 0 (0.0%) |
| Information | 14 (53.8%) | 12 (46.2%) |
| Finance & Insurance | 44 (27.0%) | 119 (73.0%) |
| Real Estate, Rental & Leasing | 0 (0.0%) | 21 (100.0%) |
| Professional & Scientific | 16 (69.6%) | 7 (30.4%) |
| Enterprise Management | 0 (0.0%) | 0 (0.0%) |
| Administrative & Support | 10 (16.1%) | 52 (83.9%) |
| Educational Services | 34 (9.8%) | 313 (90.2%) |
| Health Care & Social Assistance | 92 (15.1%) | 519 (84.9%) |
| Arts, Entertainment & Recreation | 38 (100.0%) | 0 (0.0%) |
| Accommodation & Food Services | 46 (46.0%) | 54 (54.0%) |
| Public Administration | 125 (84.5%) | 23 (15.5%) |
| Total | 1,257 (47.8%) | 1,374 (52.2%) |
Education in West Salem
School Enrollment in West Salem
The most common levels of schooling among the 1,446 students in West Salem are elementary school (614 | 42.5%), middle school (318 | 22.0%), and high school (240 | 16.6%).
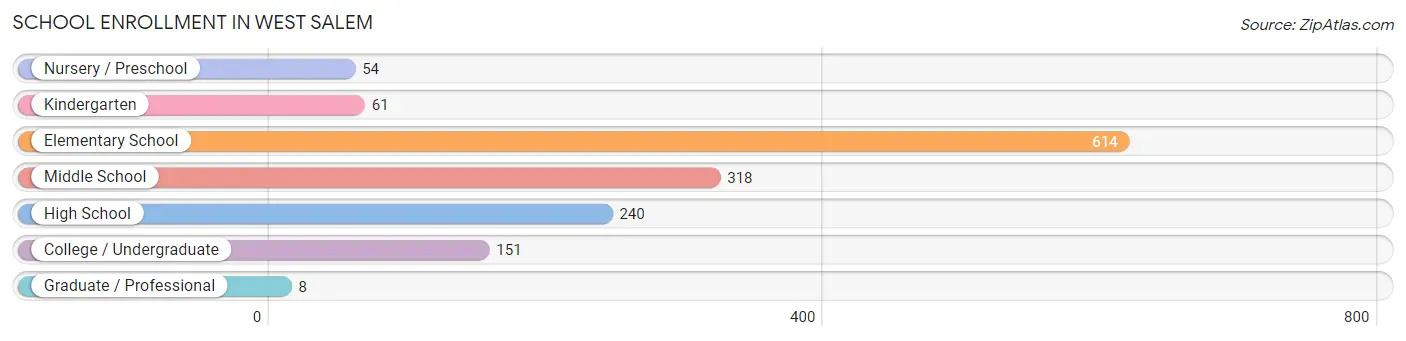
| School Level | # Students | % Students |
| Nursery / Preschool | 54 | 3.7% |
| Kindergarten | 61 | 4.2% |
| Elementary School | 614 | 42.5% |
| Middle School | 318 | 22.0% |
| High School | 240 | 16.6% |
| College / Undergraduate | 151 | 10.4% |
| Graduate / Professional | 8 | 0.5% |
| Total | 1,446 | 100.0% |
School Enrollment by Age by Funding Source in West Salem
Out of a total of 1,446 students who are enrolled in schools in West Salem, 91 (6.3%) attend a private institution, while the remaining 1,355 (93.7%) are enrolled in public schools. The age group of 3 to 4 year olds has the highest likelihood of being enrolled in private schools, with 32 (76.2% in the age bracket) enrolled. Conversely, the age group of 10 to 14 year olds has the lowest likelihood of being enrolled in a private school, with 345 (100.0% in the age bracket) attending a public institution.
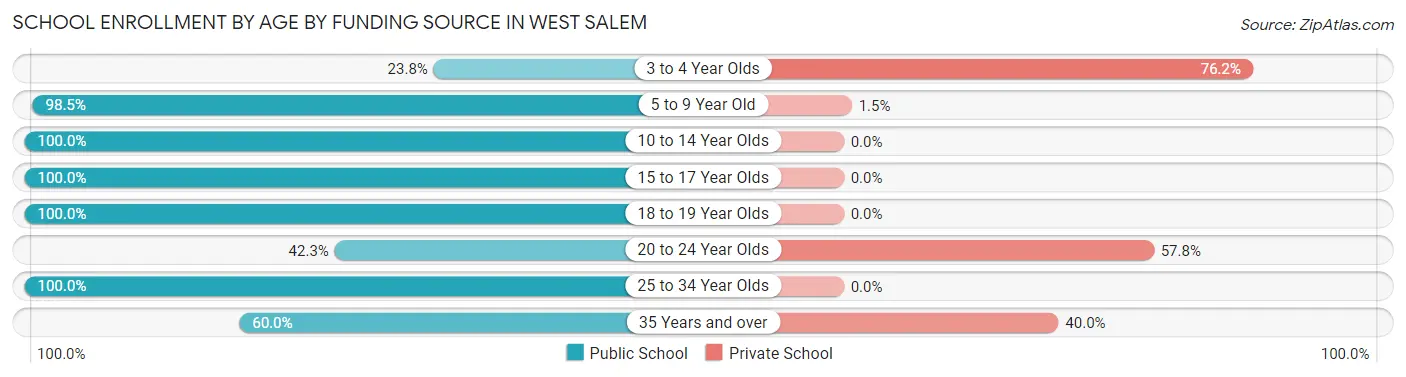
| Age Bracket | Public School | Private School |
| 3 to 4 Year Olds | 10 (23.8%) | 32 (76.2%) |
| 5 to 9 Year Old | 658 (98.5%) | 10 (1.5%) |
| 10 to 14 Year Olds | 345 (100.0%) | 0 (0.0%) |
| 15 to 17 Year Olds | 213 (100.0%) | 0 (0.0%) |
| 18 to 19 Year Olds | 50 (100.0%) | 0 (0.0%) |
| 20 to 24 Year Olds | 30 (42.2%) | 41 (57.8%) |
| 25 to 34 Year Olds | 37 (100.0%) | 0 (0.0%) |
| 35 Years and over | 12 (60.0%) | 8 (40.0%) |
| Total | 1,355 (93.7%) | 91 (6.3%) |
Educational Attainment by Field of Study in West Salem
Education (334 | 24.3%), business (198 | 14.4%), engineering (174 | 12.6%), physical & health sciences (150 | 10.9%), and science & technology (102 | 7.4%) are the most common fields of study among 1,377 individuals in West Salem who have obtained a bachelor's degree or higher.
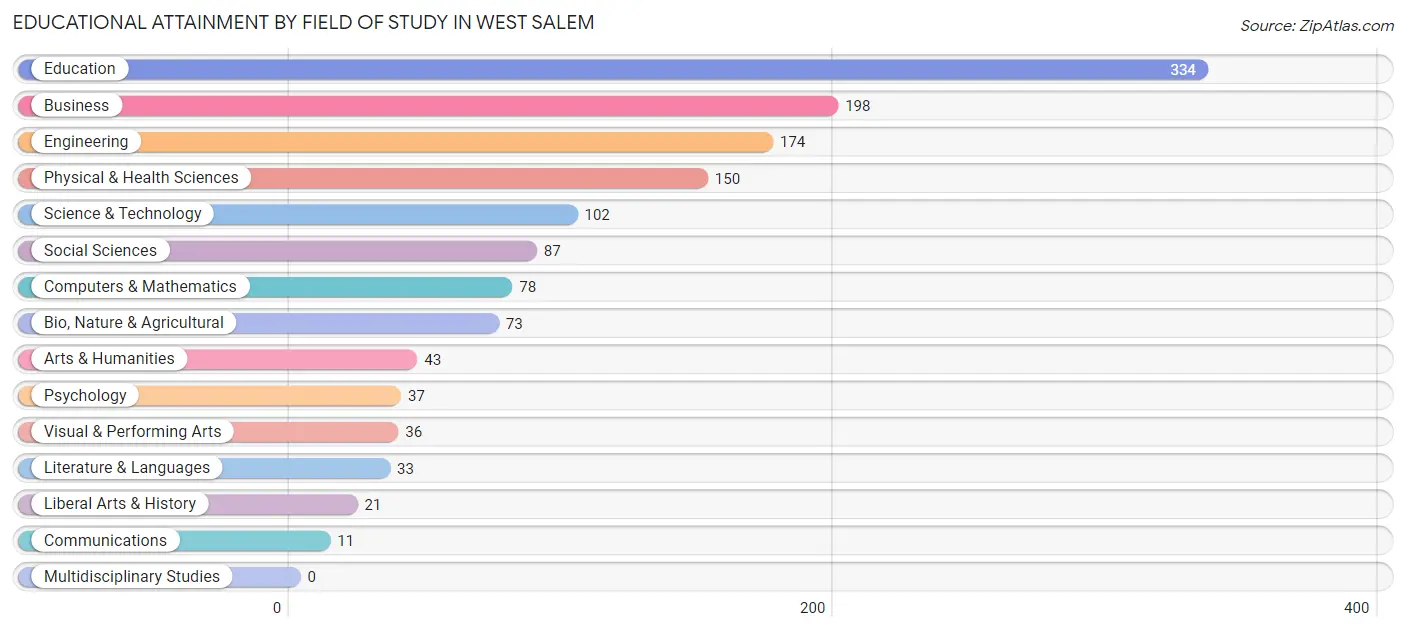
| Field of Study | # Graduates | % Graduates |
| Computers & Mathematics | 78 | 5.7% |
| Bio, Nature & Agricultural | 73 | 5.3% |
| Physical & Health Sciences | 150 | 10.9% |
| Psychology | 37 | 2.7% |
| Social Sciences | 87 | 6.3% |
| Engineering | 174 | 12.6% |
| Multidisciplinary Studies | 0 | 0.0% |
| Science & Technology | 102 | 7.4% |
| Business | 198 | 14.4% |
| Education | 334 | 24.3% |
| Literature & Languages | 33 | 2.4% |
| Liberal Arts & History | 21 | 1.5% |
| Visual & Performing Arts | 36 | 2.6% |
| Communications | 11 | 0.8% |
| Arts & Humanities | 43 | 3.1% |
| Total | 1,377 | 100.0% |
Transportation & Commute in West Salem
Vehicle Availability by Sex in West Salem
The most prevalent vehicle ownership categories in West Salem are males with 2 vehicles (619, accounting for 50.1%) and females with 2 vehicles (556, making up 47.1%).
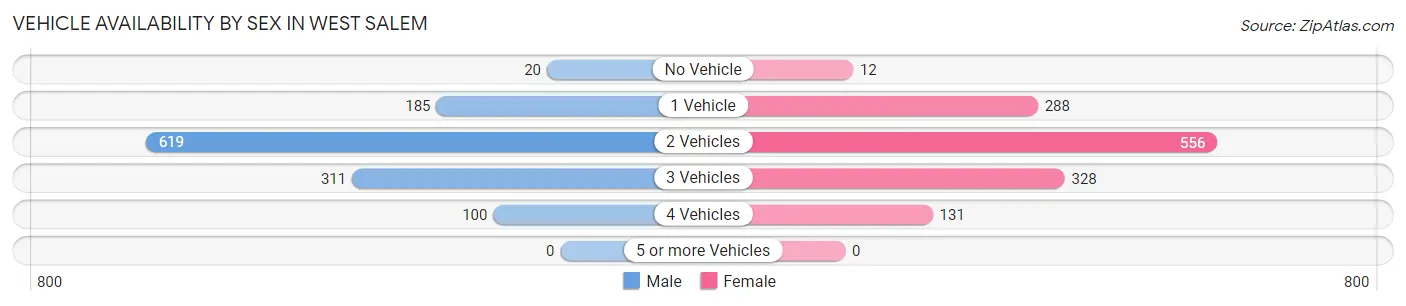
| Vehicles Available | Male | Female |
| No Vehicle | 20 (1.6%) | 12 (0.9%) |
| 1 Vehicle | 185 (15.0%) | 288 (21.9%) |
| 2 Vehicles | 619 (50.1%) | 556 (42.3%) |
| 3 Vehicles | 311 (25.2%) | 328 (24.9%) |
| 4 Vehicles | 100 (8.1%) | 131 (10.0%) |
| 5 or more Vehicles | 0 (0.0%) | 0 (0.0%) |
| Total | 1,235 (100.0%) | 1,315 (100.0%) |
Commute Time in West Salem
The most frequently occuring commute durations in West Salem are 15 to 19 minutes (602 commuters, 26.0%), 20 to 24 minutes (452 commuters, 19.5%), and 25 to 29 minutes (300 commuters, 13.0%).
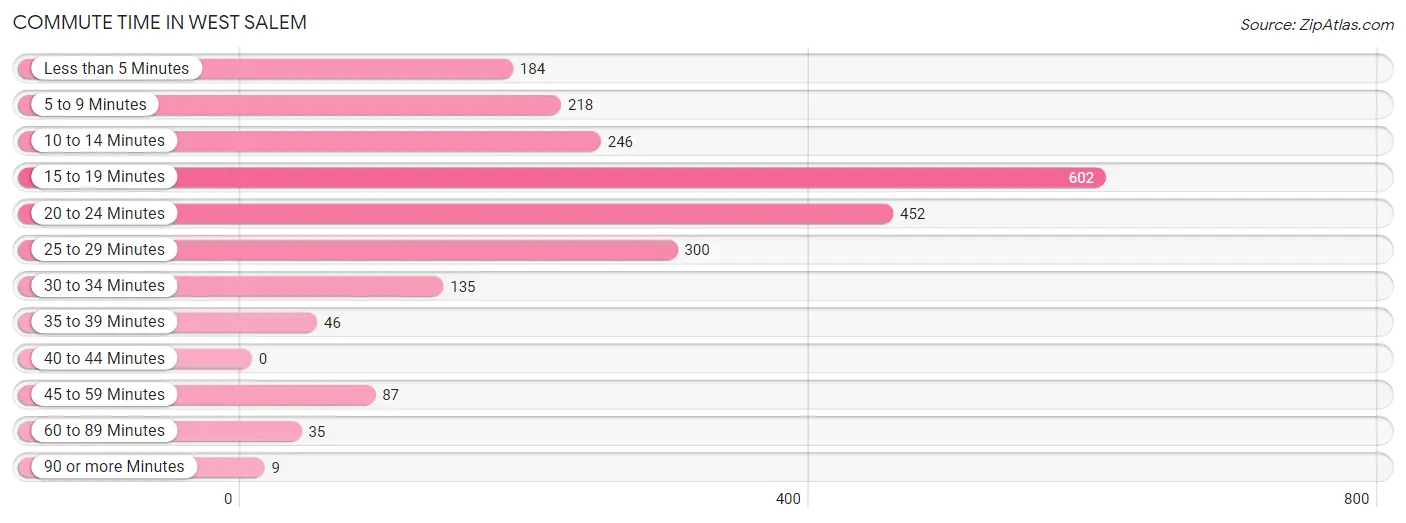
| Commute Time | # Commuters | % Commuters |
| Less than 5 Minutes | 184 | 8.0% |
| 5 to 9 Minutes | 218 | 9.4% |
| 10 to 14 Minutes | 246 | 10.6% |
| 15 to 19 Minutes | 602 | 26.0% |
| 20 to 24 Minutes | 452 | 19.5% |
| 25 to 29 Minutes | 300 | 13.0% |
| 30 to 34 Minutes | 135 | 5.8% |
| 35 to 39 Minutes | 46 | 2.0% |
| 40 to 44 Minutes | 0 | 0.0% |
| 45 to 59 Minutes | 87 | 3.8% |
| 60 to 89 Minutes | 35 | 1.5% |
| 90 or more Minutes | 9 | 0.4% |
Commute Time by Sex in West Salem
The most common commute times in West Salem are 15 to 19 minutes (256 commuters, 22.0%) for males and 15 to 19 minutes (346 commuters, 30.1%) for females.
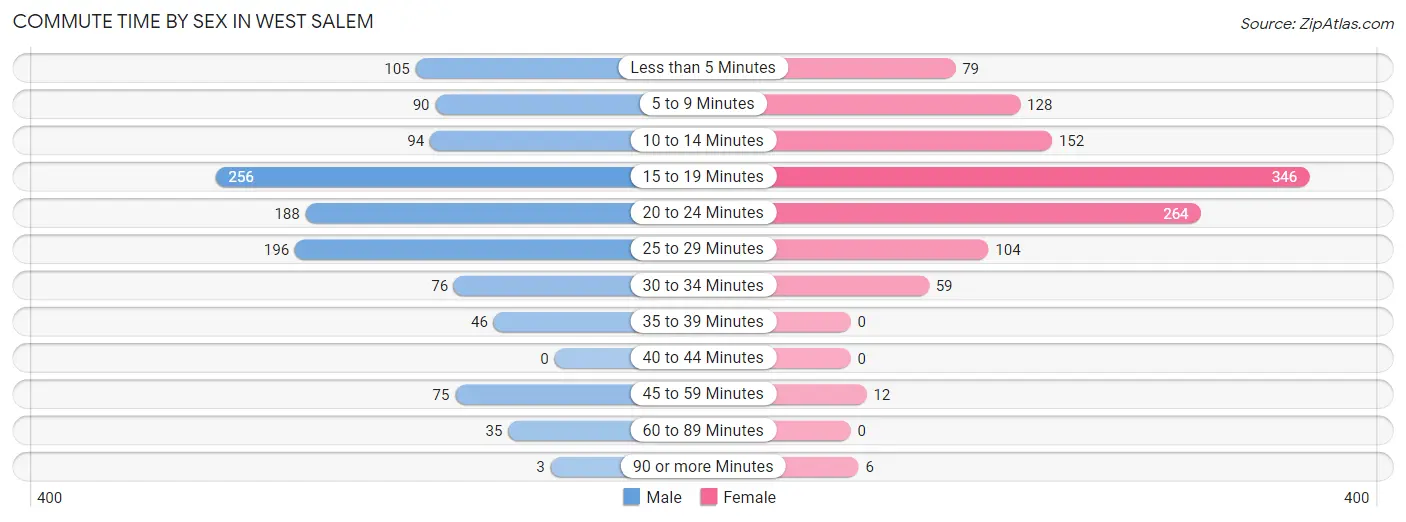
| Commute Time | Male | Female |
| Less than 5 Minutes | 105 (9.0%) | 79 (6.9%) |
| 5 to 9 Minutes | 90 (7.7%) | 128 (11.1%) |
| 10 to 14 Minutes | 94 (8.1%) | 152 (13.2%) |
| 15 to 19 Minutes | 256 (22.0%) | 346 (30.1%) |
| 20 to 24 Minutes | 188 (16.2%) | 264 (23.0%) |
| 25 to 29 Minutes | 196 (16.8%) | 104 (9.0%) |
| 30 to 34 Minutes | 76 (6.5%) | 59 (5.1%) |
| 35 to 39 Minutes | 46 (4.0%) | 0 (0.0%) |
| 40 to 44 Minutes | 0 (0.0%) | 0 (0.0%) |
| 45 to 59 Minutes | 75 (6.4%) | 12 (1.0%) |
| 60 to 89 Minutes | 35 (3.0%) | 0 (0.0%) |
| 90 or more Minutes | 3 (0.3%) | 6 (0.5%) |
Time of Departure to Work by Sex in West Salem
The most frequent times of departure to work in West Salem are 7:00 AM to 7:29 AM (269, 23.1%) for males and 7:30 AM to 7:59 AM (444, 38.6%) for females.
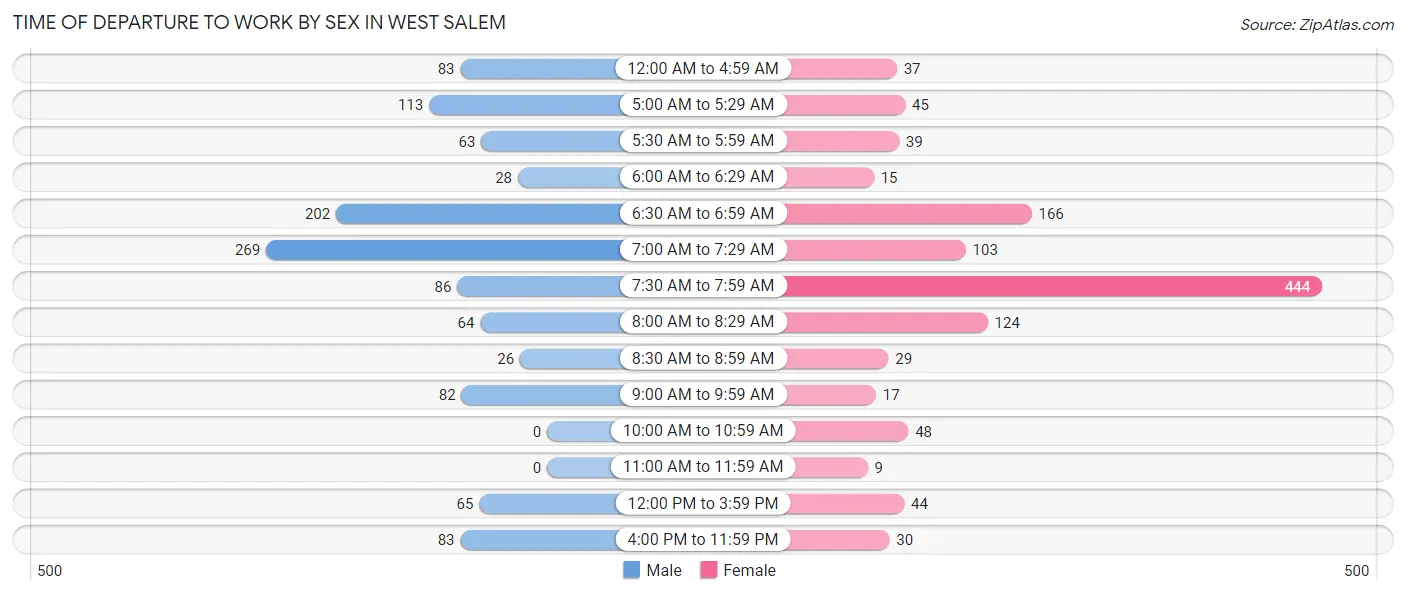
| Time of Departure | Male | Female |
| 12:00 AM to 4:59 AM | 83 (7.1%) | 37 (3.2%) |
| 5:00 AM to 5:29 AM | 113 (9.7%) | 45 (3.9%) |
| 5:30 AM to 5:59 AM | 63 (5.4%) | 39 (3.4%) |
| 6:00 AM to 6:29 AM | 28 (2.4%) | 15 (1.3%) |
| 6:30 AM to 6:59 AM | 202 (17.3%) | 166 (14.4%) |
| 7:00 AM to 7:29 AM | 269 (23.1%) | 103 (9.0%) |
| 7:30 AM to 7:59 AM | 86 (7.4%) | 444 (38.6%) |
| 8:00 AM to 8:29 AM | 64 (5.5%) | 124 (10.8%) |
| 8:30 AM to 8:59 AM | 26 (2.2%) | 29 (2.5%) |
| 9:00 AM to 9:59 AM | 82 (7.0%) | 17 (1.5%) |
| 10:00 AM to 10:59 AM | 0 (0.0%) | 48 (4.2%) |
| 11:00 AM to 11:59 AM | 0 (0.0%) | 9 (0.8%) |
| 12:00 PM to 3:59 PM | 65 (5.6%) | 44 (3.8%) |
| 4:00 PM to 11:59 PM | 83 (7.1%) | 30 (2.6%) |
| Total | 1,164 (100.0%) | 1,150 (100.0%) |
Housing Occupancy in West Salem
Occupancy by Ownership in West Salem
Of the total 2,018 dwellings in West Salem, owner-occupied units account for 1,422 (70.5%), while renter-occupied units make up 596 (29.5%).
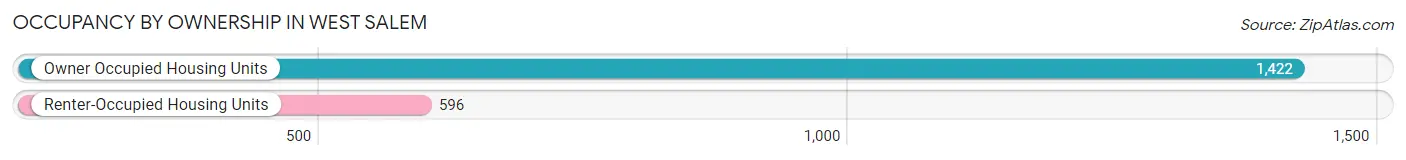
| Occupancy | # Housing Units | % Housing Units |
| Owner Occupied Housing Units | 1,422 | 70.5% |
| Renter-Occupied Housing Units | 596 | 29.5% |
| Total Occupied Housing Units | 2,018 | 100.0% |
Occupancy by Household Size in West Salem
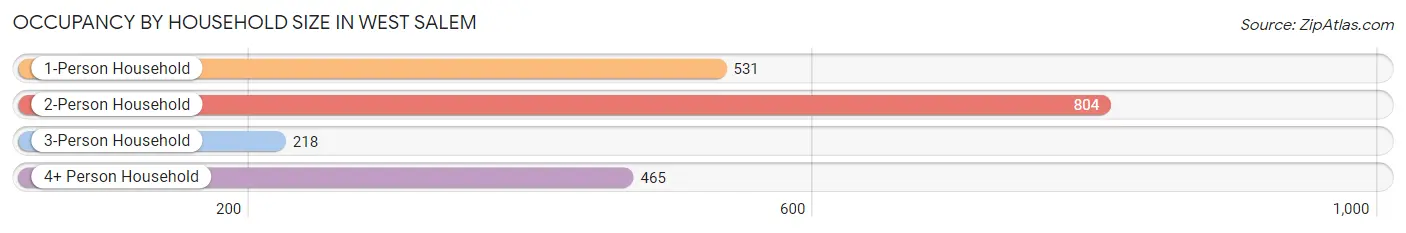
| Household Size | # Housing Units | % Housing Units |
| 1-Person Household | 531 | 26.3% |
| 2-Person Household | 804 | 39.8% |
| 3-Person Household | 218 | 10.8% |
| 4+ Person Household | 465 | 23.0% |
| Total Housing Units | 2,018 | 100.0% |
Occupancy by Ownership by Household Size in West Salem
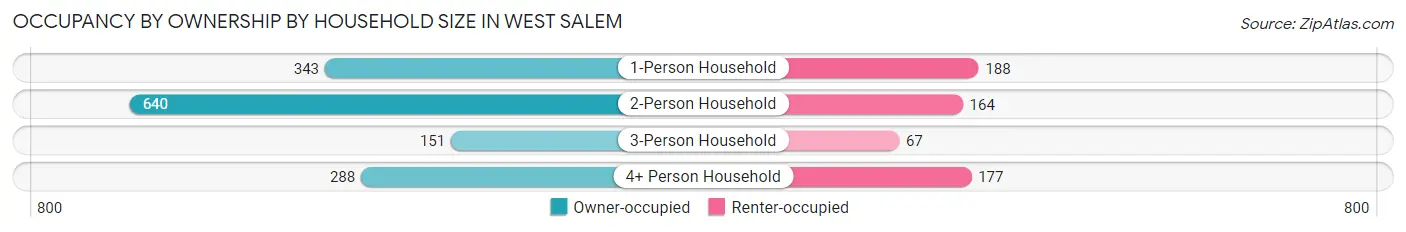
| Household Size | Owner-occupied | Renter-occupied |
| 1-Person Household | 343 (64.6%) | 188 (35.4%) |
| 2-Person Household | 640 (79.6%) | 164 (20.4%) |
| 3-Person Household | 151 (69.3%) | 67 (30.7%) |
| 4+ Person Household | 288 (61.9%) | 177 (38.1%) |
| Total Housing Units | 1,422 (70.5%) | 596 (29.5%) |
Occupancy by Educational Attainment in West Salem
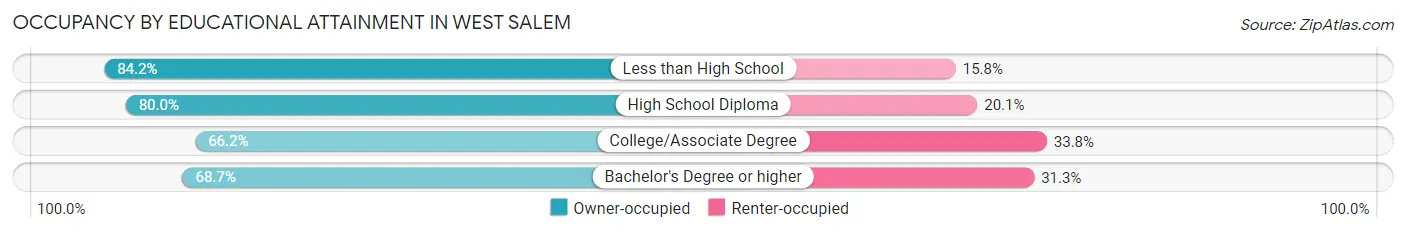
| Household Size | Owner-occupied | Renter-occupied |
| Less than High School | 32 (84.2%) | 6 (15.8%) |
| High School Diploma | 343 (79.9%) | 86 (20.1%) |
| College/Associate Degree | 477 (66.2%) | 244 (33.8%) |
| Bachelor's Degree or higher | 570 (68.7%) | 260 (31.3%) |
Occupancy by Age of Householder in West Salem
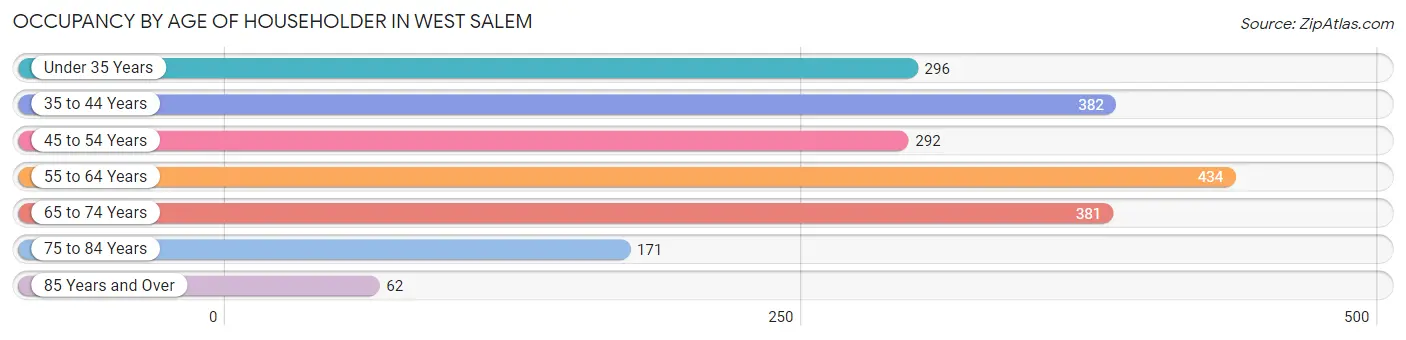
| Age Bracket | # Households | % Households |
| Under 35 Years | 296 | 14.7% |
| 35 to 44 Years | 382 | 18.9% |
| 45 to 54 Years | 292 | 14.5% |
| 55 to 64 Years | 434 | 21.5% |
| 65 to 74 Years | 381 | 18.9% |
| 75 to 84 Years | 171 | 8.5% |
| 85 Years and Over | 62 | 3.1% |
| Total | 2,018 | 100.0% |
Housing Finances in West Salem
Median Income by Occupancy in West Salem
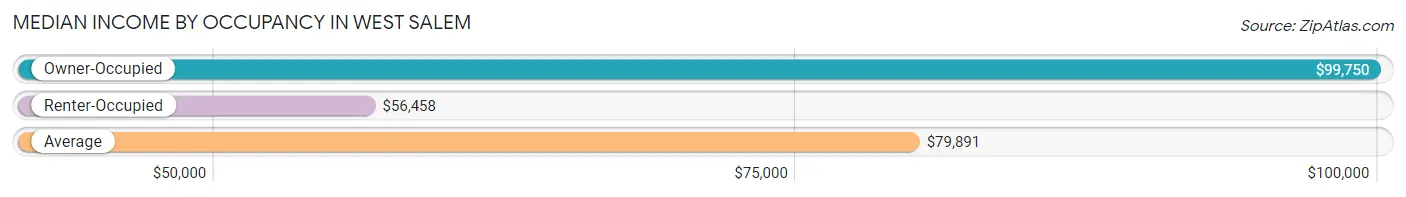
| Occupancy Type | # Households | Median Income |
| Owner-Occupied | 1,422 (70.5%) | $99,750 |
| Renter-Occupied | 596 (29.5%) | $56,458 |
| Average | 2,018 (100.0%) | $79,891 |
Occupancy by Householder Income Bracket in West Salem
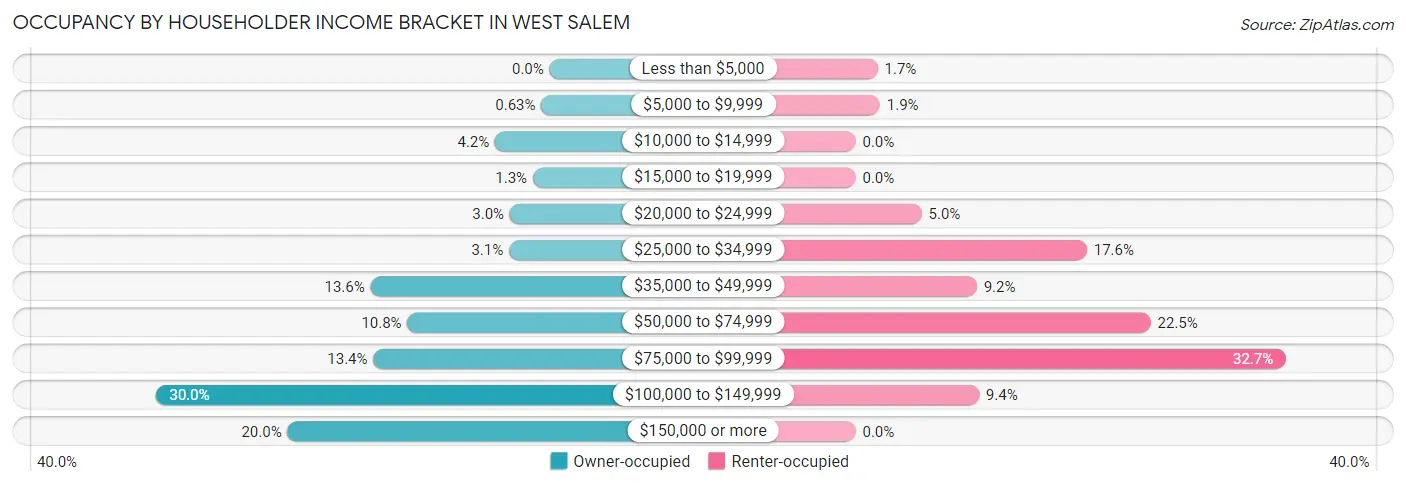
| Income Bracket | Owner-occupied | Renter-occupied |
| Less than $5,000 | 0 (0.0%) | 10 (1.7%) |
| $5,000 to $9,999 | 9 (0.6%) | 11 (1.8%) |
| $10,000 to $14,999 | 59 (4.2%) | 0 (0.0%) |
| $15,000 to $19,999 | 18 (1.3%) | 0 (0.0%) |
| $20,000 to $24,999 | 43 (3.0%) | 30 (5.0%) |
| $25,000 to $34,999 | 44 (3.1%) | 105 (17.6%) |
| $35,000 to $49,999 | 194 (13.6%) | 55 (9.2%) |
| $50,000 to $74,999 | 154 (10.8%) | 134 (22.5%) |
| $75,000 to $99,999 | 191 (13.4%) | 195 (32.7%) |
| $100,000 to $149,999 | 426 (30.0%) | 56 (9.4%) |
| $150,000 or more | 284 (20.0%) | 0 (0.0%) |
| Total | 1,422 (100.0%) | 596 (100.0%) |
Monthly Housing Cost Tiers in West Salem
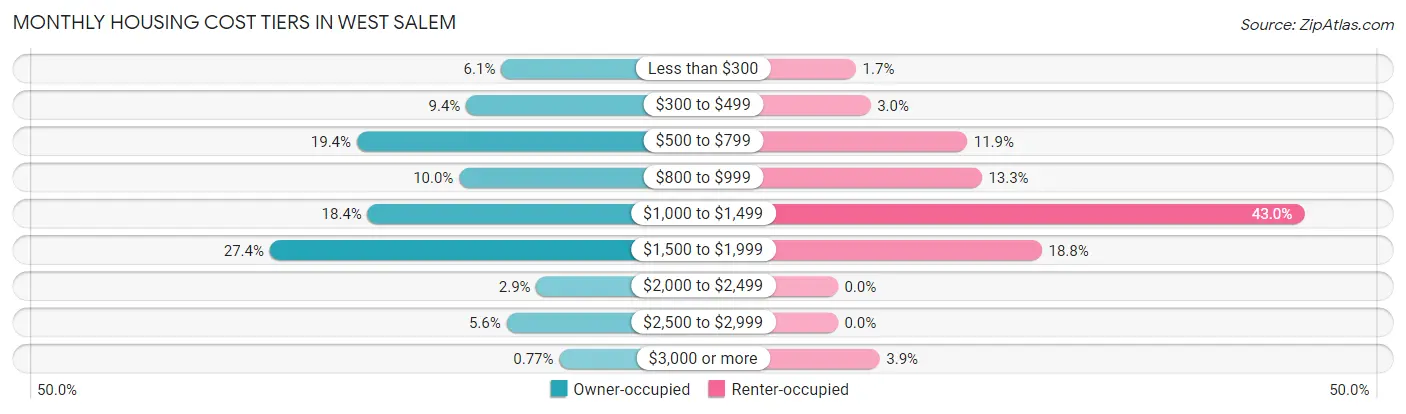
| Monthly Cost | Owner-occupied | Renter-occupied |
| Less than $300 | 87 (6.1%) | 10 (1.7%) |
| $300 to $499 | 133 (9.3%) | 18 (3.0%) |
| $500 to $799 | 276 (19.4%) | 71 (11.9%) |
| $800 to $999 | 142 (10.0%) | 79 (13.3%) |
| $1,000 to $1,499 | 262 (18.4%) | 256 (42.9%) |
| $1,500 to $1,999 | 390 (27.4%) | 112 (18.8%) |
| $2,000 to $2,499 | 41 (2.9%) | 0 (0.0%) |
| $2,500 to $2,999 | 80 (5.6%) | 0 (0.0%) |
| $3,000 or more | 11 (0.8%) | 23 (3.9%) |
| Total | 1,422 (100.0%) | 596 (100.0%) |
Physical Housing Characteristics in West Salem
Housing Structures in West Salem
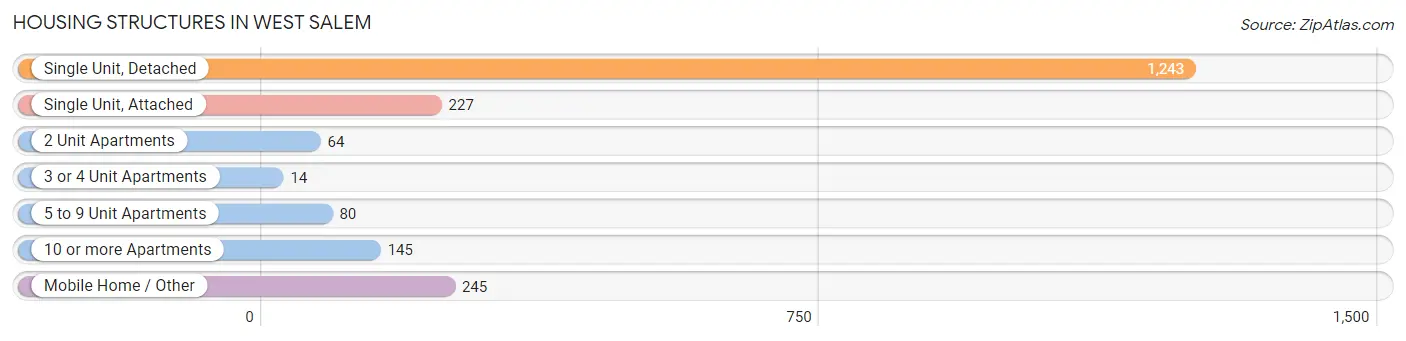
| Structure Type | # Housing Units | % Housing Units |
| Single Unit, Detached | 1,243 | 61.6% |
| Single Unit, Attached | 227 | 11.3% |
| 2 Unit Apartments | 64 | 3.2% |
| 3 or 4 Unit Apartments | 14 | 0.7% |
| 5 to 9 Unit Apartments | 80 | 4.0% |
| 10 or more Apartments | 145 | 7.2% |
| Mobile Home / Other | 245 | 12.1% |
| Total | 2,018 | 100.0% |
Housing Structures by Occupancy in West Salem
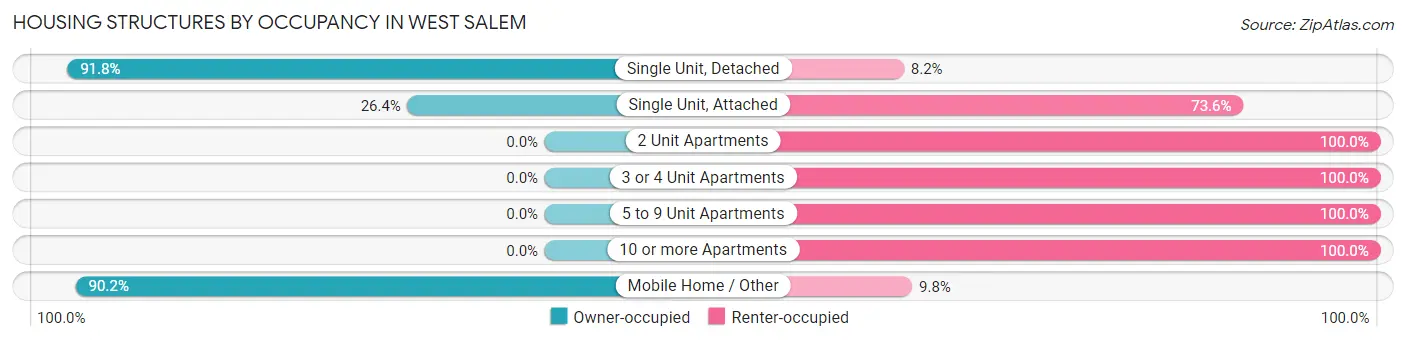
| Structure Type | Owner-occupied | Renter-occupied |
| Single Unit, Detached | 1,141 (91.8%) | 102 (8.2%) |
| Single Unit, Attached | 60 (26.4%) | 167 (73.6%) |
| 2 Unit Apartments | 0 (0.0%) | 64 (100.0%) |
| 3 or 4 Unit Apartments | 0 (0.0%) | 14 (100.0%) |
| 5 to 9 Unit Apartments | 0 (0.0%) | 80 (100.0%) |
| 10 or more Apartments | 0 (0.0%) | 145 (100.0%) |
| Mobile Home / Other | 221 (90.2%) | 24 (9.8%) |
| Total | 1,422 (70.5%) | 596 (29.5%) |
Housing Structures by Number of Rooms in West Salem
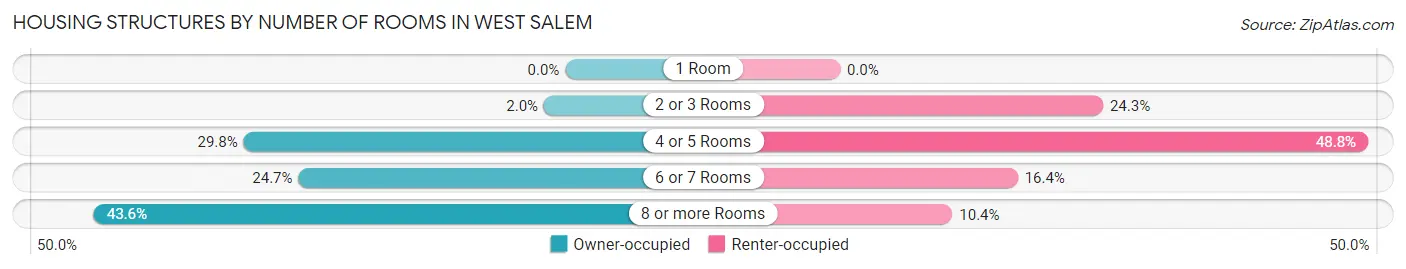
| Number of Rooms | Owner-occupied | Renter-occupied |
| 1 Room | 0 (0.0%) | 0 (0.0%) |
| 2 or 3 Rooms | 28 (2.0%) | 145 (24.3%) |
| 4 or 5 Rooms | 423 (29.7%) | 291 (48.8%) |
| 6 or 7 Rooms | 351 (24.7%) | 98 (16.4%) |
| 8 or more Rooms | 620 (43.6%) | 62 (10.4%) |
| Total | 1,422 (100.0%) | 596 (100.0%) |
Housing Structure by Heating Type in West Salem
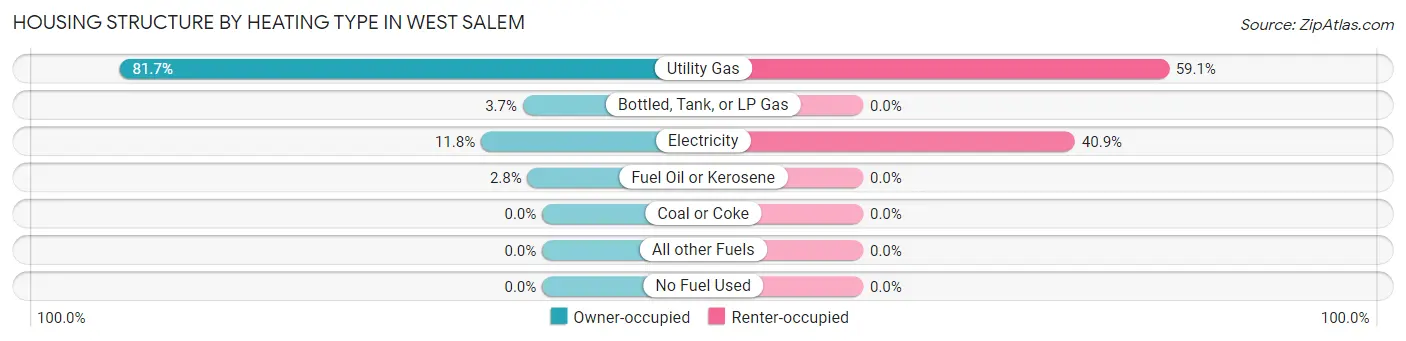
| Heating Type | Owner-occupied | Renter-occupied |
| Utility Gas | 1,161 (81.7%) | 352 (59.1%) |
| Bottled, Tank, or LP Gas | 53 (3.7%) | 0 (0.0%) |
| Electricity | 168 (11.8%) | 244 (40.9%) |
| Fuel Oil or Kerosene | 40 (2.8%) | 0 (0.0%) |
| Coal or Coke | 0 (0.0%) | 0 (0.0%) |
| All other Fuels | 0 (0.0%) | 0 (0.0%) |
| No Fuel Used | 0 (0.0%) | 0 (0.0%) |
| Total | 1,422 (100.0%) | 596 (100.0%) |
Household Vehicle Usage in West Salem
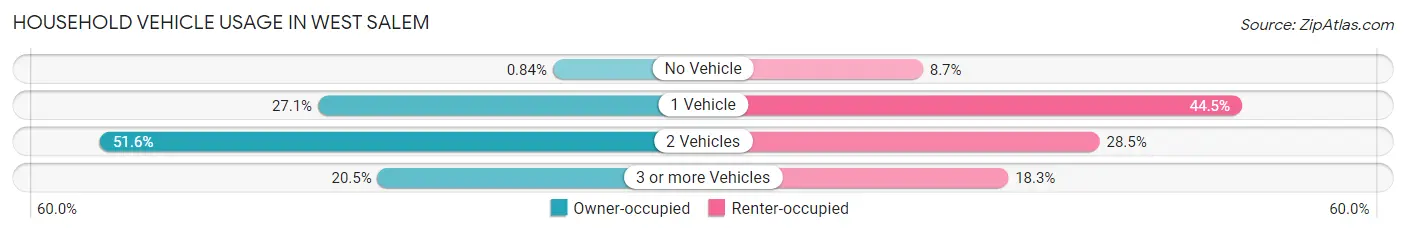
| Vehicles per Household | Owner-occupied | Renter-occupied |
| No Vehicle | 12 (0.8%) | 52 (8.7%) |
| 1 Vehicle | 386 (27.1%) | 265 (44.5%) |
| 2 Vehicles | 733 (51.5%) | 170 (28.5%) |
| 3 or more Vehicles | 291 (20.5%) | 109 (18.3%) |
| Total | 1,422 (100.0%) | 596 (100.0%) |
Real Estate & Mortgages in West Salem
Real Estate and Mortgage Overview in West Salem
| Characteristic | Without Mortgage | With Mortgage |
| Housing Units | 631 | 791 |
| Median Property Value | $219,000 | $252,500 |
| Median Household Income | $53,194 | $242 |
| Monthly Housing Costs | $588 | $11 |
| Real Estate Taxes | $3,317 | $0 |
Property Value by Mortgage Status in West Salem
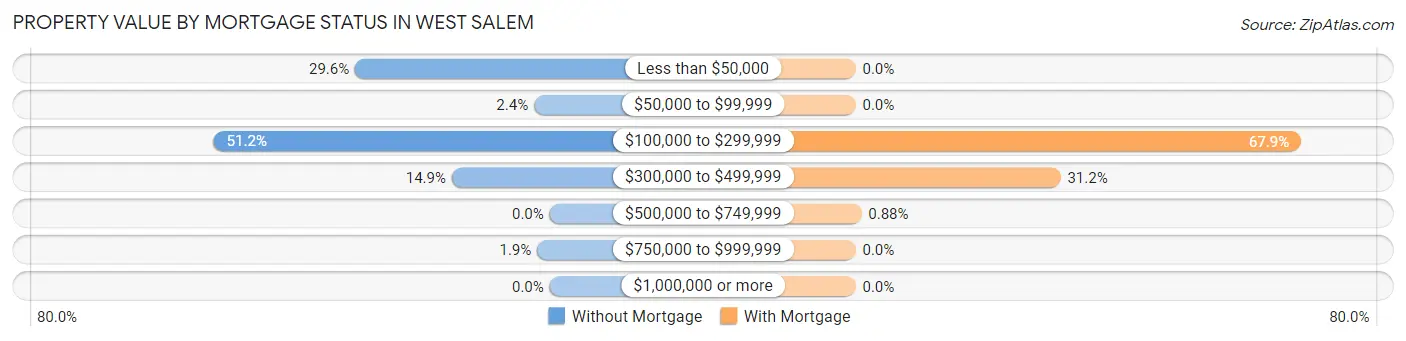
| Property Value | Without Mortgage | With Mortgage |
| Less than $50,000 | 187 (29.6%) | 0 (0.0%) |
| $50,000 to $99,999 | 15 (2.4%) | 0 (0.0%) |
| $100,000 to $299,999 | 323 (51.2%) | 537 (67.9%) |
| $300,000 to $499,999 | 94 (14.9%) | 247 (31.2%) |
| $500,000 to $749,999 | 0 (0.0%) | 7 (0.9%) |
| $750,000 to $999,999 | 12 (1.9%) | 0 (0.0%) |
| $1,000,000 or more | 0 (0.0%) | 0 (0.0%) |
| Total | 631 (100.0%) | 791 (100.0%) |
Household Income by Mortgage Status in West Salem
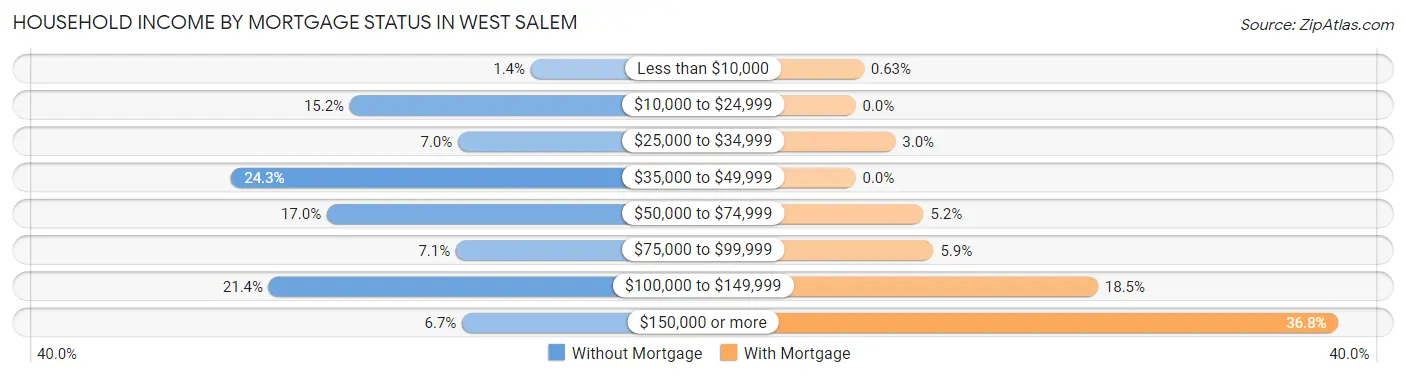
| Household Income | Without Mortgage | With Mortgage |
| Less than $10,000 | 9 (1.4%) | 5 (0.6%) |
| $10,000 to $24,999 | 96 (15.2%) | 0 (0.0%) |
| $25,000 to $34,999 | 44 (7.0%) | 24 (3.0%) |
| $35,000 to $49,999 | 153 (24.2%) | 0 (0.0%) |
| $50,000 to $74,999 | 107 (17.0%) | 41 (5.2%) |
| $75,000 to $99,999 | 45 (7.1%) | 47 (5.9%) |
| $100,000 to $149,999 | 135 (21.4%) | 146 (18.5%) |
| $150,000 or more | 42 (6.7%) | 291 (36.8%) |
| Total | 631 (100.0%) | 791 (100.0%) |
Property Value to Household Income Ratio in West Salem
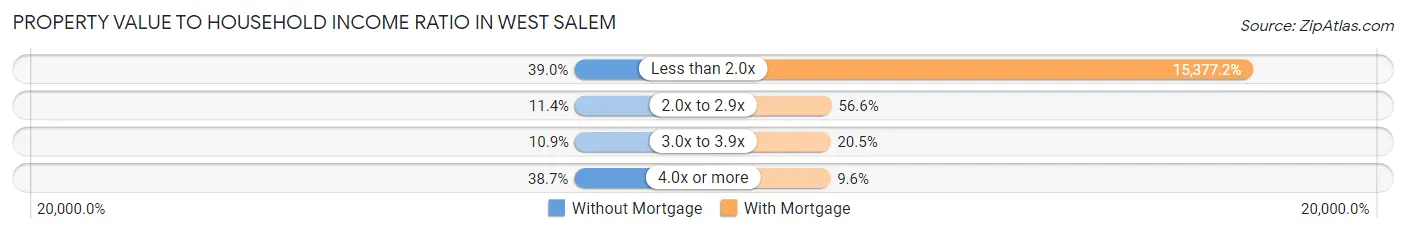
| Value-to-Income Ratio | Without Mortgage | With Mortgage |
| Less than 2.0x | 246 (39.0%) | 121,634 (15,377.2%) |
| 2.0x to 2.9x | 72 (11.4%) | 448 (56.6%) |
| 3.0x to 3.9x | 69 (10.9%) | 162 (20.5%) |
| 4.0x or more | 244 (38.7%) | 76 (9.6%) |
| Total | 631 (100.0%) | 791 (100.0%) |
Real Estate Taxes by Mortgage Status in West Salem
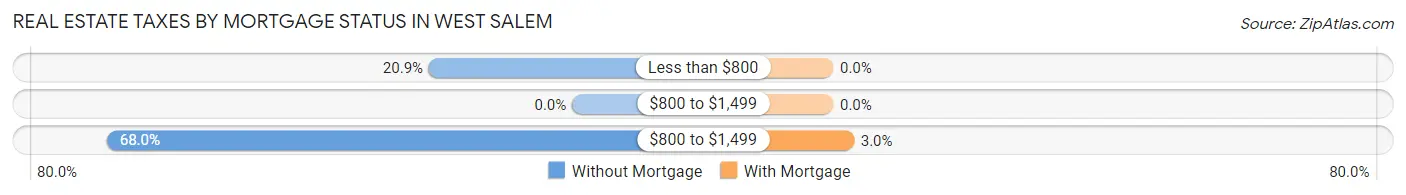
| Property Taxes | Without Mortgage | With Mortgage |
| Less than $800 | 132 (20.9%) | 0 (0.0%) |
| $800 to $1,499 | 0 (0.0%) | 0 (0.0%) |
| $800 to $1,499 | 429 (68.0%) | 24 (3.0%) |
| Total | 631 (100.0%) | 791 (100.0%) |
Health & Disability in West Salem
Health Insurance Coverage by Age in West Salem
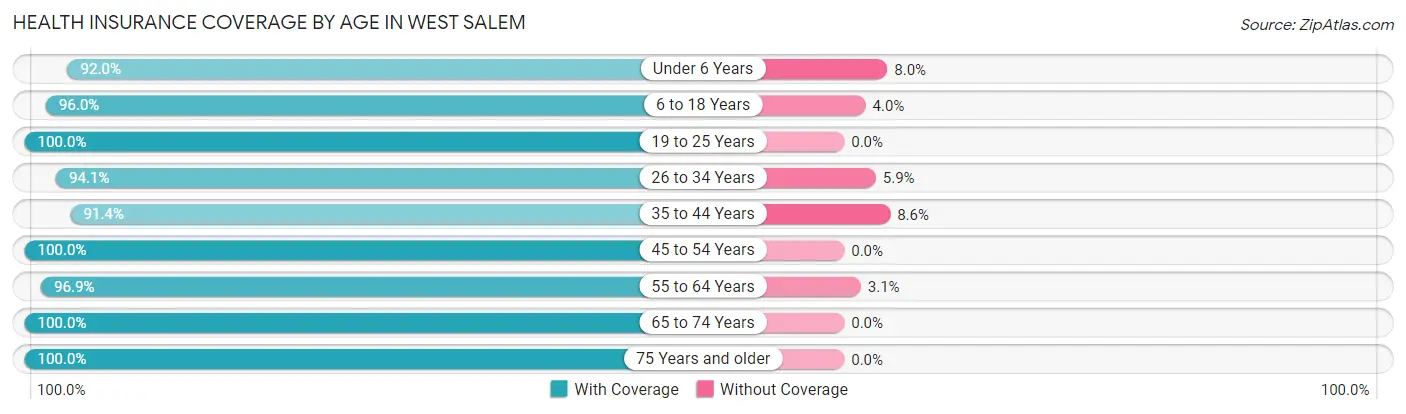
| Age Bracket | With Coverage | Without Coverage |
| Under 6 Years | 252 (92.0%) | 22 (8.0%) |
| 6 to 18 Years | 1,182 (96.0%) | 49 (4.0%) |
| 19 to 25 Years | 266 (100.0%) | 0 (0.0%) |
| 26 to 34 Years | 432 (94.1%) | 27 (5.9%) |
| 35 to 44 Years | 545 (91.4%) | 51 (8.6%) |
| 45 to 54 Years | 588 (100.0%) | 0 (0.0%) |
| 55 to 64 Years | 815 (96.9%) | 26 (3.1%) |
| 65 to 74 Years | 515 (100.0%) | 0 (0.0%) |
| 75 Years and older | 306 (100.0%) | 0 (0.0%) |
| Total | 4,901 (96.6%) | 175 (3.5%) |
Health Insurance Coverage by Citizenship Status in West Salem
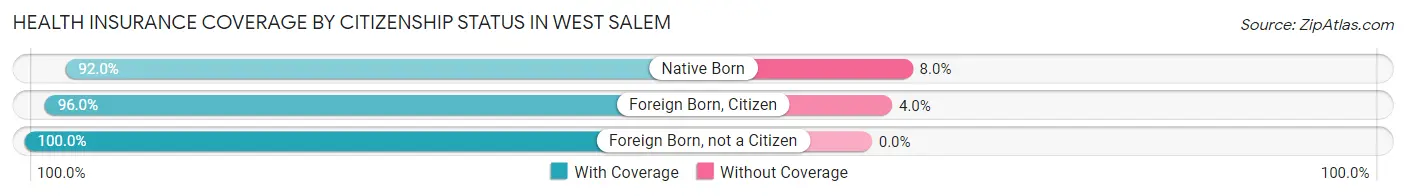
| Citizenship Status | With Coverage | Without Coverage |
| Native Born | 252 (92.0%) | 22 (8.0%) |
| Foreign Born, Citizen | 1,182 (96.0%) | 49 (4.0%) |
| Foreign Born, not a Citizen | 266 (100.0%) | 0 (0.0%) |
Health Insurance Coverage by Household Income in West Salem
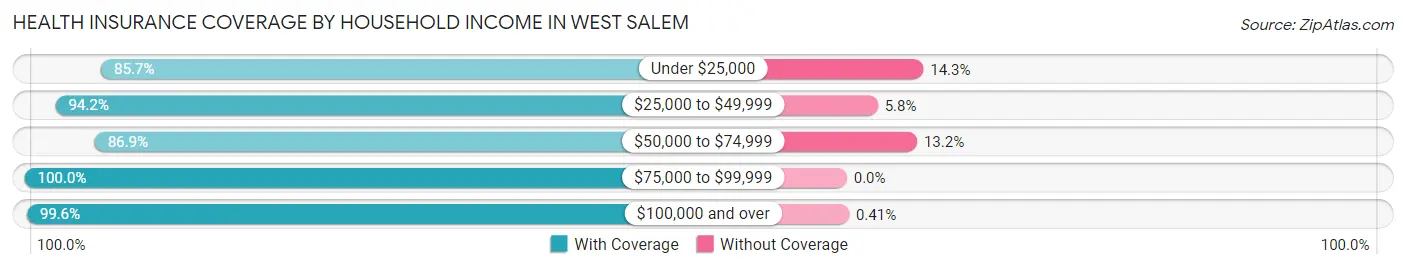
| Household Income | With Coverage | Without Coverage |
| Under $25,000 | 227 (85.7%) | 38 (14.3%) |
| $25,000 to $49,999 | 586 (94.2%) | 36 (5.8%) |
| $50,000 to $74,999 | 601 (86.9%) | 91 (13.2%) |
| $75,000 to $99,999 | 1,028 (100.0%) | 0 (0.0%) |
| $100,000 and over | 2,456 (99.6%) | 10 (0.4%) |
Public vs Private Health Insurance Coverage by Age in West Salem
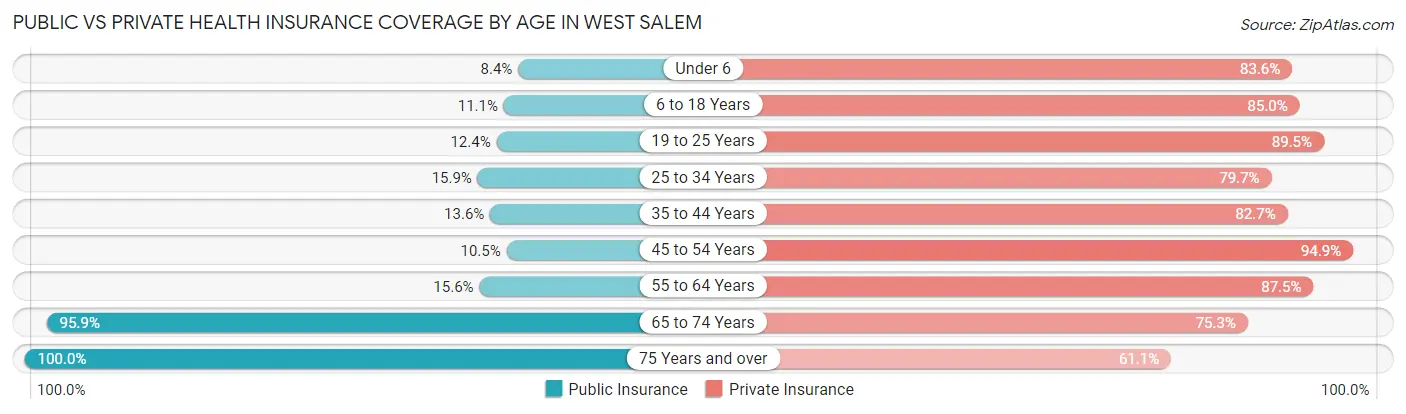
| Age Bracket | Public Insurance | Private Insurance |
| Under 6 | 23 (8.4%) | 229 (83.6%) |
| 6 to 18 Years | 136 (11.1%) | 1,046 (85.0%) |
| 19 to 25 Years | 33 (12.4%) | 238 (89.5%) |
| 25 to 34 Years | 73 (15.9%) | 366 (79.7%) |
| 35 to 44 Years | 81 (13.6%) | 493 (82.7%) |
| 45 to 54 Years | 62 (10.5%) | 558 (94.9%) |
| 55 to 64 Years | 131 (15.6%) | 736 (87.5%) |
| 65 to 74 Years | 494 (95.9%) | 388 (75.3%) |
| 75 Years and over | 306 (100.0%) | 187 (61.1%) |
| Total | 1,339 (26.4%) | 4,241 (83.6%) |
Disability Status by Sex by Age in West Salem
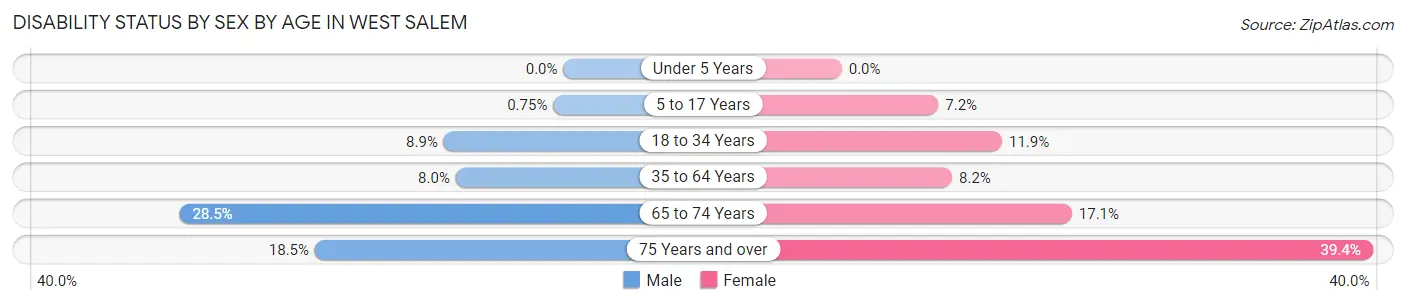
| Age Bracket | Male | Female |
| Under 5 Years | 0 (0.0%) | 0 (0.0%) |
| 5 to 17 Years | 6 (0.7%) | 32 (7.2%) |
| 18 to 34 Years | 30 (8.9%) | 52 (11.9%) |
| 35 to 64 Years | 74 (8.0%) | 90 (8.2%) |
| 65 to 74 Years | 55 (28.5%) | 55 (17.1%) |
| 75 Years and over | 19 (18.4%) | 80 (39.4%) |
Disability Class by Sex by Age in West Salem
Disability Class: Hearing Difficulty
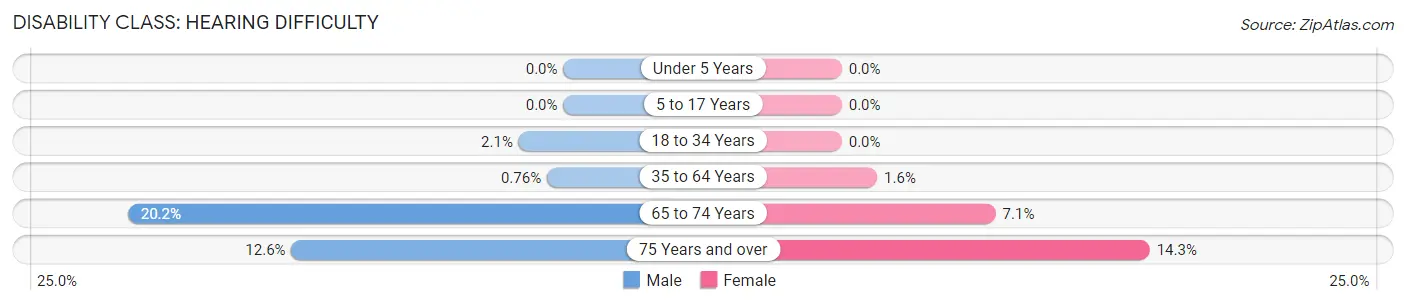
| Age Bracket | Male | Female |
| Under 5 Years | 0 (0.0%) | 0 (0.0%) |
| 5 to 17 Years | 0 (0.0%) | 0 (0.0%) |
| 18 to 34 Years | 7 (2.1%) | 0 (0.0%) |
| 35 to 64 Years | 7 (0.8%) | 18 (1.6%) |
| 65 to 74 Years | 39 (20.2%) | 23 (7.1%) |
| 75 Years and over | 13 (12.6%) | 29 (14.3%) |
Disability Class: Vision Difficulty
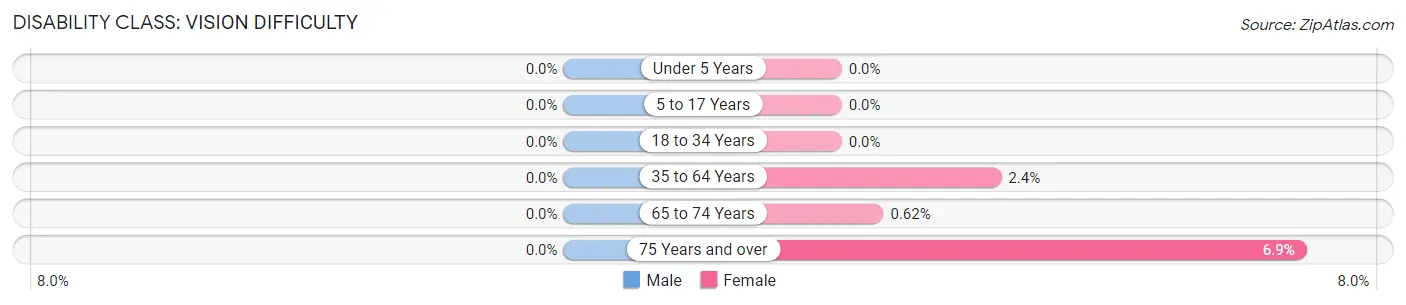
| Age Bracket | Male | Female |
| Under 5 Years | 0 (0.0%) | 0 (0.0%) |
| 5 to 17 Years | 0 (0.0%) | 0 (0.0%) |
| 18 to 34 Years | 0 (0.0%) | 0 (0.0%) |
| 35 to 64 Years | 0 (0.0%) | 26 (2.4%) |
| 65 to 74 Years | 0 (0.0%) | 2 (0.6%) |
| 75 Years and over | 0 (0.0%) | 14 (6.9%) |
Disability Class: Cognitive Difficulty
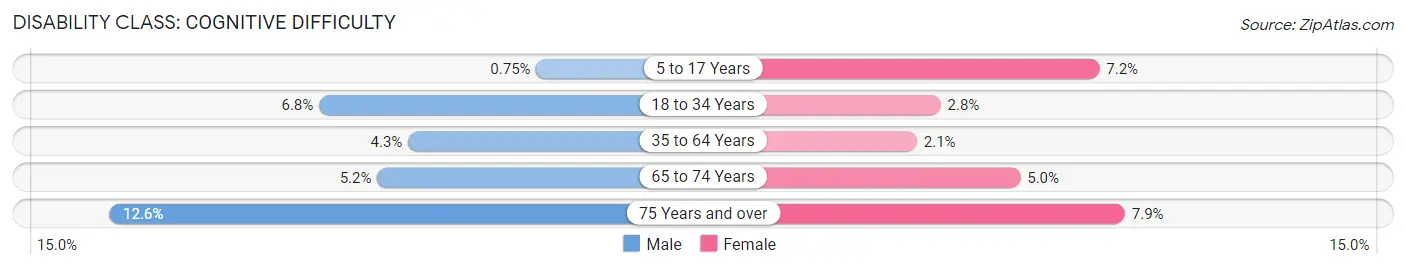
| Age Bracket | Male | Female |
| 5 to 17 Years | 6 (0.7%) | 32 (7.2%) |
| 18 to 34 Years | 23 (6.8%) | 12 (2.8%) |
| 35 to 64 Years | 40 (4.3%) | 23 (2.1%) |
| 65 to 74 Years | 10 (5.2%) | 16 (5.0%) |
| 75 Years and over | 13 (12.6%) | 16 (7.9%) |
Disability Class: Ambulatory Difficulty
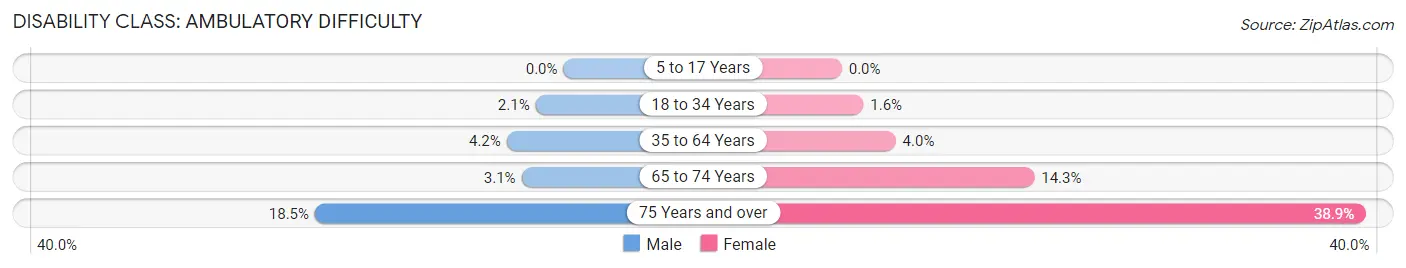
| Age Bracket | Male | Female |
| 5 to 17 Years | 0 (0.0%) | 0 (0.0%) |
| 18 to 34 Years | 7 (2.1%) | 7 (1.6%) |
| 35 to 64 Years | 39 (4.2%) | 44 (4.0%) |
| 65 to 74 Years | 6 (3.1%) | 46 (14.3%) |
| 75 Years and over | 19 (18.4%) | 79 (38.9%) |
Disability Class: Self-Care Difficulty
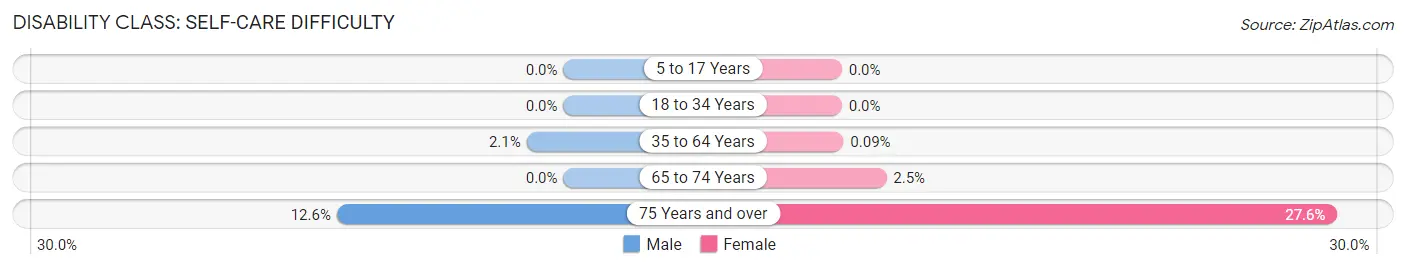
| Age Bracket | Male | Female |
| 5 to 17 Years | 0 (0.0%) | 0 (0.0%) |
| 18 to 34 Years | 0 (0.0%) | 0 (0.0%) |
| 35 to 64 Years | 19 (2.1%) | 1 (0.1%) |
| 65 to 74 Years | 0 (0.0%) | 8 (2.5%) |
| 75 Years and over | 13 (12.6%) | 56 (27.6%) |
Technology Access in West Salem
Computing Device Access in West Salem
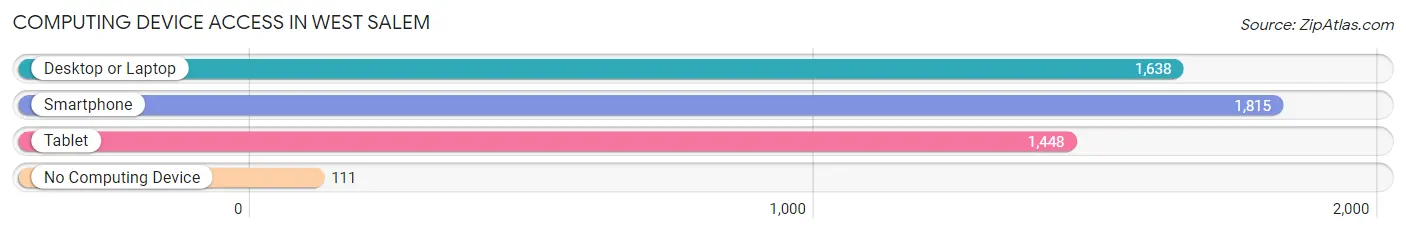
| Device Type | # Households | % Households |
| Desktop or Laptop | 1,638 | 81.2% |
| Smartphone | 1,815 | 89.9% |
| Tablet | 1,448 | 71.8% |
| No Computing Device | 111 | 5.5% |
| Total | 2,018 | 100.0% |
Internet Access in West Salem
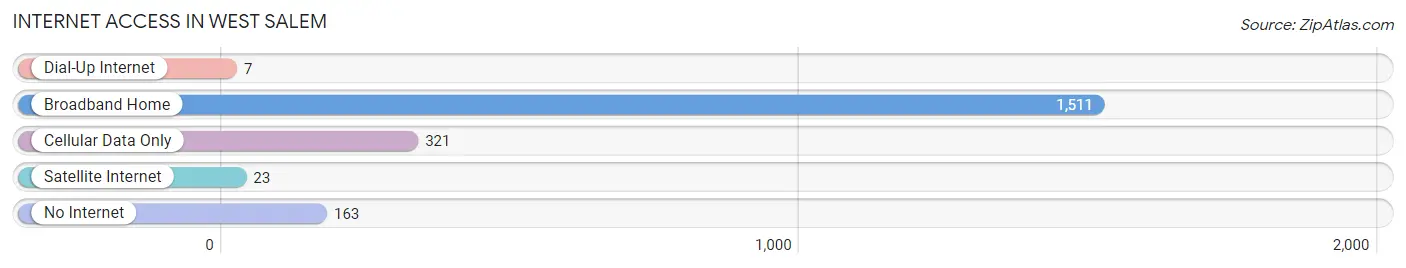
| Internet Type | # Households | % Households |
| Dial-Up Internet | 7 | 0.4% |
| Broadband Home | 1,511 | 74.9% |
| Cellular Data Only | 321 | 15.9% |
| Satellite Internet | 23 | 1.1% |
| No Internet | 163 | 8.1% |
| Total | 2,018 | 100.0% |
West Salem Summary
History
West Salem, Wisconsin is a small village located in La Crosse County, Wisconsin. It is situated on the banks of the La Crosse River, and is part of the La Crosse-Onalaska Metropolitan Statistical Area. The village was first settled in 1854 by a group of settlers from New York, led by William H. West. The village was originally known as West’s Settlement, but was later changed to West Salem.
The village was officially incorporated in 1858, and the first mayor was William H. West. The village was named after Salem, New York, the hometown of the settlers. The village grew slowly, but steadily, and by the late 19th century, it had become a thriving community. The village was home to a variety of businesses, including a sawmill, a grist mill, a blacksmith shop, a general store, and a hotel.
In the early 20th century, West Salem experienced a period of growth and prosperity. The village was home to several factories, including a cheese factory, a canning factory, and a furniture factory. The village also had a number of churches, schools, and other civic organizations.
In the late 20th century, West Salem experienced a period of decline. Many of the factories and businesses closed, and the population began to decline. In recent years, however, the village has experienced a resurgence. The village has become a popular tourist destination, and is home to a number of festivals and events.
Geography
West Salem is located in La Crosse County, Wisconsin. It is situated on the banks of the La Crosse River, and is part of the La Crosse-Onalaska Metropolitan Statistical Area. The village is located approximately 10 miles south of La Crosse, and is bordered by the towns of Onalaska, Shelby, and Bangor.
The village has a total area of 1.2 square miles, all of which is land. The terrain is mostly flat, with some rolling hills. The village is located in a temperate climate, with warm summers and cold winters.
Economy
West Salem’s economy is largely based on tourism and agriculture. The village is home to a number of festivals and events, including the West Salem Cheese Festival, the West Salem Corn Festival, and the West Salem Harvest Festival. These events attract thousands of visitors to the village each year.
The village is also home to a number of small businesses, including restaurants, shops, and other services. The village is also home to a number of farms, which produce a variety of crops, including corn, soybeans, and hay.
Demographics
As of the 2010 census, the village of West Salem had a population of 2,845. The population is largely white (96.2%), with small percentages of African American (1.2%), Asian (0.7%), and Hispanic (1.9%) residents. The median household income is $50,945, and the median home value is $150,000. The village has a high rate of homeownership (83.3%), and a low rate of poverty (7.2%).
Common Questions
What is Per Capita Income in West Salem?
Per Capita income in West Salem is $38,310.
What is the Median Family Income in West Salem?
Median Family Income in West Salem is $100,524.
What is the Median Household income in West Salem?
Median Household Income in West Salem is $79,891.
What is Income or Wage Gap in West Salem?
Income or Wage Gap in West Salem is 25.2%.
Women in West Salem earn 74.8 cents for every dollar earned by a man.
What is Inequality or Gini Index in West Salem?
Inequality or Gini Index in West Salem is 0.39.
What is the Total Population of West Salem?
Total Population of West Salem is 5,253.
What is the Total Male Population of West Salem?
Total Male Population of West Salem is 2,531.
What is the Total Female Population of West Salem?
Total Female Population of West Salem is 2,722.
What is the Ratio of Males per 100 Females in West Salem?
There are 92.98 Males per 100 Females in West Salem.
What is the Ratio of Females per 100 Males in West Salem?
There are 107.55 Females per 100 Males in West Salem.
What is the Median Population Age in West Salem?
Median Population Age in West Salem is 43.2 Years.
What is the Average Family Size in West Salem
Average Family Size in West Salem is 3.1 People.
What is the Average Household Size in West Salem
Average Household Size in West Salem is 2.5 People.
How Large is the Labor Force in West Salem?
There are 2,695 People in the Labor Forcein in West Salem.
What is the Percentage of People in the Labor Force in West Salem?
67.9% of People are in the Labor Force in West Salem.
What is the Unemployment Rate in West Salem?
Unemployment Rate in West Salem is 2.4%.