Jamaican 4 or more Vehicles in Household
COMPARE
Jamaican
Select to Compare
4 or more Vehicles in Household
Jamaican 4 or more Vehicles in Household
4.6%
4+ VEHICLES AVAILABLE
0.0/ 100
METRIC RATING
318th/ 347
METRIC RANK
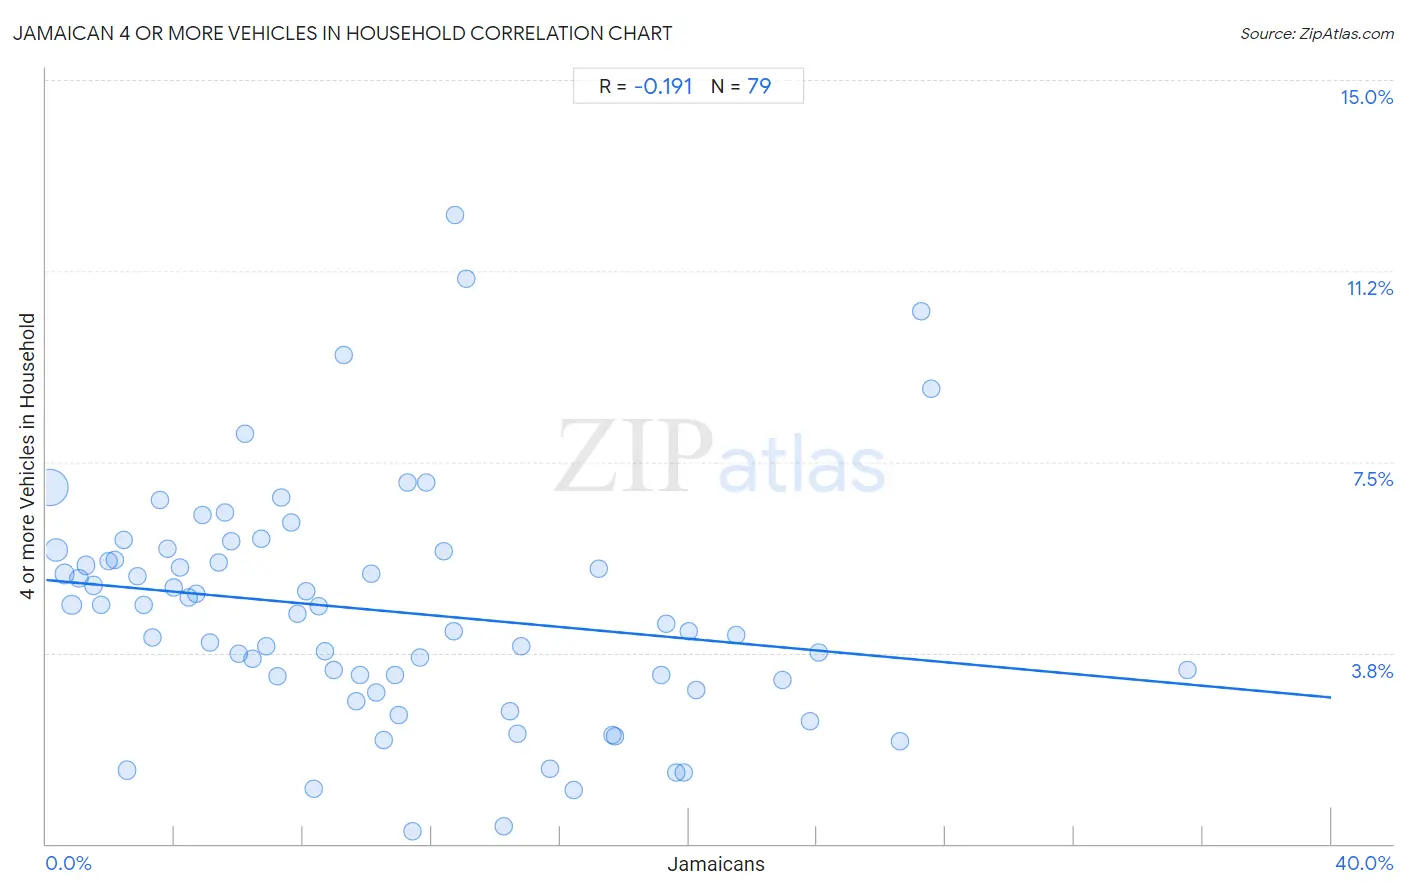
Jamaican 4 or more Vehicles in Household Correlation Chart
The statistical analysis conducted on geographies consisting of 366,007,173 people shows a poor negative correlation between the proportion of Jamaicans and percentage of households with 4 or more vehicles available in the United States with a correlation coefficient (R) of -0.191 and weighted average of 4.6%. On average, for every 1% (one percent) increase in Jamaicans within a typical geography, there is a decrease of 0.058% in percentage of households with 4 or more vehicles available.
It is essential to understand that the correlation between the percentage of Jamaicans and percentage of households with 4 or more vehicles available does not imply a direct cause-and-effect relationship. It remains uncertain whether the presence of Jamaicans influences an upward or downward trend in the level of percentage of households with 4 or more vehicles available within an area, or if Jamaicans simply ended up residing in those areas with higher or lower levels of percentage of households with 4 or more vehicles available due to other factors.
Demographics Similar to Jamaicans by 4 or more Vehicles in Household
In terms of 4 or more vehicles in household, the demographic groups most similar to Jamaicans are U.S. Virgin Islander (4.6%, a difference of 0.24%), Haitian (4.6%, a difference of 0.65%), Puerto Rican (4.7%, a difference of 1.9%), Immigrants from Belarus (4.7%, a difference of 2.4%), and Immigrants from West Indies (4.7%, a difference of 2.5%).
| Demographics | Rating | Rank | 4 or more Vehicles in Household |
| Houma | 0.0 /100 | #311 | Tragic 4.9% |
| Albanians | 0.0 /100 | #312 | Tragic 4.8% |
| Immigrants from Israel | 0.0 /100 | #313 | Tragic 4.8% |
| Immigrants from West Indies | 0.0 /100 | #314 | Tragic 4.7% |
| Immigrants from Belarus | 0.0 /100 | #315 | Tragic 4.7% |
| Puerto Ricans | 0.0 /100 | #316 | Tragic 4.7% |
| U.S. Virgin Islanders | 0.0 /100 | #317 | Tragic 4.6% |
| Jamaicans | 0.0 /100 | #318 | Tragic 4.6% |
| Haitians | 0.0 /100 | #319 | Tragic 4.6% |
| Immigrants from Haiti | 0.0 /100 | #320 | Tragic 4.5% |
| Ecuadorians | 0.0 /100 | #321 | Tragic 4.5% |
| Immigrants from Yemen | 0.0 /100 | #322 | Tragic 4.5% |
| Immigrants from Caribbean | 0.0 /100 | #323 | Tragic 4.4% |
| Soviet Union | 0.0 /100 | #324 | Tragic 4.4% |
| Immigrants from Jamaica | 0.0 /100 | #325 | Tragic 4.4% |
Jamaican 4 or more Vehicles in Household Correlation Summary
| Measurement | Jamaican Data | 4 or more Vehicles in Household Data |
| Minimum | 0.098% | 0.24% |
| Maximum | 35.5% | 12.3% |
| Range | 35.4% | 12.1% |
| Mean | 10.5% | 4.6% |
| Median | 9.0% | 4.5% |
| Interquartile 25% (IQ1) | 4.4% | 3.2% |
| Interquartile 75% (IQ3) | 14.8% | 5.7% |
| Interquartile Range (IQR) | 10.3% | 2.5% |
| Standard Deviation (Sample) | 7.7% | 2.3% |
| Standard Deviation (Population) | 7.6% | 2.3% |
Correlation Details
| Jamaican Percentile | Sample Size | 4 or more Vehicles in Household |
[ 0.0% - 0.5% ] 0.098% | 212,504,478 | 7.0% |
[ 0.0% - 0.5% ] 0.32% | 56,485,112 | 5.8% |
[ 0.5% - 1.0% ] 0.57% | 24,036,053 | 5.3% |
[ 0.5% - 1.0% ] 0.79% | 17,143,044 | 4.7% |
[ 1.0% - 1.5% ] 1.02% | 9,982,093 | 5.2% |
[ 1.0% - 1.5% ] 1.24% | 6,726,890 | 5.5% |
[ 1.0% - 1.5% ] 1.46% | 5,374,618 | 5.1% |
[ 1.5% - 2.0% ] 1.71% | 3,887,373 | 4.7% |
[ 1.5% - 2.0% ] 1.93% | 3,037,516 | 5.5% |
[ 2.0% - 2.5% ] 2.15% | 2,495,981 | 5.6% |
[ 2.0% - 2.5% ] 2.40% | 1,254,458 | 6.0% |
[ 2.5% - 3.0% ] 2.52% | 10,248,002 | 1.4% |
[ 2.5% - 3.0% ] 2.85% | 898,724 | 5.3% |
[ 3.0% - 3.5% ] 3.04% | 1,384,714 | 4.7% |
[ 3.0% - 3.5% ] 3.32% | 1,259,558 | 4.1% |
[ 3.5% - 4.0% ] 3.52% | 615,689 | 6.7% |
[ 3.5% - 4.0% ] 3.77% | 664,015 | 5.8% |
[ 3.5% - 4.0% ] 3.98% | 495,555 | 5.0% |
[ 4.0% - 4.5% ] 4.16% | 340,210 | 5.4% |
[ 4.0% - 4.5% ] 4.44% | 584,124 | 4.8% |
[ 4.5% - 5.0% ] 4.65% | 540,500 | 4.9% |
[ 4.5% - 5.0% ] 4.85% | 416,475 | 6.4% |
[ 5.0% - 5.5% ] 5.10% | 150,543 | 4.0% |
[ 5.0% - 5.5% ] 5.35% | 200,067 | 5.5% |
[ 5.5% - 6.0% ] 5.56% | 311,925 | 6.5% |
[ 5.5% - 6.0% ] 5.75% | 367,221 | 5.9% |
[ 5.5% - 6.0% ] 6.00% | 354,133 | 3.7% |
[ 6.0% - 6.5% ] 6.17% | 57,766 | 8.0% |
[ 6.0% - 6.5% ] 6.43% | 179,279 | 3.6% |
[ 6.5% - 7.0% ] 6.69% | 427,305 | 6.0% |
[ 6.5% - 7.0% ] 6.86% | 156,040 | 3.9% |
[ 7.0% - 7.5% ] 7.20% | 337,084 | 3.3% |
[ 7.0% - 7.5% ] 7.33% | 138,047 | 6.8% |
[ 7.5% - 8.0% ] 7.62% | 7,365 | 6.3% |
[ 7.5% - 8.0% ] 7.80% | 162,063 | 4.5% |
[ 8.0% - 8.5% ] 8.09% | 150,471 | 5.0% |
[ 8.0% - 8.5% ] 8.33% | 138,522 | 1.1% |
[ 8.0% - 8.5% ] 8.49% | 197,052 | 4.7% |
[ 8.5% - 9.0% ] 8.69% | 101,391 | 3.8% |
[ 8.5% - 9.0% ] 8.96% | 154,467 | 3.4% |
[ 9.0% - 9.5% ] 9.25% | 40,619 | 9.6% |
[ 9.5% - 10.0% ] 9.65% | 41,764 | 2.8% |
[ 9.5% - 10.0% ] 9.78% | 138,789 | 3.3% |
[ 10.0% - 10.5% ] 10.13% | 81,502 | 5.3% |
[ 10.0% - 10.5% ] 10.28% | 63,088 | 3.0% |
[ 10.5% - 11.0% ] 10.51% | 123,924 | 2.0% |
[ 10.5% - 11.0% ] 10.84% | 39,495 | 3.3% |
[ 10.5% - 11.0% ] 10.99% | 72,684 | 2.5% |
[ 11.0% - 11.5% ] 11.24% | 94,486 | 7.1% |
[ 11.0% - 11.5% ] 11.38% | 43,517 | 0.24% |
[ 11.5% - 12.0% ] 11.64% | 739 | 3.7% |
[ 11.5% - 12.0% ] 11.84% | 135,158 | 7.1% |
[ 12.0% - 12.5% ] 12.38% | 80,728 | 5.7% |
[ 12.5% - 13.0% ] 12.70% | 14,549 | 4.2% |
[ 12.5% - 13.0% ] 12.74% | 157 | 12.3% |
[ 13.0% - 13.5% ] 13.08% | 3,571 | 11.1% |
[ 14.0% - 14.5% ] 14.23% | 78,506 | 0.34% |
[ 14.0% - 14.5% ] 14.45% | 68,182 | 2.6% |
[ 14.5% - 15.0% ] 14.65% | 13,479 | 2.2% |
[ 14.5% - 15.0% ] 14.77% | 27,845 | 3.9% |
[ 15.5% - 16.0% ] 15.69% | 1,950 | 1.5% |
[ 16.0% - 16.5% ] 16.43% | 121,912 | 1.1% |
[ 17.0% - 17.5% ] 17.21% | 22,486 | 5.4% |
[ 17.5% - 18.0% ] 17.62% | 104,158 | 2.1% |
[ 17.5% - 18.0% ] 17.71% | 72,817 | 2.1% |
[ 19.0% - 19.5% ] 19.16% | 62,232 | 3.3% |
[ 19.0% - 19.5% ] 19.31% | 44,635 | 4.3% |
[ 19.5% - 20.0% ] 19.62% | 40,073 | 1.4% |
[ 19.5% - 20.0% ] 19.85% | 72,581 | 1.4% |
[ 20.0% - 20.5% ] 20.02% | 52,792 | 4.2% |
[ 20.0% - 20.5% ] 20.24% | 40,593 | 3.0% |
[ 21.0% - 21.5% ] 21.47% | 35,914 | 4.1% |
[ 22.5% - 23.0% ] 22.90% | 118,819 | 3.2% |
[ 23.5% - 24.0% ] 23.79% | 52,000 | 2.4% |
[ 24.0% - 24.5% ] 24.06% | 10,526 | 3.7% |
[ 26.5% - 27.0% ] 26.59% | 21,977 | 2.0% |
[ 27.0% - 27.5% ] 27.26% | 543 | 10.4% |
[ 27.5% - 28.0% ] 27.54% | 236 | 8.9% |
[ 35.5% - 36.0% ] 35.52% | 2,224 | 3.4% |