Immigrants from Middle Africa 4 or more Vehicles in Household

COMPARE

Immigrants from Middle Africa
Race
Ancestry
AfghanAfricanAlaska NativeAlaskan AthabascanAlbanianAleutAlsatianAmericanApacheArabArapahoArgentineanArmenianAssyrian/Chaldean/SyriacAustralianAustrianBahamianBangladeshiBarbadianBasqueBelgianBelizeanBermudanBhutaneseBlackfeetBolivianBrazilianBritishBritish West IndianBulgarianBurmeseCajunCambodianCanadianCape VerdeanCarpatho RusynCelticCentral AmericanCentral American IndianCherokeeCheyenneChickasawChileanChineseChippewaChoctawColombianColvilleComancheCosta RicanCreeCreekCroatianCrowCubanCypriotCzechCzechoslovakianDanishDelawareDominicanDutchDutch West IndianEastern EuropeanEcuadorianEgyptianEnglishEstonianEthiopianEuropeanFijianFilipinoFinnishFrenchFrench American IndianFrench CanadianGermanGerman RussianGhanaianGreekGuamanian/ChamorroGuatemalanGuyaneseHaitianHmongHonduranHopiHoumaHungarianIcelanderIndian (Asian)IndonesianInupiatIranianIraqiIrishIroquoisIsraeliItalianJamaicanJapaneseJordanianKenyanKiowaKoreanLaotianLatvianLebaneseLiberianLithuanianLumbeeLuxembourgerMacedonianMalaysianMalteseMarshalleseMenomineeMexicanMexican American IndianMongolianMoroccanNative HawaiianNavajoNepaleseNew ZealanderNicaraguanNigerianNorthern EuropeanNorwegianOkinawanOsageOttawaPaiutePakistaniPalestinianPanamanianParaguayanPennsylvania GermanPeruvianPimaPolishPortuguesePotawatomiPuebloPuerto RicanPuget Sound SalishRomanianRussianSalvadoranSamoanScandinavianScotch-IrishScottishSeminoleSenegaleseSerbianShoshoneSierra LeoneanSiouxSlavicSlovakSloveneSomaliSouth AfricanSouth AmericanSouth American IndianSoviet UnionSpaniardSpanishSpanish AmericanSpanish American IndianSri LankanSubsaharan AfricanSudaneseSwedishSwissSyrianTaiwaneseThaiTlingit-HaidaTohono O'OdhamTonganTrinidadian and TobagonianTsimshianTurkishU.S. Virgin IslanderUgandanUkrainianUruguayanUteVenezuelanVietnameseWelshWest IndianYakamaYaquiYugoslavianYumanYup'ikZimbabwean
Immigration
NonimmigrantsImmigrantsAfghanistanAfricaAlbaniaArgentinaArmeniaAsiaAustraliaAustriaBahamasBangladeshBarbadosBelarusBelgiumBelizeBoliviaBosnia and HerzegovinaBrazilBulgariaBurma/MyanmarCabo VerdeCambodiaCameroonCanadaCaribbeanCentral AmericaChileChinaColombiaCongoCosta RicaCroatiaCubaCzechoslovakiaDenmarkDominicaDominican RepublicEastern AfricaEastern AsiaEastern EuropeEcuadorEgyptEl SalvadorEnglandEritreaEthiopiaEuropeFijiFranceGermanyGhanaGreeceGrenadaGuatemalaGuyanaHaitiHondurasHong KongHungaryIndiaIndonesiaIranIraqIrelandIsraelItalyJamaicaJapanJordanKazakhstanKenyaKoreaKuwaitLaosLatin AmericaLatviaLebanonLiberiaLithuaniaMalaysiaMexicoMicronesiaMiddle AfricaMoldovaMoroccoNepalNetherlandsNicaraguaNigeriaNorth AmericaNorth MacedoniaNorthern AfricaNorthern EuropeNorwayOceaniaPakistanPanamaPeruPhilippinesPolandPortugalRomaniaRussiaSaudi ArabiaScotlandSenegalSerbiaSierra LeoneSingaporeSomaliaSouth AfricaSouth AmericaSouth Central AsiaSouth Eastern AsiaSouthern EuropeSpainSri LankaSt. Vincent and the GrenadinesSudanSwedenSwitzerlandSyriaTaiwanThailandTrinidad and TobagoTurkeyUgandaUkraineUruguayUzbekistanVenezuelaVietnamWest IndiesWestern AfricaWestern AsiaWestern EuropeYemenZaireZimbabweAzores
Select to Compare
Race
Ancestry
AfghanAfricanAlaska NativeAlaskan AthabascanAlbanianAleutAlsatianAmericanApacheArabArapahoArgentineanArmenianAssyrian/Chaldean/SyriacAustralianAustrianBahamianBangladeshiBarbadianBasqueBelgianBelizeanBermudanBhutaneseBlackfeetBolivianBrazilianBritishBritish West IndianBulgarianBurmeseCajunCambodianCanadianCape VerdeanCarpatho RusynCelticCentral AmericanCentral American IndianCherokeeCheyenneChickasawChileanChineseChippewaChoctawColombianColvilleComancheCosta RicanCreeCreekCroatianCrowCubanCypriotCzechCzechoslovakianDanishDelawareDominicanDutchDutch West IndianEastern EuropeanEcuadorianEgyptianEnglishEstonianEthiopianEuropeanFijianFilipinoFinnishFrenchFrench American IndianFrench CanadianGermanGerman RussianGhanaianGreekGuamanian/ChamorroGuatemalanGuyaneseHaitianHmongHonduranHopiHoumaHungarianIcelanderIndian (Asian)IndonesianInupiatIranianIraqiIrishIroquoisIsraeliItalianJamaicanJapaneseJordanianKenyanKiowaKoreanLaotianLatvianLebaneseLiberianLithuanianLumbeeLuxembourgerMacedonianMalaysianMalteseMarshalleseMenomineeMexicanMexican American IndianMongolianMoroccanNative HawaiianNavajoNepaleseNew ZealanderNicaraguanNigerianNorthern EuropeanNorwegianOkinawanOsageOttawaPaiutePakistaniPalestinianPanamanianParaguayanPennsylvania GermanPeruvianPimaPolishPortuguesePotawatomiPuebloPuerto RicanPuget Sound SalishRomanianRussianSalvadoranSamoanScandinavianScotch-IrishScottishSeminoleSenegaleseSerbianShoshoneSierra LeoneanSiouxSlavicSlovakSloveneSomaliSouth AfricanSouth AmericanSouth American IndianSoviet UnionSpaniardSpanishSpanish AmericanSpanish American IndianSri LankanSubsaharan AfricanSudaneseSwedishSwissSyrianTaiwaneseThaiTlingit-HaidaTohono O'OdhamTonganTrinidadian and TobagonianTsimshianTurkishU.S. Virgin IslanderUgandanUkrainianUruguayanUteVenezuelanVietnameseWelshWest IndianYakamaYaquiYugoslavianYumanYup'ikZimbabwean
Immigration
NonimmigrantsImmigrantsAfghanistanAfricaAlbaniaArgentinaArmeniaAsiaAustraliaAustriaBahamasBangladeshBarbadosBelarusBelgiumBelizeBoliviaBosnia and HerzegovinaBrazilBulgariaBurma/MyanmarCabo VerdeCambodiaCameroonCanadaCaribbeanCentral AmericaChileChinaColombiaCongoCosta RicaCroatiaCubaCzechoslovakiaDenmarkDominicaDominican RepublicEastern AfricaEastern AsiaEastern EuropeEcuadorEgyptEl SalvadorEnglandEritreaEthiopiaEuropeFijiFranceGermanyGhanaGreeceGrenadaGuatemalaGuyanaHaitiHondurasHong KongHungaryIndiaIndonesiaIranIraqIrelandIsraelItalyJamaicaJapanJordanKazakhstanKenyaKoreaKuwaitLaosLatin AmericaLatviaLebanonLiberiaLithuaniaMalaysiaMexicoMicronesiaMoldovaMoroccoNepalNetherlandsNicaraguaNigeriaNorth AmericaNorth MacedoniaNorthern AfricaNorthern EuropeNorwayOceaniaPakistanPanamaPeruPhilippinesPolandPortugalRomaniaRussiaSaudi ArabiaScotlandSenegalSerbiaSierra LeoneSingaporeSomaliaSouth AfricaSouth AmericaSouth Central AsiaSouth Eastern AsiaSouthern EuropeSpainSri LankaSt. Vincent and the GrenadinesSudanSwedenSwitzerlandSyriaTaiwanThailandTrinidad and TobagoTurkeyUgandaUkraineUruguayUzbekistanVenezuelaVietnamWest IndiesWestern AfricaWestern AsiaWestern EuropeYemenZaireZimbabweAzores
4 or more Vehicles in Household
Income
Poverty
Unemployment
Labor Participation
Family Structure
Vehicle Availability
Education Level
Disability

Immigrants from Middle Africa 4 or more Vehicles in Household
Tragic

5.8%
4+ VEHICLES AVAILABLE
3.4/ 100
METRIC RATING
242nd/ 347
METRIC RANK

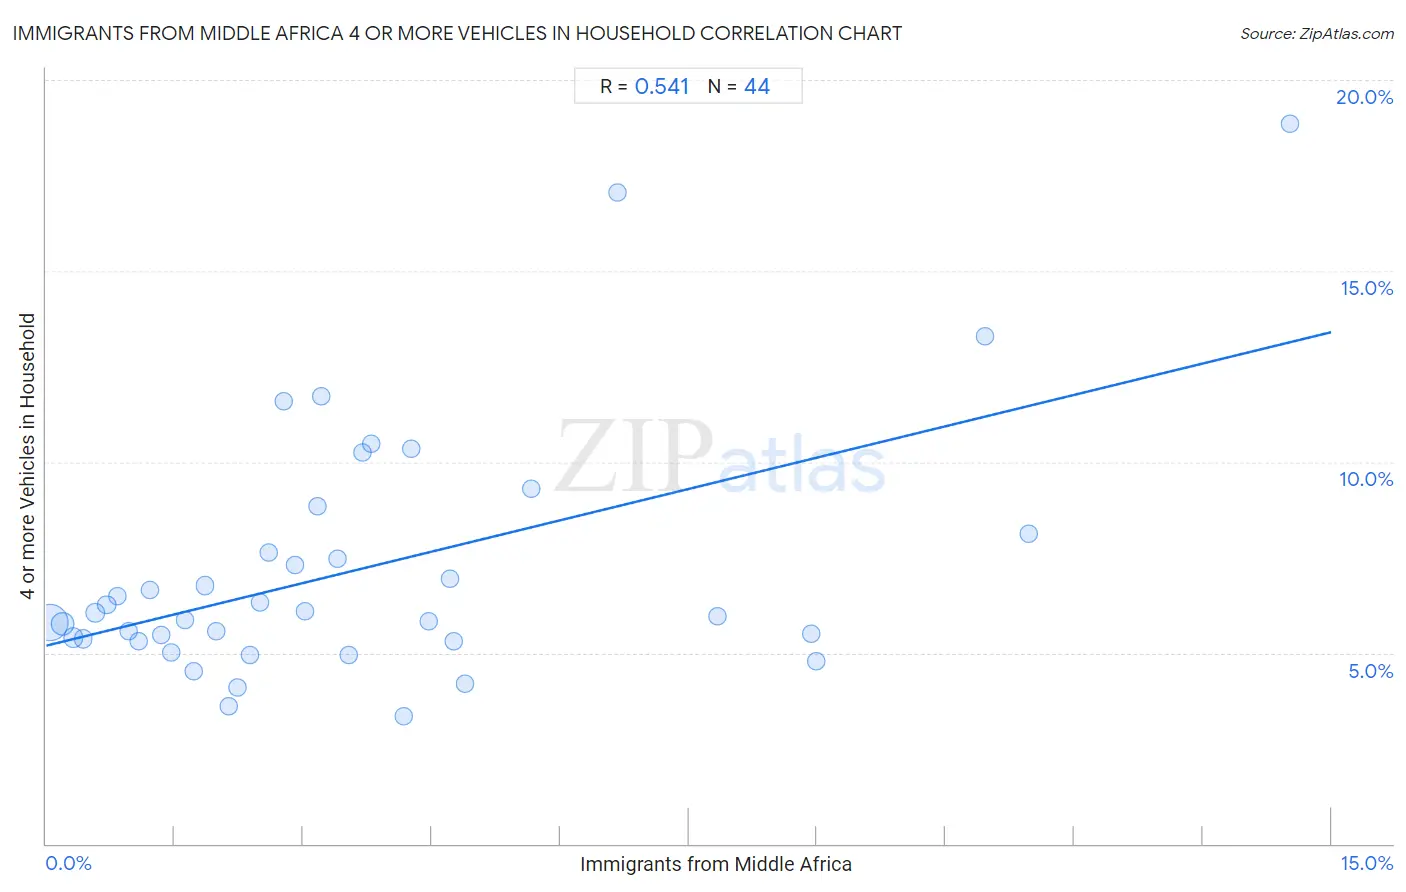
Immigrants from Middle Africa 4 or more Vehicles in Household Correlation Chart

The statistical analysis conducted on geographies consisting of 201,882,462 people shows a substantial positive correlation between the proportion of Immigrants from Middle Africa and percentage of households with 4 or more vehicles available in the United States with a correlation coefficient (R) of 0.541 and weighted average of 5.8%. On average, for every 1% (one percent) increase in Immigrants from Middle Africa within a typical geography, there is an increase of 0.55% in percentage of households with 4 or more vehicles available.
Immigrants from Middle Africa 4 or more Vehicles in Household
It is essential to understand that the correlation between the percentage of Immigrants from Middle Africa and percentage of households with 4 or more vehicles available does not imply a direct cause-and-effect relationship. It remains uncertain whether the presence of Immigrants from Middle Africa influences an upward or downward trend in the level of percentage of households with 4 or more vehicles available within an area, or if Immigrants from Middle Africa simply ended up residing in those areas with higher or lower levels of percentage of households with 4 or more vehicles available due to other factors.

Demographics Similar to Immigrants from Middle Africa by 4 or more Vehicles in Household

In terms of 4 or more vehicles in household, the demographic groups most similar to Immigrants from Middle Africa are Immigrants from Czechoslovakia (5.8%, a difference of 0.19%), Ethiopian (5.8%, a difference of 0.20%), Mongolian (5.8%, a difference of 0.21%), Bulgarian (5.8%, a difference of 0.24%), and Immigrants from Poland (5.8%, a difference of 0.30%).
DemographicsRating | Rank4 or more Vehicles in Household
Immigrants from Hungary
4.6
/100
|
#235
Tragic
5.8%
Immigrants from Eritrea
4.5
/100
|
#236
Tragic
5.8%
Turks
4.1
/100
|
#237
Tragic
5.8%
Immigrants from Belgium
4.0
/100
|
#238
Tragic
5.8%
Immigrants from Australia
3.8
/100
|
#239
Tragic
5.8%
Immigrants from Poland
3.8
/100
|
#240
Tragic
5.8%
Mongolians
3.7
/100
|
#241
Tragic
5.8%
Immigrants from Middle Africa
3.4
/100
|
#242
Tragic
5.8%
Immigrants from Czechoslovakia
3.2
/100
|
#243
Tragic
5.8%
Ethiopians
3.2
/100
|
#244
Tragic
5.8%
Bulgarians
3.1
/100
|
#245
Tragic
5.8%
Immigrants from North Macedonia
2.5
/100
|
#246
Tragic
5.7%
Immigrants from Ethiopia
2.4
/100
|
#247
Tragic
5.7%
Immigrants from Eastern Africa
2.4
/100
|
#248
Tragic
5.7%
Immigrants from Southern Europe
2.3
/100
|
#249
Tragic
5.7%

Immigrants from Middle Africa 4 or more Vehicles in Household Correlation Summary

MeasurementImmigrants from Middle Africa Data4 or more Vehicles in Household Data
Minimum0.047%3.3%
Maximum14.5%18.8%
Range14.5%15.5%
Mean3.6%7.2%
Median2.8%6.0%
Interquartile 25% (IQ1)1.4%5.3%
Interquartile 75% (IQ3)4.6%7.9%
Interquartile Range (IQR)3.2%2.5%
Standard Deviation (Sample)3.2%3.3%
Standard Deviation (Population)3.2%3.2%

Correlation Details

Immigrants from Middle Africa PercentileSample Size4 or more Vehicles in Household
[
0.0%
-
0.5%
]
0.047%
131,540,4485.8%
[
0.0%
-
0.5%
]
0.19%
33,086,7275.8%
[
0.0%
-
0.5%
]
0.32%
15,061,1185.4%
[
0.0%
-
0.5%
]
0.43%
7,441,2245.4%
[
0.5%
-
1.0%
]
0.57%
4,557,9406.0%
[
0.5%
-
1.0%
]
0.70%
2,666,8576.2%
[
0.5%
-
1.0%
]
0.83%
1,566,0366.5%
[
0.5%
-
1.0%
]
0.96%
944,2055.6%
[
1.0%
-
1.5%
]
1.08%
945,2295.3%
[
1.0%
-
1.5%
]
1.21%
884,3056.6%
[
1.0%
-
1.5%
]
1.34%
620,6955.5%
[
1.0%
-
1.5%
]
1.45%
277,7955.0%
[
1.5%
-
2.0%
]
1.62%
227,6055.8%
[
1.5%
-
2.0%
]
1.73%
291,8204.5%
[
1.5%
-
2.0%
]
1.86%
291,9556.8%
[
1.5%
-
2.0%
]
1.98%
178,6505.6%
[
2.0%
-
2.5%
]
2.14%
122,3113.6%
[
2.0%
-
2.5%
]
2.23%
153,2874.1%
[
2.0%
-
2.5%
]
2.37%
199,5534.9%
[
2.0%
-
2.5%
]
2.50%
127,0336.3%
[
2.5%
-
3.0%
]
2.60%
12,3657.6%
[
2.5%
-
3.0%
]
2.77%
10,21011.6%
[
2.5%
-
3.0%
]
2.90%
105,6077.3%
[
3.0%
-
3.5%
]
3.02%
49,8566.1%
[
3.0%
-
3.5%
]
3.17%
19,6558.8%
[
3.0%
-
3.5%
]
3.21%
3,64811.7%
[
3.0%
-
3.5%
]
3.40%
43,5547.5%
[
3.5%
-
4.0%
]
3.54%
125,9054.9%
[
3.5%
-
4.0%
]
3.69%
2,33010.2%
[
3.5%
-
4.0%
]
3.79%
12,12810.5%
[
4.0%
-
4.5%
]
4.17%
69,6343.3%
[
4.0%
-
4.5%
]
4.27%
76,35710.3%
[
4.0%
-
4.5%
]
4.46%
28,4275.8%
[
4.5%
-
5.0%
]
4.71%
17,6346.9%
[
4.5%
-
5.0%
]
4.75%
27,9095.3%
[
4.5%
-
5.0%
]
4.89%
26,6844.2%
[
5.5%
-
6.0%
]
5.66%
21,9859.3%
[
6.5%
-
7.0%
]
6.67%
2,69917.1%
[
7.5%
-
8.0%
]
7.84%
14,4436.0%
[
8.5%
-
9.0%
]
8.92%
3,1045.5%
[
8.5%
-
9.0%
]
8.99%
15,4894.8%
[
10.5%
-
11.0%
]
10.96%
4,80913.3%
[
11.0%
-
11.5%
]
11.47%
1,9978.1%
[
14.5%
-
15.0%
]
14.52%
1,24018.8%