New Zealander 4 or more Vehicles in Household

COMPARE

New Zealander
Race
Ancestry
AfghanAfricanAlaska NativeAlaskan AthabascanAlbanianAleutAlsatianAmericanApacheArabArapahoArgentineanArmenianAssyrian/Chaldean/SyriacAustralianAustrianBahamianBangladeshiBarbadianBasqueBelgianBelizeanBermudanBhutaneseBlackfeetBolivianBrazilianBritishBritish West IndianBulgarianBurmeseCajunCambodianCanadianCape VerdeanCarpatho RusynCelticCentral AmericanCentral American IndianCherokeeCheyenneChickasawChileanChineseChippewaChoctawColombianColvilleComancheCosta RicanCreeCreekCroatianCrowCubanCypriotCzechCzechoslovakianDanishDelawareDominicanDutchDutch West IndianEastern EuropeanEcuadorianEgyptianEnglishEstonianEthiopianEuropeanFijianFilipinoFinnishFrenchFrench American IndianFrench CanadianGermanGerman RussianGhanaianGreekGuamanian/ChamorroGuatemalanGuyaneseHaitianHmongHonduranHopiHoumaHungarianIcelanderIndian (Asian)IndonesianInupiatIranianIraqiIrishIroquoisIsraeliItalianJamaicanJapaneseJordanianKenyanKiowaKoreanLaotianLatvianLebaneseLiberianLithuanianLumbeeLuxembourgerMacedonianMalaysianMalteseMarshalleseMenomineeMexicanMexican American IndianMongolianMoroccanNative HawaiianNavajoNepaleseNew ZealanderNicaraguanNigerianNorthern EuropeanNorwegianOkinawanOsageOttawaPaiutePakistaniPalestinianPanamanianParaguayanPennsylvania GermanPeruvianPimaPolishPortuguesePotawatomiPuebloPuerto RicanPuget Sound SalishRomanianRussianSalvadoranSamoanScandinavianScotch-IrishScottishSeminoleSenegaleseSerbianShoshoneSierra LeoneanSiouxSlavicSlovakSloveneSomaliSouth AfricanSouth AmericanSouth American IndianSoviet UnionSpaniardSpanishSpanish AmericanSpanish American IndianSri LankanSubsaharan AfricanSudaneseSwedishSwissSyrianTaiwaneseThaiTlingit-HaidaTohono O'OdhamTonganTrinidadian and TobagonianTsimshianTurkishU.S. Virgin IslanderUgandanUkrainianUruguayanUteVenezuelanVietnameseWelshWest IndianYakamaYaquiYugoslavianYumanYup'ikZimbabwean
Immigration
NonimmigrantsImmigrantsAfghanistanAfricaAlbaniaArgentinaArmeniaAsiaAustraliaAustriaBahamasBangladeshBarbadosBelarusBelgiumBelizeBoliviaBosnia and HerzegovinaBrazilBulgariaBurma/MyanmarCabo VerdeCambodiaCameroonCanadaCaribbeanCentral AmericaChileChinaColombiaCongoCosta RicaCroatiaCubaCzechoslovakiaDenmarkDominicaDominican RepublicEastern AfricaEastern AsiaEastern EuropeEcuadorEgyptEl SalvadorEnglandEritreaEthiopiaEuropeFijiFranceGermanyGhanaGreeceGrenadaGuatemalaGuyanaHaitiHondurasHong KongHungaryIndiaIndonesiaIranIraqIrelandIsraelItalyJamaicaJapanJordanKazakhstanKenyaKoreaKuwaitLaosLatin AmericaLatviaLebanonLiberiaLithuaniaMalaysiaMexicoMicronesiaMiddle AfricaMoldovaMoroccoNepalNetherlandsNicaraguaNigeriaNorth AmericaNorth MacedoniaNorthern AfricaNorthern EuropeNorwayOceaniaPakistanPanamaPeruPhilippinesPolandPortugalRomaniaRussiaSaudi ArabiaScotlandSenegalSerbiaSierra LeoneSingaporeSomaliaSouth AfricaSouth AmericaSouth Central AsiaSouth Eastern AsiaSouthern EuropeSpainSri LankaSt. Vincent and the GrenadinesSudanSwedenSwitzerlandSyriaTaiwanThailandTrinidad and TobagoTurkeyUgandaUkraineUruguayUzbekistanVenezuelaVietnamWest IndiesWestern AfricaWestern AsiaWestern EuropeYemenZaireZimbabweAzores
Select to Compare
Race
Ancestry
AfghanAfricanAlaska NativeAlaskan AthabascanAlbanianAleutAlsatianAmericanApacheArabArapahoArgentineanArmenianAssyrian/Chaldean/SyriacAustralianAustrianBahamianBangladeshiBarbadianBasqueBelgianBelizeanBermudanBhutaneseBlackfeetBolivianBrazilianBritishBritish West IndianBulgarianBurmeseCajunCambodianCanadianCape VerdeanCarpatho RusynCelticCentral AmericanCentral American IndianCherokeeCheyenneChickasawChileanChineseChippewaChoctawColombianColvilleComancheCosta RicanCreeCreekCroatianCrowCubanCypriotCzechCzechoslovakianDanishDelawareDominicanDutchDutch West IndianEastern EuropeanEcuadorianEgyptianEnglishEstonianEthiopianEuropeanFijianFilipinoFinnishFrenchFrench American IndianFrench CanadianGermanGerman RussianGhanaianGreekGuamanian/ChamorroGuatemalanGuyaneseHaitianHmongHonduranHopiHoumaHungarianIcelanderIndian (Asian)IndonesianInupiatIranianIraqiIrishIroquoisIsraeliItalianJamaicanJapaneseJordanianKenyanKiowaKoreanLaotianLatvianLebaneseLiberianLithuanianLumbeeLuxembourgerMacedonianMalaysianMalteseMarshalleseMenomineeMexicanMexican American IndianMongolianMoroccanNative HawaiianNavajoNepaleseNicaraguanNigerianNorthern EuropeanNorwegianOkinawanOsageOttawaPaiutePakistaniPalestinianPanamanianParaguayanPennsylvania GermanPeruvianPimaPolishPortuguesePotawatomiPuebloPuerto RicanPuget Sound SalishRomanianRussianSalvadoranSamoanScandinavianScotch-IrishScottishSeminoleSenegaleseSerbianShoshoneSierra LeoneanSiouxSlavicSlovakSloveneSomaliSouth AfricanSouth AmericanSouth American IndianSoviet UnionSpaniardSpanishSpanish AmericanSpanish American IndianSri LankanSubsaharan AfricanSudaneseSwedishSwissSyrianTaiwaneseThaiTlingit-HaidaTohono O'OdhamTonganTrinidadian and TobagonianTsimshianTurkishU.S. Virgin IslanderUgandanUkrainianUruguayanUteVenezuelanVietnameseWelshWest IndianYakamaYaquiYugoslavianYumanYup'ikZimbabwean
Immigration
NonimmigrantsImmigrantsAfghanistanAfricaAlbaniaArgentinaArmeniaAsiaAustraliaAustriaBahamasBangladeshBarbadosBelarusBelgiumBelizeBoliviaBosnia and HerzegovinaBrazilBulgariaBurma/MyanmarCabo VerdeCambodiaCameroonCanadaCaribbeanCentral AmericaChileChinaColombiaCongoCosta RicaCroatiaCubaCzechoslovakiaDenmarkDominicaDominican RepublicEastern AfricaEastern AsiaEastern EuropeEcuadorEgyptEl SalvadorEnglandEritreaEthiopiaEuropeFijiFranceGermanyGhanaGreeceGrenadaGuatemalaGuyanaHaitiHondurasHong KongHungaryIndiaIndonesiaIranIraqIrelandIsraelItalyJamaicaJapanJordanKazakhstanKenyaKoreaKuwaitLaosLatin AmericaLatviaLebanonLiberiaLithuaniaMalaysiaMexicoMicronesiaMiddle AfricaMoldovaMoroccoNepalNetherlandsNicaraguaNigeriaNorth AmericaNorth MacedoniaNorthern AfricaNorthern EuropeNorwayOceaniaPakistanPanamaPeruPhilippinesPolandPortugalRomaniaRussiaSaudi ArabiaScotlandSenegalSerbiaSierra LeoneSingaporeSomaliaSouth AfricaSouth AmericaSouth Central AsiaSouth Eastern AsiaSouthern EuropeSpainSri LankaSt. Vincent and the GrenadinesSudanSwedenSwitzerlandSyriaTaiwanThailandTrinidad and TobagoTurkeyUgandaUkraineUruguayUzbekistanVenezuelaVietnamWest IndiesWestern AfricaWestern AsiaWestern EuropeYemenZaireZimbabweAzores
4 or more Vehicles in Household
Income
Poverty
Unemployment
Labor Participation
Family Structure
Vehicle Availability
Education Level
Disability

New Zealander 4 or more Vehicles in Household
Good

6.5%
4+ VEHICLES AVAILABLE
73.3/ 100
METRIC RATING
150th/ 347
METRIC RANK

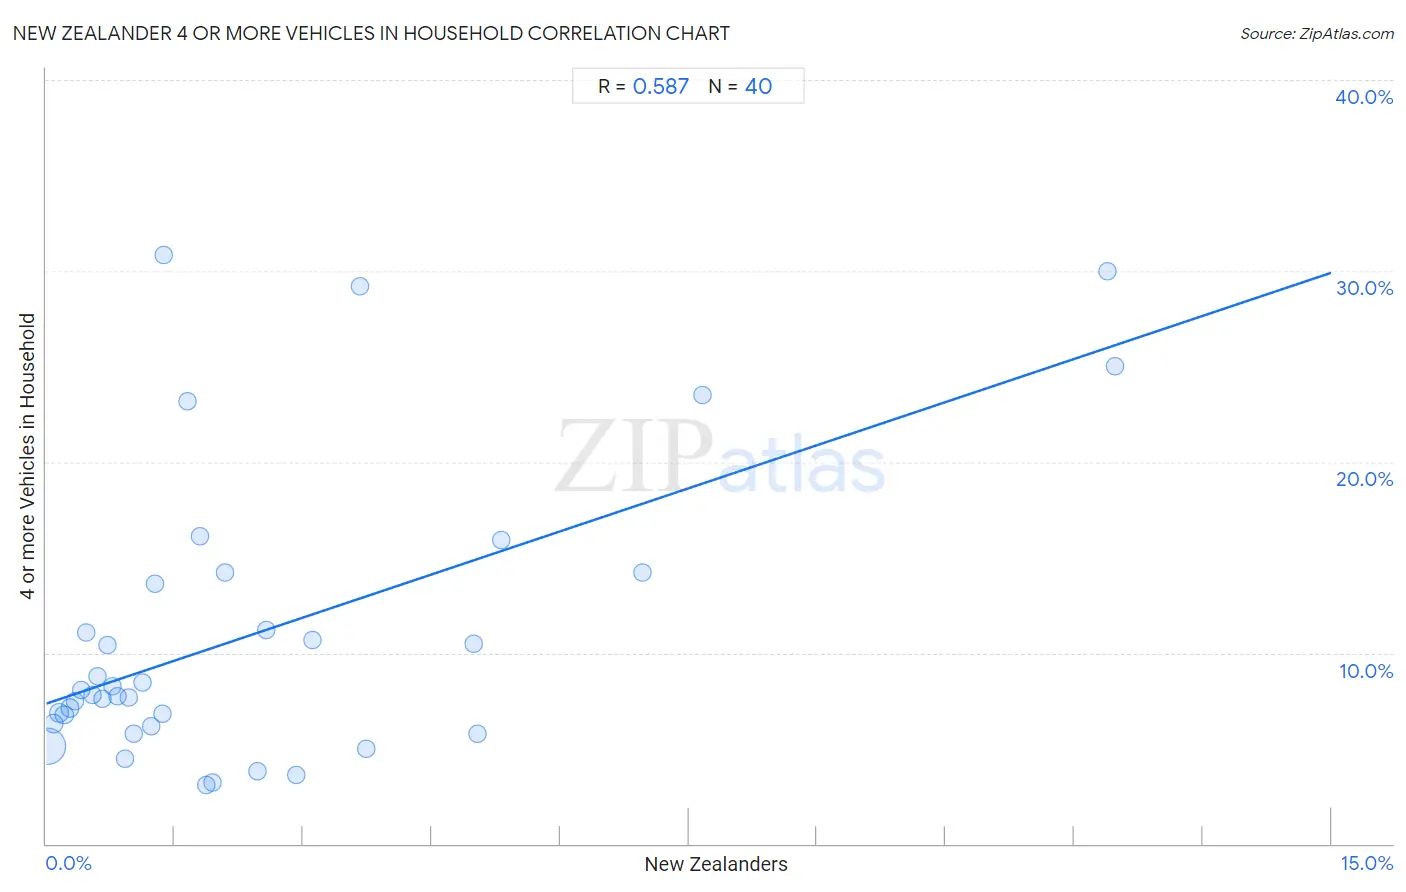
New Zealander 4 or more Vehicles in Household Correlation Chart

The statistical analysis conducted on geographies consisting of 106,639,386 people shows a substantial positive correlation between the proportion of New Zealanders and percentage of households with 4 or more vehicles available in the United States with a correlation coefficient (R) of 0.587 and weighted average of 6.5%. On average, for every 1% (one percent) increase in New Zealanders within a typical geography, there is an increase of 1.5% in percentage of households with 4 or more vehicles available.
New Zealander 4 or more Vehicles in Household
It is essential to understand that the correlation between the percentage of New Zealanders and percentage of households with 4 or more vehicles available does not imply a direct cause-and-effect relationship. It remains uncertain whether the presence of New Zealanders influences an upward or downward trend in the level of percentage of households with 4 or more vehicles available within an area, or if New Zealanders simply ended up residing in those areas with higher or lower levels of percentage of households with 4 or more vehicles available due to other factors.

Demographics Similar to New Zealanders by 4 or more Vehicles in Household

In terms of 4 or more vehicles in household, the demographic groups most similar to New Zealanders are Immigrants from Jordan (6.5%, a difference of 0.040%), Greek (6.5%, a difference of 0.040%), Immigrants from Iran (6.5%, a difference of 0.080%), Immigrants from Costa Rica (6.5%, a difference of 0.13%), and Immigrants from Hong Kong (6.5%, a difference of 0.14%).
DemographicsRating | Rank4 or more Vehicles in Household
Immigrants from Canada
78.6
/100
|
#143
Good
6.5%
Immigrants from North America
78.5
/100
|
#144
Good
6.5%
Croatians
77.8
/100
|
#145
Good
6.5%
Immigrants from Costa Rica
74.4
/100
|
#146
Good
6.5%
Immigrants from Iran
73.9
/100
|
#147
Good
6.5%
Immigrants from Jordan
73.7
/100
|
#148
Good
6.5%
Greeks
73.6
/100
|
#149
Good
6.5%
New Zealanders
73.3
/100
|
#150
Good
6.5%
Immigrants from Hong Kong
72.2
/100
|
#151
Good
6.5%
Yuman
72.1
/100
|
#152
Good
6.5%
Immigrants from Armenia
71.2
/100
|
#153
Good
6.5%
Central American Indians
71.1
/100
|
#154
Good
6.5%
Iroquois
70.4
/100
|
#155
Good
6.5%
Iranians
69.9
/100
|
#156
Good
6.5%
Peruvians
69.4
/100
|
#157
Good
6.5%

New Zealander 4 or more Vehicles in Household Correlation Summary

MeasurementNew Zealander Data4 or more Vehicles in Household Data
Minimum0.016%3.1%
Maximum12.5%30.9%
Range12.5%27.8%
Mean2.4%11.0%
Median1.3%7.9%
Interquartile 25% (IQ1)0.63%6.2%
Interquartile 75% (IQ3)3.0%13.9%
Interquartile Range (IQR)2.4%7.7%
Standard Deviation (Sample)3.0%7.6%
Standard Deviation (Population)2.9%7.5%

Correlation Details

New Zealander PercentileSample Size4 or more Vehicles in Household
[
0.0%
-
0.5%
]
0.016%
93,297,5265.1%
[
0.0%
-
0.5%
]
0.086%
7,579,7596.3%
[
0.0%
-
0.5%
]
0.15%
2,726,8106.9%
[
0.0%
-
0.5%
]
0.21%
988,4476.7%
[
0.0%
-
0.5%
]
0.27%
656,5337.1%
[
0.0%
-
0.5%
]
0.34%
442,0147.5%
[
0.0%
-
0.5%
]
0.40%
213,5798.1%
[
0.0%
-
0.5%
]
0.47%
198,10311.1%
[
0.5%
-
1.0%
]
0.54%
140,0657.8%
[
0.5%
-
1.0%
]
0.60%
54,4368.8%
[
0.5%
-
1.0%
]
0.66%
61,5647.6%
[
0.5%
-
1.0%
]
0.71%
57,51610.4%
[
0.5%
-
1.0%
]
0.78%
28,5438.2%
[
0.5%
-
1.0%
]
0.84%
57,5507.7%
[
0.5%
-
1.0%
]
0.92%
35,5874.4%
[
0.5%
-
1.0%
]
0.96%
26,0237.7%
[
1.0%
-
1.5%
]
1.03%
5,4445.8%
[
1.0%
-
1.5%
]
1.12%
5,0128.5%
[
1.0%
-
1.5%
]
1.23%
7,7876.1%
[
1.0%
-
1.5%
]
1.27%
7,25513.6%
[
1.0%
-
1.5%
]
1.35%
13,3226.8%
[
1.0%
-
1.5%
]
1.38%
6,10430.9%
[
1.5%
-
2.0%
]
1.65%
36323.2%
[
1.5%
-
2.0%
]
1.79%
2,84216.1%
[
1.5%
-
2.0%
]
1.86%
1,0193.1%
[
1.5%
-
2.0%
]
1.95%
9763.2%
[
2.0%
-
2.5%
]
2.09%
3,30514.2%
[
2.0%
-
2.5%
]
2.47%
3,3673.8%
[
2.5%
-
3.0%
]
2.57%
4,40211.2%
[
2.5%
-
3.0%
]
2.92%
6,3453.6%
[
3.0%
-
3.5%
]
3.11%
1,41310.7%
[
3.5%
-
4.0%
]
3.67%
49129.2%
[
3.5%
-
4.0%
]
3.73%
1,3405.0%
[
4.5%
-
5.0%
]
4.98%
30110.5%
[
5.0%
-
5.5%
]
5.03%
8945.8%
[
5.0%
-
5.5%
]
5.30%
88615.9%
[
6.5%
-
7.0%
]
6.95%
60414.2%
[
7.5%
-
8.0%
]
7.66%
1,24023.5%
[
12.0%
-
12.5%
]
12.39%
21830.0%
[
12.0%
-
12.5%
]
12.47%
40125.0%