Guamanian/Chamorro vs Immigrants from Norway 4 or more Vehicles in Household
COMPARE
Guamanian/Chamorro
Immigrants from Norway
4 or more Vehicles in Household
4 or more Vehicles in Household Comparison
Guamanians/Chamorros
Immigrants from Norway
8.1%
4 OR MORE VEHICLES IN HOUSEHOLD
100.0/ 100
METRIC RATING
35th/ 347
METRIC RANK
6.1%
4 OR MORE VEHICLES IN HOUSEHOLD
21.8/ 100
METRIC RATING
199th/ 347
METRIC RANK
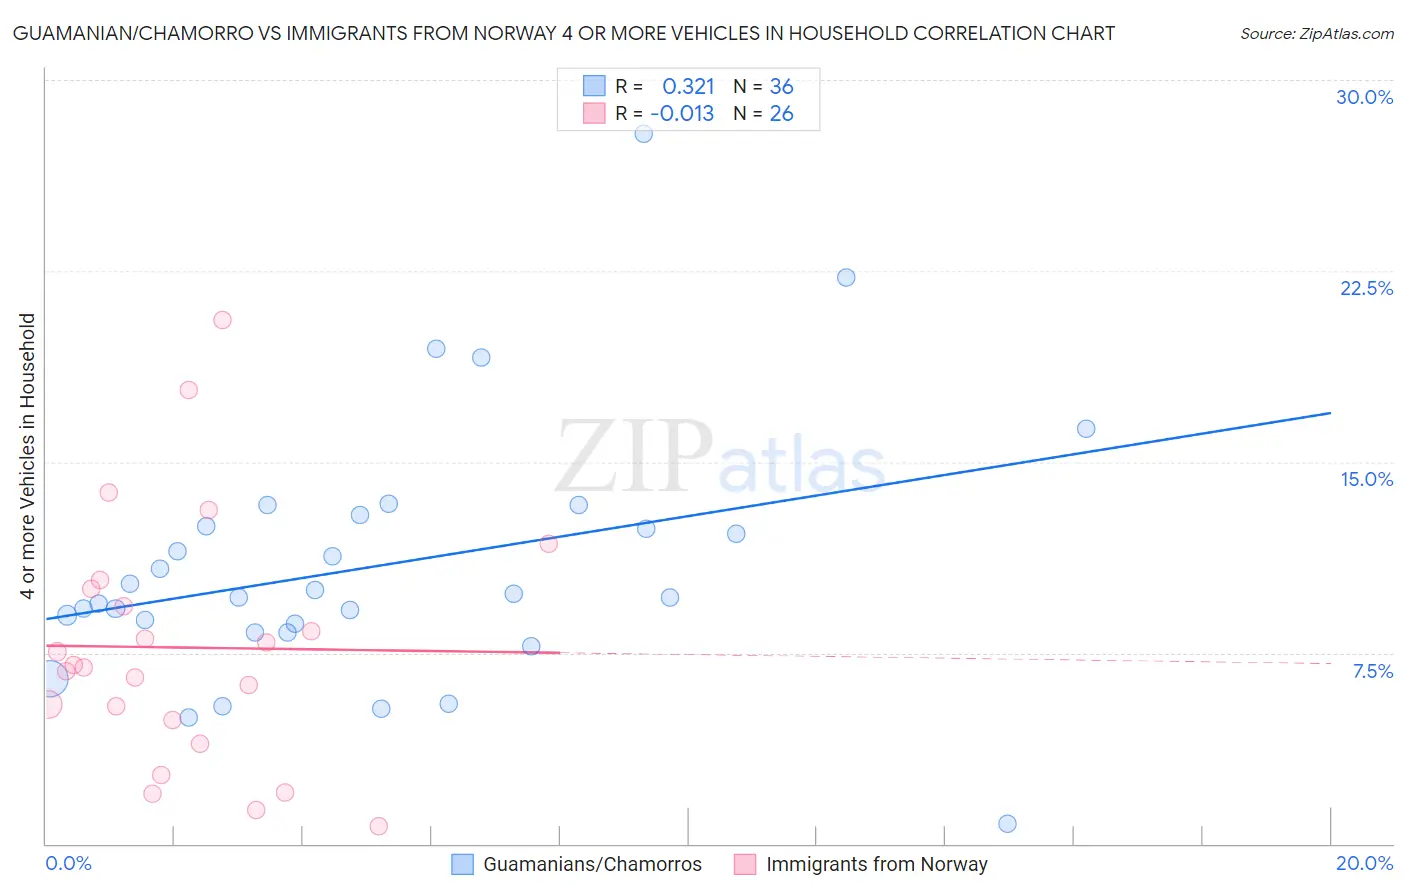
Guamanian/Chamorro vs Immigrants from Norway 4 or more Vehicles in Household Correlation Chart
The statistical analysis conducted on geographies consisting of 221,490,989 people shows a mild positive correlation between the proportion of Guamanians/Chamorros and percentage of households with 4 or more vehicles available in the United States with a correlation coefficient (R) of 0.321 and weighted average of 8.1%. Similarly, the statistical analysis conducted on geographies consisting of 116,239,195 people shows no correlation between the proportion of Immigrants from Norway and percentage of households with 4 or more vehicles available in the United States with a correlation coefficient (R) of -0.013 and weighted average of 6.1%, a difference of 31.7%.
4 or more Vehicles in Household Correlation Summary
| Measurement | Guamanian/Chamorro | Immigrants from Norway |
| Minimum | 0.81% | 0.66% |
| Maximum | 27.9% | 20.6% |
| Range | 27.1% | 19.9% |
| Mean | 10.9% | 7.7% |
| Median | 9.7% | 7.0% |
| Interquartile 25% (IQ1) | 8.5% | 4.9% |
| Interquartile 75% (IQ3) | 12.7% | 10.0% |
| Interquartile Range (IQR) | 4.2% | 5.1% |
| Standard Deviation (Sample) | 5.1% | 4.8% |
| Standard Deviation (Population) | 5.0% | 4.7% |
Similar Demographics by 4 or more Vehicles in Household
Demographics Similar to Guamanians/Chamorros by 4 or more Vehicles in Household
In terms of 4 or more vehicles in household, the demographic groups most similar to Guamanians/Chamorros are Alaskan Athabascan (8.1%, a difference of 0.20%), Norwegian (8.0%, a difference of 0.79%), Yaqui (8.1%, a difference of 0.80%), Scandinavian (8.0%, a difference of 0.96%), and Sioux (8.0%, a difference of 0.99%).
| Demographics | Rating | Rank | 4 or more Vehicles in Household |
| Cheyenne | 100.0 /100 | #28 | Exceptional 8.3% |
| Immigrants | South Eastern Asia | 100.0 /100 | #29 | Exceptional 8.2% |
| Navajo | 100.0 /100 | #30 | Exceptional 8.2% |
| Natives/Alaskans | 100.0 /100 | #31 | Exceptional 8.2% |
| Marshallese | 100.0 /100 | #32 | Exceptional 8.1% |
| Yaqui | 100.0 /100 | #33 | Exceptional 8.1% |
| Alaskan Athabascans | 100.0 /100 | #34 | Exceptional 8.1% |
| Guamanians/Chamorros | 100.0 /100 | #35 | Exceptional 8.1% |
| Norwegians | 100.0 /100 | #36 | Exceptional 8.0% |
| Scandinavians | 100.0 /100 | #37 | Exceptional 8.0% |
| Sioux | 100.0 /100 | #38 | Exceptional 8.0% |
| Spanish Americans | 100.0 /100 | #39 | Exceptional 8.0% |
| Spanish | 100.0 /100 | #40 | Exceptional 7.9% |
| Pima | 100.0 /100 | #41 | Exceptional 7.9% |
| Salvadorans | 100.0 /100 | #42 | Exceptional 7.8% |
Demographics Similar to Immigrants from Norway by 4 or more Vehicles in Household
In terms of 4 or more vehicles in household, the demographic groups most similar to Immigrants from Norway are Latvian (6.1%, a difference of 0.0%), Egyptian (6.1%, a difference of 0.060%), Immigrants from South Central Asia (6.1%, a difference of 0.070%), Immigrants from Portugal (6.1%, a difference of 0.080%), and Immigrants from Sierra Leone (6.1%, a difference of 0.20%).
| Demographics | Rating | Rank | 4 or more Vehicles in Household |
| Romanians | 30.7 /100 | #192 | Fair 6.2% |
| Immigrants | Kuwait | 28.0 /100 | #193 | Fair 6.2% |
| Immigrants | Sweden | 27.0 /100 | #194 | Fair 6.2% |
| Argentineans | 27.0 /100 | #195 | Fair 6.2% |
| Tsimshian | 26.4 /100 | #196 | Fair 6.2% |
| Immigrants | Sri Lanka | 23.7 /100 | #197 | Fair 6.1% |
| Immigrants | Portugal | 22.3 /100 | #198 | Fair 6.1% |
| Immigrants | Norway | 21.8 /100 | #199 | Fair 6.1% |
| Latvians | 21.7 /100 | #200 | Fair 6.1% |
| Egyptians | 21.4 /100 | #201 | Fair 6.1% |
| Immigrants | South Central Asia | 21.3 /100 | #202 | Fair 6.1% |
| Immigrants | Sierra Leone | 20.5 /100 | #203 | Fair 6.1% |
| Immigrants | Belize | 19.8 /100 | #204 | Poor 6.1% |
| Hondurans | 19.3 /100 | #205 | Poor 6.1% |
| Kenyans | 18.5 /100 | #206 | Poor 6.1% |