Dominican 4 or more Vehicles in Household
COMPARE
Dominican
Select to Compare
4 or more Vehicles in Household
Dominican 4 or more Vehicles in Household
3.5%
4+ VEHICLES AVAILABLE
0.0/ 100
METRIC RATING
341st/ 347
METRIC RANK
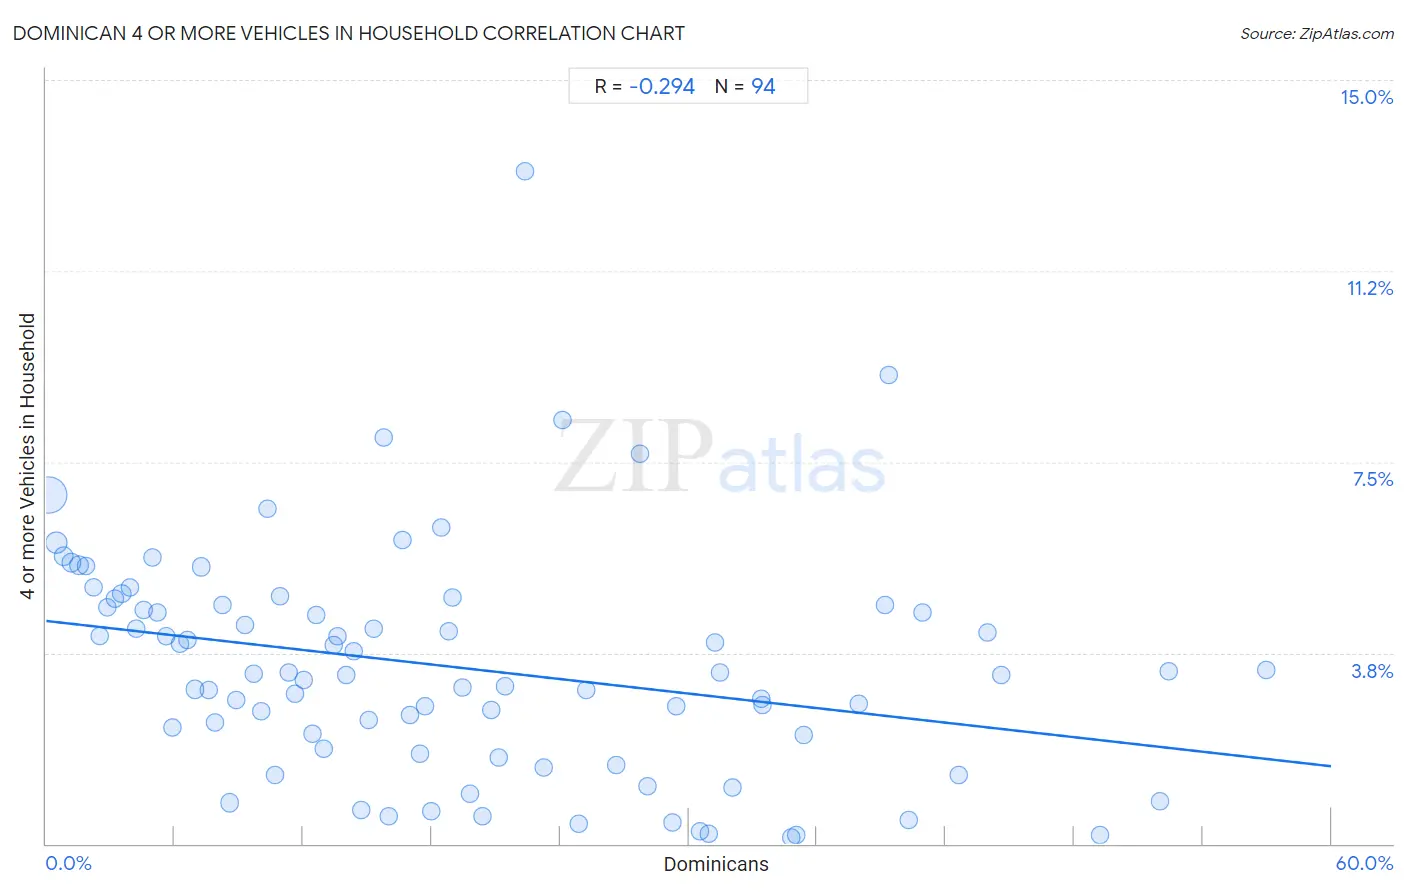
Dominican 4 or more Vehicles in Household Correlation Chart
The statistical analysis conducted on geographies consisting of 353,073,558 people shows a weak negative correlation between the proportion of Dominicans and percentage of households with 4 or more vehicles available in the United States with a correlation coefficient (R) of -0.294 and weighted average of 3.5%. On average, for every 1% (one percent) increase in Dominicans within a typical geography, there is a decrease of 0.048% in percentage of households with 4 or more vehicles available.
It is essential to understand that the correlation between the percentage of Dominicans and percentage of households with 4 or more vehicles available does not imply a direct cause-and-effect relationship. It remains uncertain whether the presence of Dominicans influences an upward or downward trend in the level of percentage of households with 4 or more vehicles available within an area, or if Dominicans simply ended up residing in those areas with higher or lower levels of percentage of households with 4 or more vehicles available due to other factors.
Demographics Similar to Dominicans by 4 or more Vehicles in Household
In terms of 4 or more vehicles in household, the demographic groups most similar to Dominicans are Guyanese (3.5%, a difference of 0.69%), British West Indian (3.5%, a difference of 1.6%), Immigrants from Barbados (3.6%, a difference of 2.8%), Immigrants from Guyana (3.4%, a difference of 3.3%), and Immigrants from Uzbekistan (3.6%, a difference of 3.3%).
| Demographics | Rating | Rank | 4 or more Vehicles in Household |
| Immigrants from Albania | 0.0 /100 | #333 | Tragic 4.1% |
| Immigrants from Trinidad and Tobago | 0.0 /100 | #334 | Tragic 4.1% |
| Barbadians | 0.0 /100 | #335 | Tragic 3.9% |
| Immigrants from Bangladesh | 0.0 /100 | #336 | Tragic 3.9% |
| Vietnamese | 0.0 /100 | #337 | Tragic 3.9% |
| Immigrants from Cabo Verde | 0.0 /100 | #338 | Tragic 3.8% |
| Immigrants from Uzbekistan | 0.0 /100 | #339 | Tragic 3.6% |
| Immigrants from Barbados | 0.0 /100 | #340 | Tragic 3.6% |
| Dominicans | 0.0 /100 | #341 | Tragic 3.5% |
| Guyanese | 0.0 /100 | #342 | Tragic 3.5% |
| British West Indians | 0.0 /100 | #343 | Tragic 3.5% |
| Immigrants from Guyana | 0.0 /100 | #344 | Tragic 3.4% |
| Immigrants from Dominican Republic | 0.0 /100 | #345 | Tragic 3.3% |
| Immigrants from St. Vincent and the Grenadines | 0.0 /100 | #346 | Tragic 3.0% |
| Immigrants from Grenada | 0.0 /100 | #347 | Tragic 2.7% |
Dominican 4 or more Vehicles in Household Correlation Summary
| Measurement | Dominican Data | 4 or more Vehicles in Household Data |
| Minimum | 0.11% | 0.13% |
| Maximum | 57.0% | 13.2% |
| Range | 56.9% | 13.1% |
| Mean | 19.0% | 3.5% |
| Median | 15.9% | 3.3% |
| Interquartile 25% (IQ1) | 7.9% | 1.9% |
| Interquartile 75% (IQ3) | 29.3% | 4.7% |
| Interquartile Range (IQR) | 21.4% | 2.8% |
| Standard Deviation (Sample) | 13.8% | 2.2% |
| Standard Deviation (Population) | 13.8% | 2.2% |
Correlation Details
| Dominican Percentile | Sample Size | 4 or more Vehicles in Household |
[ 0.0% - 0.5% ] 0.11% | 221,304,994 | 6.9% |
[ 0.0% - 0.5% ] 0.48% | 41,035,588 | 5.9% |
[ 0.5% - 1.0% ] 0.83% | 16,139,827 | 5.6% |
[ 1.0% - 1.5% ] 1.17% | 11,483,847 | 5.5% |
[ 1.5% - 2.0% ] 1.52% | 8,873,935 | 5.5% |
[ 1.5% - 2.0% ] 1.84% | 6,564,108 | 5.5% |
[ 2.0% - 2.5% ] 2.19% | 4,105,248 | 5.0% |
[ 2.5% - 3.0% ] 2.50% | 6,590,923 | 4.1% |
[ 2.5% - 3.0% ] 2.86% | 3,662,178 | 4.7% |
[ 3.0% - 3.5% ] 3.22% | 2,677,524 | 4.8% |
[ 3.5% - 4.0% ] 3.53% | 2,834,711 | 4.9% |
[ 3.5% - 4.0% ] 3.89% | 1,542,040 | 5.0% |
[ 4.0% - 4.5% ] 4.23% | 1,277,190 | 4.2% |
[ 4.5% - 5.0% ] 4.56% | 917,876 | 4.6% |
[ 4.5% - 5.0% ] 4.94% | 884,488 | 5.6% |
[ 5.0% - 5.5% ] 5.21% | 950,216 | 4.5% |
[ 5.5% - 6.0% ] 5.58% | 915,181 | 4.1% |
[ 5.5% - 6.0% ] 5.88% | 1,413,677 | 2.3% |
[ 6.0% - 6.5% ] 6.25% | 529,220 | 3.9% |
[ 6.5% - 7.0% ] 6.61% | 923,941 | 4.0% |
[ 6.5% - 7.0% ] 6.95% | 1,014,389 | 3.0% |
[ 7.0% - 7.5% ] 7.22% | 421,631 | 5.4% |
[ 7.5% - 8.0% ] 7.60% | 492,685 | 3.0% |
[ 7.5% - 8.0% ] 7.89% | 523,864 | 2.4% |
[ 8.0% - 8.5% ] 8.23% | 131,957 | 4.7% |
[ 8.5% - 9.0% ] 8.55% | 8,680,543 | 0.81% |
[ 8.5% - 9.0% ] 8.89% | 128,134 | 2.8% |
[ 9.0% - 9.5% ] 9.26% | 386,986 | 4.3% |
[ 9.5% - 10.0% ] 9.67% | 231,658 | 3.3% |
[ 10.0% - 10.5% ] 10.01% | 171,072 | 2.6% |
[ 10.0% - 10.5% ] 10.35% | 458,644 | 6.6% |
[ 10.5% - 11.0% ] 10.66% | 389,049 | 1.3% |
[ 10.5% - 11.0% ] 10.93% | 143,151 | 4.9% |
[ 11.0% - 11.5% ] 11.30% | 217,447 | 3.4% |
[ 11.5% - 12.0% ] 11.62% | 159,904 | 2.9% |
[ 12.0% - 12.5% ] 12.01% | 179,045 | 3.2% |
[ 12.0% - 12.5% ] 12.44% | 29,784 | 2.2% |
[ 12.5% - 13.0% ] 12.60% | 30,253 | 4.5% |
[ 12.5% - 13.0% ] 12.95% | 148,617 | 1.9% |
[ 13.0% - 13.5% ] 13.40% | 187,039 | 3.9% |
[ 13.5% - 14.0% ] 13.62% | 29,977 | 4.1% |
[ 14.0% - 14.5% ] 14.03% | 241,511 | 3.3% |
[ 14.0% - 14.5% ] 14.34% | 21,420 | 3.8% |
[ 14.5% - 15.0% ] 14.70% | 119,137 | 0.67% |
[ 15.0% - 15.5% ] 15.05% | 261,271 | 2.4% |
[ 15.0% - 15.5% ] 15.30% | 254,656 | 4.2% |
[ 15.5% - 16.0% ] 15.73% | 67,652 | 8.0% |
[ 15.5% - 16.0% ] 15.99% | 177,725 | 0.53% |
[ 16.5% - 17.0% ] 16.66% | 173,624 | 6.0% |
[ 17.0% - 17.5% ] 17.01% | 194,109 | 2.5% |
[ 17.0% - 17.5% ] 17.47% | 44,556 | 1.8% |
[ 17.5% - 18.0% ] 17.70% | 119,580 | 2.7% |
[ 17.5% - 18.0% ] 17.99% | 136,127 | 0.63% |
[ 18.0% - 18.5% ] 18.43% | 28,315 | 6.2% |
[ 18.5% - 19.0% ] 18.80% | 71,556 | 4.2% |
[ 18.5% - 19.0% ] 18.98% | 26,322 | 4.8% |
[ 19.0% - 19.5% ] 19.41% | 79,714 | 3.1% |
[ 19.5% - 20.0% ] 19.78% | 87,444 | 0.98% |
[ 20.0% - 20.5% ] 20.37% | 130,234 | 0.55% |
[ 20.5% - 21.0% ] 20.79% | 190,580 | 2.6% |
[ 21.0% - 21.5% ] 21.15% | 125,036 | 1.7% |
[ 21.0% - 21.5% ] 21.42% | 73,231 | 3.1% |
[ 22.0% - 22.5% ] 22.35% | 10,649 | 13.2% |
[ 23.0% - 23.5% ] 23.26% | 140,096 | 1.5% |
[ 24.0% - 24.5% ] 24.10% | 2,332 | 8.3% |
[ 24.5% - 25.0% ] 24.86% | 95,009 | 0.40% |
[ 25.0% - 25.5% ] 25.20% | 14,865 | 3.0% |
[ 26.5% - 27.0% ] 26.59% | 149,813 | 1.5% |
[ 27.5% - 28.0% ] 27.71% | 2,021 | 7.7% |
[ 28.0% - 28.5% ] 28.06% | 56,702 | 1.1% |
[ 29.0% - 29.5% ] 29.27% | 59,852 | 0.41% |
[ 29.0% - 29.5% ] 29.40% | 160,705 | 2.7% |
[ 30.0% - 30.5% ] 30.50% | 61,044 | 0.24% |
[ 30.5% - 31.0% ] 30.95% | 79,817 | 0.20% |
[ 31.0% - 31.5% ] 31.23% | 24,572 | 4.0% |
[ 31.0% - 31.5% ] 31.45% | 11,069 | 3.4% |
[ 32.0% - 32.5% ] 32.02% | 11,939 | 1.1% |
[ 33.0% - 33.5% ] 33.36% | 25,674 | 2.8% |
[ 33.0% - 33.5% ] 33.44% | 15,139 | 2.7% |
[ 34.5% - 35.0% ] 34.77% | 82,678 | 0.13% |
[ 35.0% - 35.5% ] 35.00% | 78,624 | 0.17% |
[ 35.0% - 35.5% ] 35.36% | 49,273 | 2.1% |
[ 37.5% - 38.0% ] 37.93% | 18,461 | 2.8% |
[ 39.0% - 39.5% ] 39.15% | 58,136 | 4.7% |
[ 39.0% - 39.5% ] 39.36% | 6,252 | 9.2% |
[ 40.0% - 40.5% ] 40.29% | 111,904 | 0.46% |
[ 40.5% - 41.0% ] 40.92% | 55,226 | 4.5% |
[ 42.5% - 43.0% ] 42.60% | 34,801 | 1.3% |
[ 43.5% - 44.0% ] 43.93% | 28,352 | 4.2% |
[ 44.5% - 45.0% ] 44.59% | 32,860 | 3.3% |
[ 49.0% - 49.5% ] 49.23% | 41,570 | 0.18% |
[ 51.5% - 52.0% ] 52.00% | 6,977 | 0.84% |
[ 52.0% - 52.5% ] 52.39% | 88,067 | 3.4% |
[ 56.5% - 57.0% ] 56.99% | 52,738 | 3.4% |