Immigrants from Morocco 4 or more Vehicles in Household

COMPARE

Immigrants from Morocco
Race
Ancestry
AfghanAfricanAlaska NativeAlaskan AthabascanAlbanianAleutAlsatianAmericanApacheArabArapahoArgentineanArmenianAssyrian/Chaldean/SyriacAustralianAustrianBahamianBangladeshiBarbadianBasqueBelgianBelizeanBermudanBhutaneseBlackfeetBolivianBrazilianBritishBritish West IndianBulgarianBurmeseCajunCambodianCanadianCape VerdeanCarpatho RusynCelticCentral AmericanCentral American IndianCherokeeCheyenneChickasawChileanChineseChippewaChoctawColombianColvilleComancheCosta RicanCreeCreekCroatianCrowCubanCypriotCzechCzechoslovakianDanishDelawareDominicanDutchDutch West IndianEastern EuropeanEcuadorianEgyptianEnglishEstonianEthiopianEuropeanFijianFilipinoFinnishFrenchFrench American IndianFrench CanadianGermanGerman RussianGhanaianGreekGuamanian/ChamorroGuatemalanGuyaneseHaitianHmongHonduranHopiHoumaHungarianIcelanderIndian (Asian)IndonesianInupiatIranianIraqiIrishIroquoisIsraeliItalianJamaicanJapaneseJordanianKenyanKiowaKoreanLaotianLatvianLebaneseLiberianLithuanianLumbeeLuxembourgerMacedonianMalaysianMalteseMarshalleseMenomineeMexicanMexican American IndianMongolianMoroccanNative HawaiianNavajoNepaleseNew ZealanderNicaraguanNigerianNorthern EuropeanNorwegianOkinawanOsageOttawaPaiutePakistaniPalestinianPanamanianParaguayanPennsylvania GermanPeruvianPimaPolishPortuguesePotawatomiPuebloPuerto RicanPuget Sound SalishRomanianRussianSalvadoranSamoanScandinavianScotch-IrishScottishSeminoleSenegaleseSerbianShoshoneSierra LeoneanSiouxSlavicSlovakSloveneSomaliSouth AfricanSouth AmericanSouth American IndianSoviet UnionSpaniardSpanishSpanish AmericanSpanish American IndianSri LankanSubsaharan AfricanSudaneseSwedishSwissSyrianTaiwaneseThaiTlingit-HaidaTohono O'OdhamTonganTrinidadian and TobagonianTsimshianTurkishU.S. Virgin IslanderUgandanUkrainianUruguayanUteVenezuelanVietnameseWelshWest IndianYakamaYaquiYugoslavianYumanYup'ikZimbabwean
Immigration
NonimmigrantsImmigrantsAfghanistanAfricaAlbaniaArgentinaArmeniaAsiaAustraliaAustriaBahamasBangladeshBarbadosBelarusBelgiumBelizeBoliviaBosnia and HerzegovinaBrazilBulgariaBurma/MyanmarCabo VerdeCambodiaCameroonCanadaCaribbeanCentral AmericaChileChinaColombiaCongoCosta RicaCroatiaCubaCzechoslovakiaDenmarkDominicaDominican RepublicEastern AfricaEastern AsiaEastern EuropeEcuadorEgyptEl SalvadorEnglandEritreaEthiopiaEuropeFijiFranceGermanyGhanaGreeceGrenadaGuatemalaGuyanaHaitiHondurasHong KongHungaryIndiaIndonesiaIranIraqIrelandIsraelItalyJamaicaJapanJordanKazakhstanKenyaKoreaKuwaitLaosLatin AmericaLatviaLebanonLiberiaLithuaniaMalaysiaMexicoMicronesiaMiddle AfricaMoldovaMoroccoNepalNetherlandsNicaraguaNigeriaNorth AmericaNorth MacedoniaNorthern AfricaNorthern EuropeNorwayOceaniaPakistanPanamaPeruPhilippinesPolandPortugalRomaniaRussiaSaudi ArabiaScotlandSenegalSerbiaSierra LeoneSingaporeSomaliaSouth AfricaSouth AmericaSouth Central AsiaSouth Eastern AsiaSouthern EuropeSpainSri LankaSt. Vincent and the GrenadinesSudanSwedenSwitzerlandSyriaTaiwanThailandTrinidad and TobagoTurkeyUgandaUkraineUruguayUzbekistanVenezuelaVietnamWest IndiesWestern AfricaWestern AsiaWestern EuropeYemenZaireZimbabweAzores
Select to Compare
Race
Ancestry
AfghanAfricanAlaska NativeAlaskan AthabascanAlbanianAleutAlsatianAmericanApacheArabArapahoArgentineanArmenianAssyrian/Chaldean/SyriacAustralianAustrianBahamianBangladeshiBarbadianBasqueBelgianBelizeanBermudanBhutaneseBlackfeetBolivianBrazilianBritishBritish West IndianBulgarianBurmeseCajunCambodianCanadianCape VerdeanCarpatho RusynCelticCentral AmericanCentral American IndianCherokeeCheyenneChickasawChileanChineseChippewaChoctawColombianColvilleComancheCosta RicanCreeCreekCroatianCrowCubanCypriotCzechCzechoslovakianDanishDelawareDominicanDutchDutch West IndianEastern EuropeanEcuadorianEgyptianEnglishEstonianEthiopianEuropeanFijianFilipinoFinnishFrenchFrench American IndianFrench CanadianGermanGerman RussianGhanaianGreekGuamanian/ChamorroGuatemalanGuyaneseHaitianHmongHonduranHopiHoumaHungarianIcelanderIndian (Asian)IndonesianInupiatIranianIraqiIrishIroquoisIsraeliItalianJamaicanJapaneseJordanianKenyanKiowaKoreanLaotianLatvianLebaneseLiberianLithuanianLumbeeLuxembourgerMacedonianMalaysianMalteseMarshalleseMenomineeMexicanMexican American IndianMongolianMoroccanNative HawaiianNavajoNepaleseNew ZealanderNicaraguanNigerianNorthern EuropeanNorwegianOkinawanOsageOttawaPaiutePakistaniPalestinianPanamanianParaguayanPennsylvania GermanPeruvianPimaPolishPortuguesePotawatomiPuebloPuerto RicanPuget Sound SalishRomanianRussianSalvadoranSamoanScandinavianScotch-IrishScottishSeminoleSenegaleseSerbianShoshoneSierra LeoneanSiouxSlavicSlovakSloveneSomaliSouth AfricanSouth AmericanSouth American IndianSoviet UnionSpaniardSpanishSpanish AmericanSpanish American IndianSri LankanSubsaharan AfricanSudaneseSwedishSwissSyrianTaiwaneseThaiTlingit-HaidaTohono O'OdhamTonganTrinidadian and TobagonianTsimshianTurkishU.S. Virgin IslanderUgandanUkrainianUruguayanUteVenezuelanVietnameseWelshWest IndianYakamaYaquiYugoslavianYumanYup'ikZimbabwean
Immigration
NonimmigrantsImmigrantsAfghanistanAfricaAlbaniaArgentinaArmeniaAsiaAustraliaAustriaBahamasBangladeshBarbadosBelarusBelgiumBelizeBoliviaBosnia and HerzegovinaBrazilBulgariaBurma/MyanmarCabo VerdeCambodiaCameroonCanadaCaribbeanCentral AmericaChileChinaColombiaCongoCosta RicaCroatiaCubaCzechoslovakiaDenmarkDominicaDominican RepublicEastern AfricaEastern AsiaEastern EuropeEcuadorEgyptEl SalvadorEnglandEritreaEthiopiaEuropeFijiFranceGermanyGhanaGreeceGrenadaGuatemalaGuyanaHaitiHondurasHong KongHungaryIndiaIndonesiaIranIraqIrelandIsraelItalyJamaicaJapanJordanKazakhstanKenyaKoreaKuwaitLaosLatin AmericaLatviaLebanonLiberiaLithuaniaMalaysiaMexicoMicronesiaMiddle AfricaMoldovaNepalNetherlandsNicaraguaNigeriaNorth AmericaNorth MacedoniaNorthern AfricaNorthern EuropeNorwayOceaniaPakistanPanamaPeruPhilippinesPolandPortugalRomaniaRussiaSaudi ArabiaScotlandSenegalSerbiaSierra LeoneSingaporeSomaliaSouth AfricaSouth AmericaSouth Central AsiaSouth Eastern AsiaSouthern EuropeSpainSri LankaSt. Vincent and the GrenadinesSudanSwedenSwitzerlandSyriaTaiwanThailandTrinidad and TobagoTurkeyUgandaUkraineUruguayUzbekistanVenezuelaVietnamWest IndiesWestern AfricaWestern AsiaWestern EuropeYemenZaireZimbabweAzores
4 or more Vehicles in Household
Income
Poverty
Unemployment
Labor Participation
Family Structure
Vehicle Availability
Education Level
Disability

Immigrants from Morocco 4 or more Vehicles in Household
Tragic

5.1%
4+ VEHICLES AVAILABLE
0.0/ 100
METRIC RATING
300th/ 347
METRIC RANK

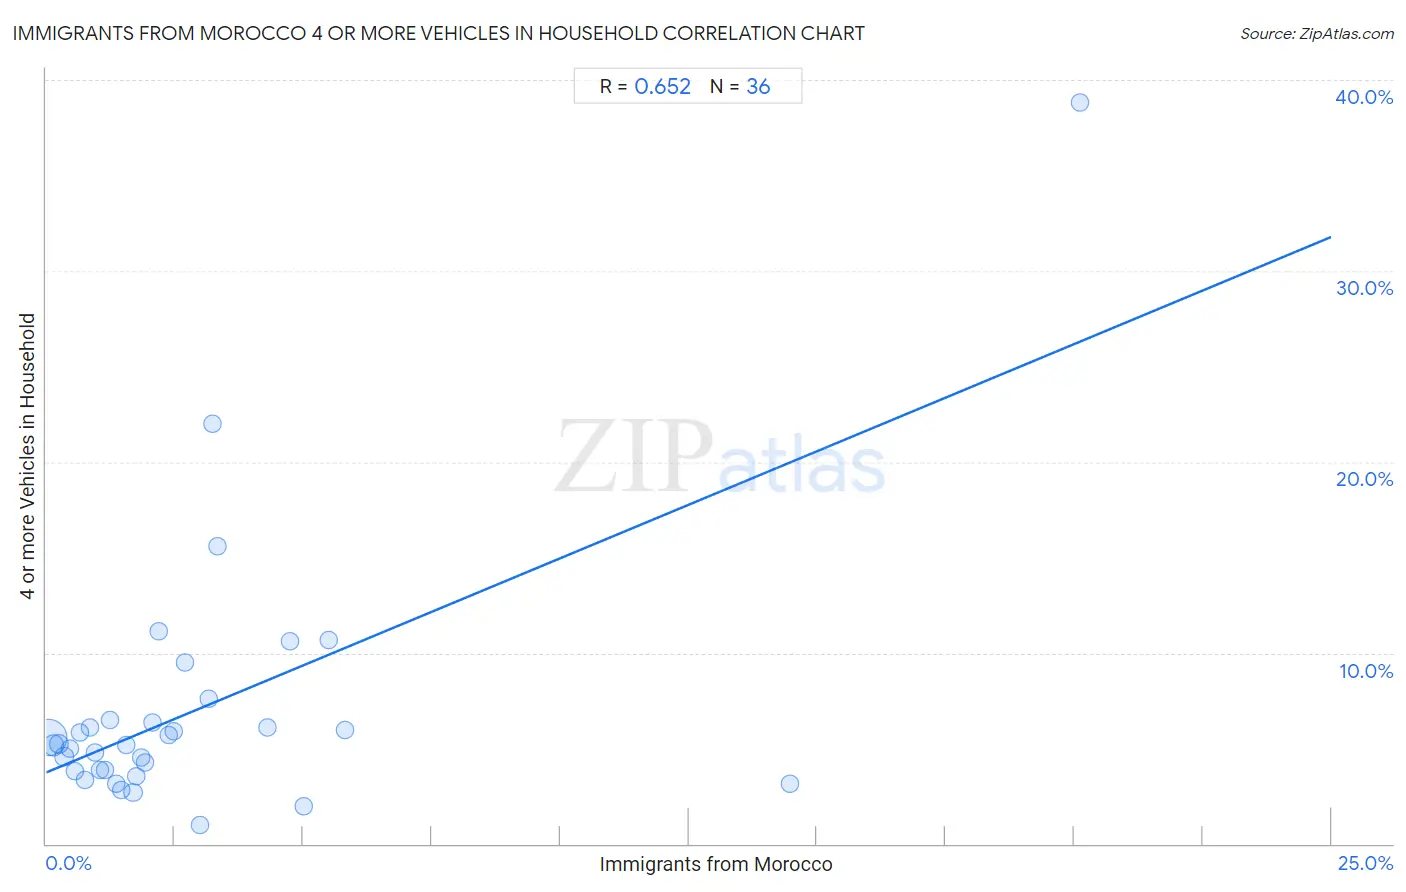
Immigrants from Morocco 4 or more Vehicles in Household Correlation Chart

The statistical analysis conducted on geographies consisting of 178,286,205 people shows a significant positive correlation between the proportion of Immigrants from Morocco and percentage of households with 4 or more vehicles available in the United States with a correlation coefficient (R) of 0.652 and weighted average of 5.1%. On average, for every 1% (one percent) increase in Immigrants from Morocco within a typical geography, there is an increase of 1.1% in percentage of households with 4 or more vehicles available.
Immigrants from Morocco 4 or more Vehicles in Household
It is essential to understand that the correlation between the percentage of Immigrants from Morocco and percentage of households with 4 or more vehicles available does not imply a direct cause-and-effect relationship. It remains uncertain whether the presence of Immigrants from Morocco influences an upward or downward trend in the level of percentage of households with 4 or more vehicles available within an area, or if Immigrants from Morocco simply ended up residing in those areas with higher or lower levels of percentage of households with 4 or more vehicles available due to other factors.

Demographics Similar to Immigrants from Morocco by 4 or more Vehicles in Household

In terms of 4 or more vehicles in household, the demographic groups most similar to Immigrants from Morocco are Immigrants from Zaire (5.1%, a difference of 0.080%), Bahamian (5.1%, a difference of 0.39%), Immigrants from Greece (5.1%, a difference of 0.86%), Cypriot (5.0%, a difference of 1.4%), and Somali (5.0%, a difference of 1.4%).
DemographicsRating | Rank4 or more Vehicles in Household
Immigrants from Congo
0.1
/100
|
#293
Tragic
5.2%
Ghanaians
0.1
/100
|
#294
Tragic
5.2%
Immigrants from Brazil
0.1
/100
|
#295
Tragic
5.2%
Israelis
0.1
/100
|
#296
Tragic
5.2%
Immigrants from Venezuela
0.1
/100
|
#297
Tragic
5.2%
Immigrants from South America
0.1
/100
|
#298
Tragic
5.2%
Immigrants from Ghana
0.1
/100
|
#299
Tragic
5.2%
Immigrants from Morocco
0.0
/100
|
#300
Tragic
5.1%
Immigrants from Zaire
0.0
/100
|
#301
Tragic
5.1%
Bahamians
0.0
/100
|
#302
Tragic
5.1%
Immigrants from Greece
0.0
/100
|
#303
Tragic
5.1%
Cypriots
0.0
/100
|
#304
Tragic
5.0%
Somalis
0.0
/100
|
#305
Tragic
5.0%
Immigrants from Serbia
0.0
/100
|
#306
Tragic
5.0%
Menominee
0.0
/100
|
#307
Tragic
5.0%

Immigrants from Morocco 4 or more Vehicles in Household Correlation Summary

MeasurementImmigrants from Morocco Data4 or more Vehicles in Household Data
Minimum0.040%0.99%
Maximum20.1%38.8%
Range20.1%37.8%
Mean2.9%7.0%
Median1.8%5.2%
Interquartile 25% (IQ1)0.91%3.8%
Interquartile 75% (IQ3)3.2%6.4%
Interquartile Range (IQR)2.3%2.6%
Standard Deviation (Sample)3.9%6.7%
Standard Deviation (Population)3.9%6.6%

Correlation Details

Immigrants from Morocco PercentileSample Size4 or more Vehicles in Household
[
0.0%
-
0.5%
]
0.040%
139,814,7555.6%
[
0.0%
-
0.5%
]
0.14%
21,855,1585.1%
[
0.0%
-
0.5%
]
0.24%
6,919,9045.2%
[
0.0%
-
0.5%
]
0.35%
2,777,8444.6%
[
0.0%
-
0.5%
]
0.45%
1,866,9045.0%
[
0.5%
-
1.0%
]
0.55%
1,753,6323.8%
[
0.5%
-
1.0%
]
0.66%
765,1835.8%
[
0.5%
-
1.0%
]
0.75%
859,1183.4%
[
0.5%
-
1.0%
]
0.86%
376,4656.1%
[
0.5%
-
1.0%
]
0.95%
294,1744.8%
[
1.0%
-
1.5%
]
1.05%
252,1283.8%
[
1.0%
-
1.5%
]
1.15%
129,3453.9%
[
1.0%
-
1.5%
]
1.25%
92,2416.5%
[
1.0%
-
1.5%
]
1.36%
84,2923.1%
[
1.0%
-
1.5%
]
1.47%
74,0492.8%
[
1.5%
-
2.0%
]
1.55%
55,3125.2%
[
1.5%
-
2.0%
]
1.69%
183,4972.7%
[
1.5%
-
2.0%
]
1.76%
7,2933.5%
[
1.5%
-
2.0%
]
1.84%
3,5914.5%
[
1.5%
-
2.0%
]
1.93%
33,0164.3%
[
2.0%
-
2.5%
]
2.06%
9,6836.3%
[
2.0%
-
2.5%
]
2.19%
32011.1%
[
2.0%
-
2.5%
]
2.39%
14,6195.7%
[
2.0%
-
2.5%
]
2.48%
4,3505.9%
[
2.5%
-
3.0%
]
2.69%
20,1559.5%
[
2.5%
-
3.0%
]
2.98%
19,5310.99%
[
3.0%
-
3.5%
]
3.16%
1,8047.6%
[
3.0%
-
3.5%
]
3.24%
5,12122.0%
[
3.0%
-
3.5%
]
3.34%
1,97515.6%
[
4.0%
-
4.5%
]
4.30%
4656.1%
[
4.5%
-
5.0%
]
4.74%
54810.6%
[
5.0%
-
5.5%
]
5.02%
5,1201.9%
[
5.5%
-
6.0%
]
5.51%
89010.7%
[
5.5%
-
6.0%
]
5.81%
2,5665.9%
[
14.0%
-
14.5%
]
14.46%
3323.2%
[
20.0%
-
20.5%
]
20.12%
82538.8%