Guamanian/Chamorro vs Cypriot 4 or more Vehicles in Household
COMPARE
Guamanian/Chamorro
Cypriot
4 or more Vehicles in Household
4 or more Vehicles in Household Comparison
Guamanians/Chamorros
Cypriots
8.1%
4 OR MORE VEHICLES IN HOUSEHOLD
100.0/ 100
METRIC RATING
35th/ 347
METRIC RANK
5.0%
4 OR MORE VEHICLES IN HOUSEHOLD
0.0/ 100
METRIC RATING
304th/ 347
METRIC RANK
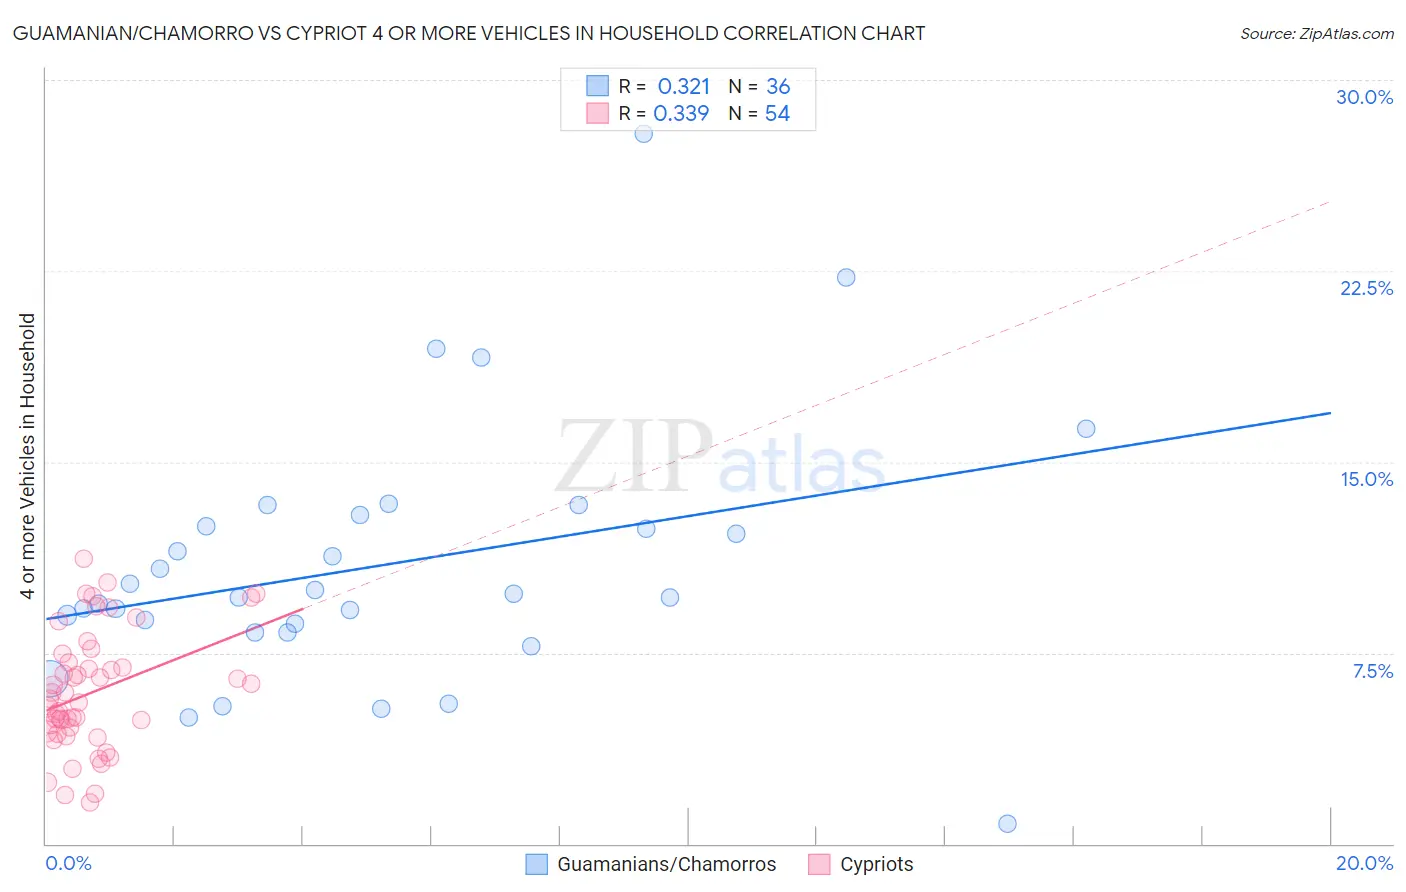
Guamanian/Chamorro vs Cypriot 4 or more Vehicles in Household Correlation Chart
The statistical analysis conducted on geographies consisting of 221,490,989 people shows a mild positive correlation between the proportion of Guamanians/Chamorros and percentage of households with 4 or more vehicles available in the United States with a correlation coefficient (R) of 0.321 and weighted average of 8.1%. Similarly, the statistical analysis conducted on geographies consisting of 61,625,264 people shows a mild positive correlation between the proportion of Cypriots and percentage of households with 4 or more vehicles available in the United States with a correlation coefficient (R) of 0.339 and weighted average of 5.0%, a difference of 60.4%.
4 or more Vehicles in Household Correlation Summary
| Measurement | Guamanian/Chamorro | Cypriot |
| Minimum | 0.81% | 1.6% |
| Maximum | 27.9% | 11.2% |
| Range | 27.1% | 9.6% |
| Mean | 10.9% | 5.9% |
| Median | 9.7% | 5.6% |
| Interquartile 25% (IQ1) | 8.5% | 4.4% |
| Interquartile 75% (IQ3) | 12.7% | 7.1% |
| Interquartile Range (IQR) | 4.2% | 2.7% |
| Standard Deviation (Sample) | 5.1% | 2.3% |
| Standard Deviation (Population) | 5.0% | 2.3% |
Similar Demographics by 4 or more Vehicles in Household
Demographics Similar to Guamanians/Chamorros by 4 or more Vehicles in Household
In terms of 4 or more vehicles in household, the demographic groups most similar to Guamanians/Chamorros are Alaskan Athabascan (8.1%, a difference of 0.20%), Norwegian (8.0%, a difference of 0.79%), Yaqui (8.1%, a difference of 0.80%), Scandinavian (8.0%, a difference of 0.96%), and Sioux (8.0%, a difference of 0.99%).
| Demographics | Rating | Rank | 4 or more Vehicles in Household |
| Cheyenne | 100.0 /100 | #28 | Exceptional 8.3% |
| Immigrants | South Eastern Asia | 100.0 /100 | #29 | Exceptional 8.2% |
| Navajo | 100.0 /100 | #30 | Exceptional 8.2% |
| Natives/Alaskans | 100.0 /100 | #31 | Exceptional 8.2% |
| Marshallese | 100.0 /100 | #32 | Exceptional 8.1% |
| Yaqui | 100.0 /100 | #33 | Exceptional 8.1% |
| Alaskan Athabascans | 100.0 /100 | #34 | Exceptional 8.1% |
| Guamanians/Chamorros | 100.0 /100 | #35 | Exceptional 8.1% |
| Norwegians | 100.0 /100 | #36 | Exceptional 8.0% |
| Scandinavians | 100.0 /100 | #37 | Exceptional 8.0% |
| Sioux | 100.0 /100 | #38 | Exceptional 8.0% |
| Spanish Americans | 100.0 /100 | #39 | Exceptional 8.0% |
| Spanish | 100.0 /100 | #40 | Exceptional 7.9% |
| Pima | 100.0 /100 | #41 | Exceptional 7.9% |
| Salvadorans | 100.0 /100 | #42 | Exceptional 7.8% |
Demographics Similar to Cypriots by 4 or more Vehicles in Household
In terms of 4 or more vehicles in household, the demographic groups most similar to Cypriots are Somali (5.0%, a difference of 0.0%), Immigrants from Serbia (5.0%, a difference of 0.090%), Immigrants from Greece (5.1%, a difference of 0.55%), Bahamian (5.1%, a difference of 1.0%), and Menominee (5.0%, a difference of 1.0%).
| Demographics | Rating | Rank | 4 or more Vehicles in Household |
| Immigrants | Venezuela | 0.1 /100 | #297 | Tragic 5.2% |
| Immigrants | South America | 0.1 /100 | #298 | Tragic 5.2% |
| Immigrants | Ghana | 0.1 /100 | #299 | Tragic 5.2% |
| Immigrants | Morocco | 0.0 /100 | #300 | Tragic 5.1% |
| Immigrants | Zaire | 0.0 /100 | #301 | Tragic 5.1% |
| Bahamians | 0.0 /100 | #302 | Tragic 5.1% |
| Immigrants | Greece | 0.0 /100 | #303 | Tragic 5.1% |
| Cypriots | 0.0 /100 | #304 | Tragic 5.0% |
| Somalis | 0.0 /100 | #305 | Tragic 5.0% |
| Immigrants | Serbia | 0.0 /100 | #306 | Tragic 5.0% |
| Menominee | 0.0 /100 | #307 | Tragic 5.0% |
| Paraguayans | 0.0 /100 | #308 | Tragic 4.9% |
| Immigrants | Somalia | 0.0 /100 | #309 | Tragic 4.9% |
| Moroccans | 0.0 /100 | #310 | Tragic 4.9% |
| Houma | 0.0 /100 | #311 | Tragic 4.9% |