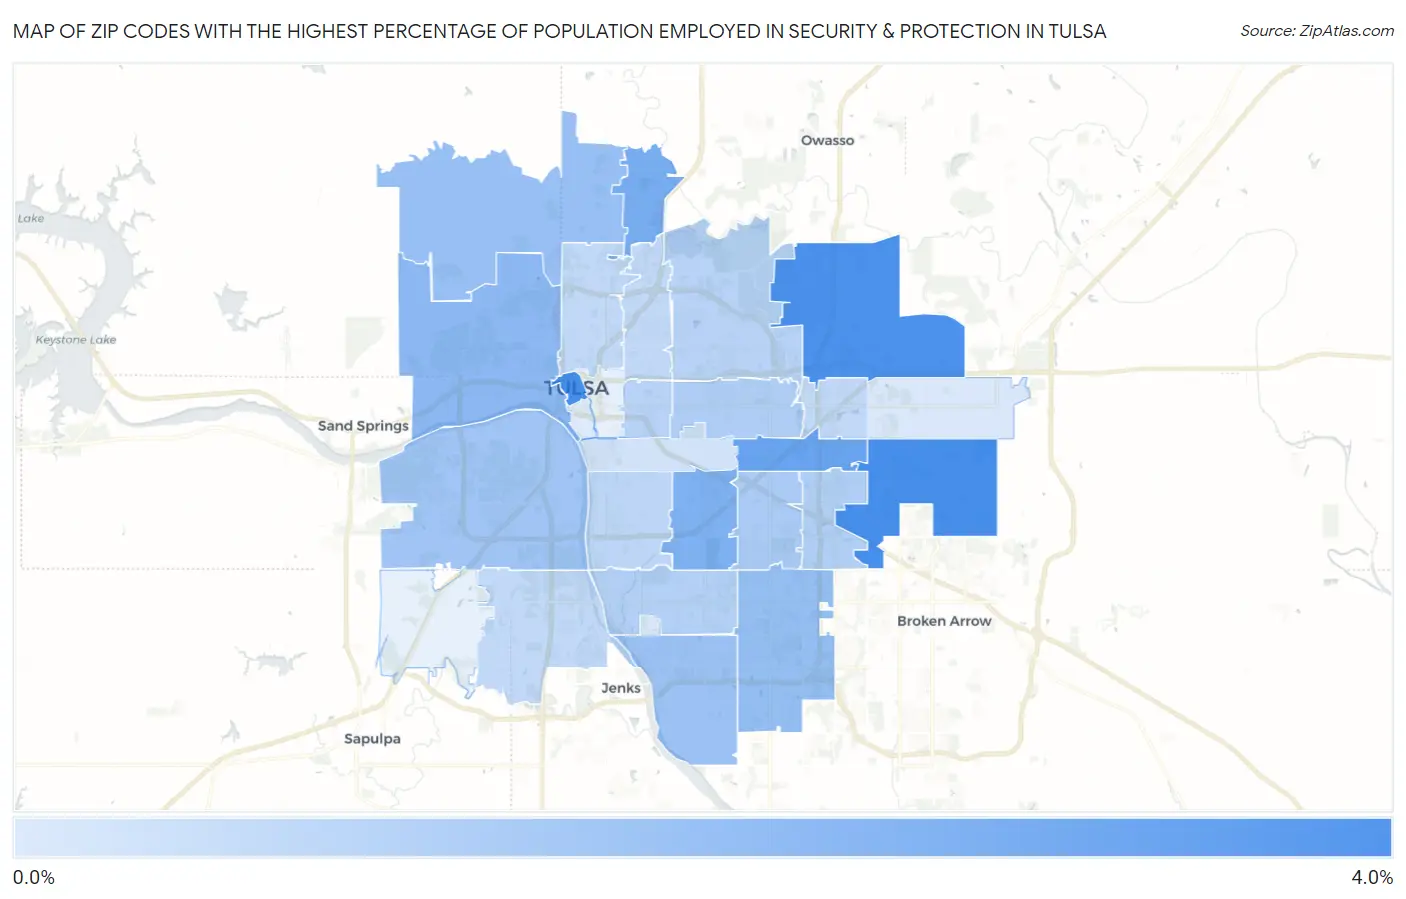
Zip Codes with the Highest Percentage of Population Employed in Security & Protection in Tulsa, OK
RELATED REPORTS & OPTIONS
Security & Protection
Tulsa
Compare Zip Codes
Map of Zip Codes with the Highest Percentage of Population Employed in Security & Protection in Tulsa
0.29%
3.1%
Zip Codes with the Highest Percentage of Population Employed in Security & Protection in Tulsa, OK
| Zip Code | % Employed | vs State | vs National | |
| 1. | 74134 | 3.1% | 2.0%(+1.09)#150 | 2.1%(+0.951)#6,887 |
| 2. | 74103 | 3.1% | 2.0%(+1.07)#152 | 2.1%(+0.934)#6,947 |
| 3. | 74116 | 3.0% | 2.0%(+1.01)#158 | 2.1%(+0.873)#7,147 |
| 4. | 74129 | 2.4% | 2.0%(+0.434)#214 | 2.1%(+0.294)#9,837 |
| 5. | 74130 | 2.2% | 2.0%(+0.168)#254 | 2.1%(+0.028)#11,389 |
| 6. | 74135 | 2.1% | 2.0%(+0.063)#271 | 2.1%(-0.077)#12,103 |
| 7. | 74127 | 1.8% | 2.0%(-0.210)#309 | 2.1%(-0.349)#13,959 |
| 8. | 74133 | 1.6% | 2.0%(-0.374)#338 | 2.1%(-0.513)#15,151 |
| 9. | 74126 | 1.6% | 2.0%(-0.430)#348 | 2.1%(-0.569)#15,574 |
| 10. | 74137 | 1.5% | 2.0%(-0.470)#357 | 2.1%(-0.609)#15,880 |
| 11. | 74107 | 1.4% | 2.0%(-0.625)#378 | 2.1%(-0.764)#17,072 |
| 12. | 74145 | 1.2% | 2.0%(-0.770)#401 | 2.1%(-0.910)#18,213 |
| 13. | 74112 | 1.1% | 2.0%(-0.869)#424 | 2.1%(-1.01)#18,991 |
| 14. | 74146 | 1.1% | 2.0%(-0.909)#429 | 2.1%(-1.05)#19,283 |
| 15. | 74136 | 1.1% | 2.0%(-0.948)#434 | 2.1%(-1.09)#19,568 |
| 16. | 74115 | 0.99% | 2.0%(-1.02)#439 | 2.1%(-1.16)#20,120 |
| 17. | 74104 | 0.97% | 2.0%(-1.03)#444 | 2.1%(-1.17)#20,248 |
| 18. | 74105 | 0.87% | 2.0%(-1.13)#463 | 2.1%(-1.27)#20,942 |
| 19. | 74106 | 0.82% | 2.0%(-1.19)#471 | 2.1%(-1.33)#21,328 |
| 20. | 74132 | 0.79% | 2.0%(-1.22)#476 | 2.1%(-1.35)#21,444 |
| 21. | 74128 | 0.79% | 2.0%(-1.22)#477 | 2.1%(-1.36)#21,481 |
| 22. | 74110 | 0.79% | 2.0%(-1.22)#478 | 2.1%(-1.36)#21,482 |
| 23. | 74114 | 0.49% | 2.0%(-1.52)#508 | 2.1%(-1.66)#23,299 |
| 24. | 74171 | 0.36% | 2.0%(-1.65)#522 | 2.1%(-1.79)#23,918 |
| 25. | 74108 | 0.34% | 2.0%(-1.67)#524 | 2.1%(-1.81)#24,009 |
| 26. | 74119 | 0.29% | 2.0%(-1.72)#526 | 2.1%(-1.86)#24,205 |
1
Common Questions
What are the Top 10 Zip Codes with the Highest Percentage of Population Employed in Security & Protection in Tulsa, OK?
Top 10 Zip Codes with the Highest Percentage of Population Employed in Security & Protection in Tulsa, OK are:
What zip code has the Highest Percentage of Population Employed in Security & Protection in Tulsa, OK?
74134 has the Highest Percentage of Population Employed in Security & Protection in Tulsa, OK with 3.1%.
What is the Percentage of Population Employed in Security & Protection in Tulsa, OK?
Percentage of Population Employed in Security & Protection in Tulsa is 1.4%.
What is the Percentage of Population Employed in Security & Protection in Oklahoma?
Percentage of Population Employed in Security & Protection in Oklahoma is 2.0%.
What is the Percentage of Population Employed in Security & Protection in the United States?
Percentage of Population Employed in Security & Protection in the United States is 2.1%.