Zip Codes with the Highest Percentage of Population Employed in Arts, Entertainment & Recreation in Tulsa, OK
RELATED REPORTS & OPTIONS
Arts, Entertainment & Recreation
Tulsa
Compare Zip Codes
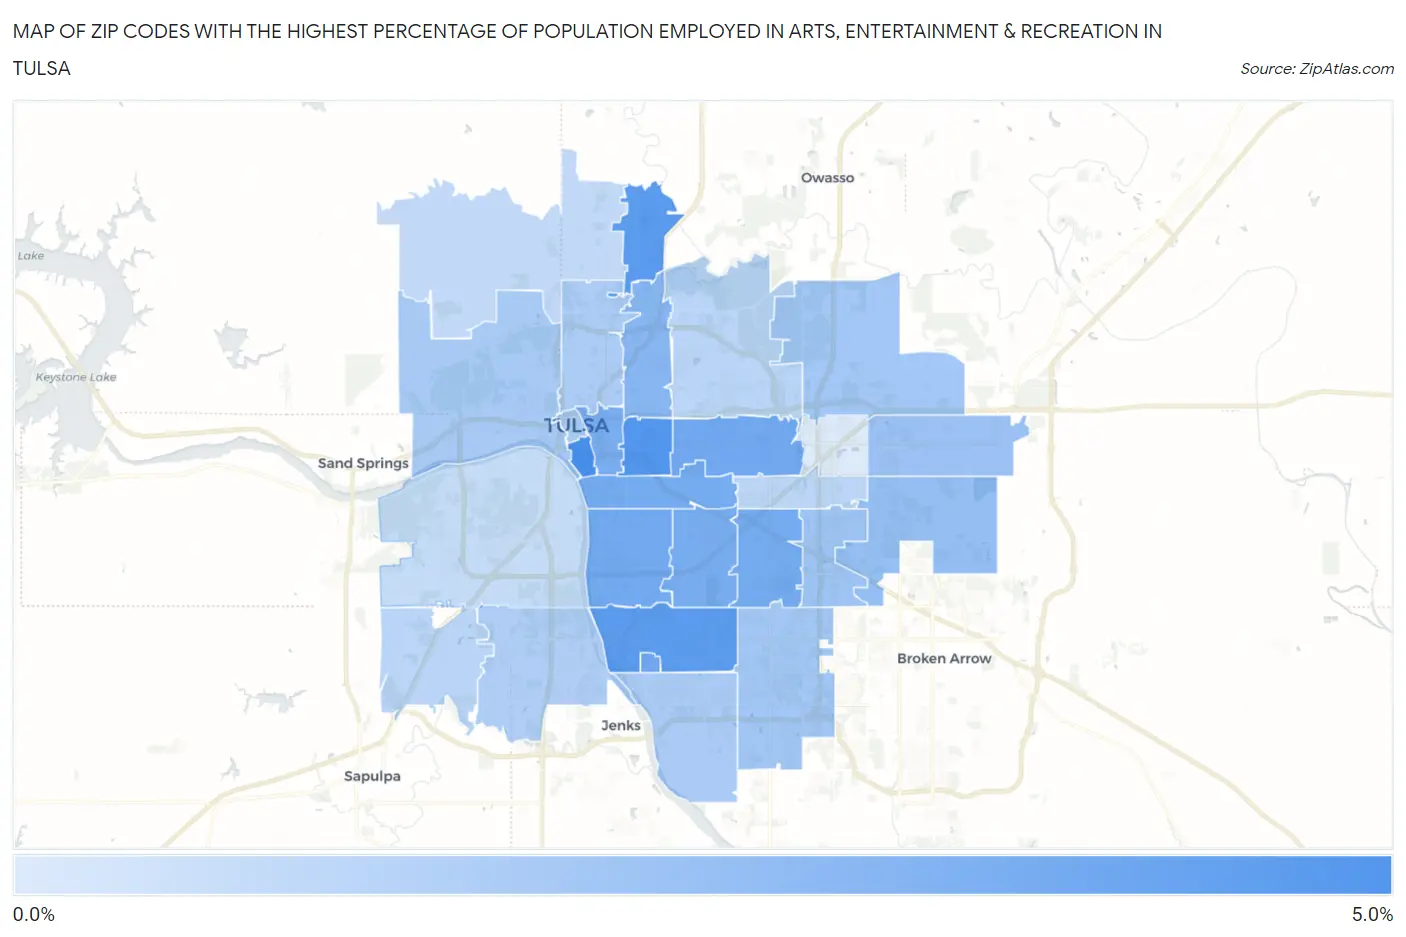
Map of Zip Codes with the Highest Percentage of Population Employed in Arts, Entertainment & Recreation in Tulsa
0.75%
4.6%
Zip Codes with the Highest Percentage of Population Employed in Arts, Entertainment & Recreation in Tulsa, OK
| Zip Code | % Employed | vs State | vs National | |
| 1. | 74119 | 4.6% | 2.4%(+2.22)#88 | 2.1%(+2.53)#2,619 |
| 2. | 74104 | 4.3% | 2.4%(+1.92)#101 | 2.1%(+2.23)#2,947 |
| 3. | 74136 | 4.1% | 2.4%(+1.71)#110 | 2.1%(+2.02)#3,198 |
| 4. | 74130 | 4.1% | 2.4%(+1.71)#111 | 2.1%(+2.01)#3,205 |
| 5. | 74112 | 3.5% | 2.4%(+1.14)#138 | 2.1%(+1.45)#4,063 |
| 6. | 74171 | 3.5% | 2.4%(+1.11)#144 | 2.1%(+1.42)#4,132 |
| 7. | 74105 | 3.4% | 2.4%(+1.05)#148 | 2.1%(+1.36)#4,254 |
| 8. | 74114 | 3.4% | 2.4%(+1.04)#149 | 2.1%(+1.35)#4,284 |
| 9. | 74145 | 3.4% | 2.4%(+1.03)#152 | 2.1%(+1.33)#4,320 |
| 10. | 74135 | 3.3% | 2.4%(+0.937)#157 | 2.1%(+1.25)#4,512 |
| 11. | 74120 | 3.3% | 2.4%(+0.928)#158 | 2.1%(+1.24)#4,530 |
| 12. | 74110 | 2.9% | 2.4%(+0.522)#176 | 2.1%(+0.830)#5,613 |
| 13. | 74134 | 2.6% | 2.4%(+0.189)#203 | 2.1%(+0.497)#6,838 |
| 14. | 74108 | 2.4% | 2.4%(-0.008)#234 | 2.1%(+0.300)#7,726 |
| 15. | 74146 | 2.3% | 2.4%(-0.065)#239 | 2.1%(+0.243)#8,008 |
| 16. | 74133 | 2.2% | 2.4%(-0.150)#249 | 2.1%(+0.158)#8,421 |
| 17. | 74116 | 2.2% | 2.4%(-0.171)#255 | 2.1%(+0.137)#8,517 |
| 18. | 74127 | 2.1% | 2.4%(-0.277)#267 | 2.1%(+0.031)#9,140 |
| 19. | 74137 | 2.1% | 2.4%(-0.331)#274 | 2.1%(-0.023)#9,433 |
| 20. | 74103 | 2.1% | 2.4%(-0.336)#275 | 2.1%(-0.028)#9,467 |
| 21. | 74106 | 2.0% | 2.4%(-0.418)#283 | 2.1%(-0.110)#9,936 |
| 22. | 74132 | 1.9% | 2.4%(-0.455)#293 | 2.1%(-0.147)#10,154 |
| 23. | 74115 | 1.6% | 2.4%(-0.746)#334 | 2.1%(-0.439)#12,133 |
| 24. | 74131 | 1.6% | 2.4%(-0.782)#341 | 2.1%(-0.474)#12,404 |
| 25. | 74129 | 1.6% | 2.4%(-0.813)#348 | 2.1%(-0.505)#12,624 |
| 26. | 74126 | 1.5% | 2.4%(-0.911)#363 | 2.1%(-0.603)#13,380 |
| 27. | 74107 | 1.3% | 2.4%(-1.08)#386 | 2.1%(-0.768)#14,608 |
| 28. | 74128 | 0.75% | 2.4%(-1.64)#447 | 2.1%(-1.33)#18,729 |
1
Common Questions
What are the Top 10 Zip Codes with the Highest Percentage of Population Employed in Arts, Entertainment & Recreation in Tulsa, OK?
Top 10 Zip Codes with the Highest Percentage of Population Employed in Arts, Entertainment & Recreation in Tulsa, OK are:
What zip code has the Highest Percentage of Population Employed in Arts, Entertainment & Recreation in Tulsa, OK?
74119 has the Highest Percentage of Population Employed in Arts, Entertainment & Recreation in Tulsa, OK with 4.6%.
What is the Percentage of Population Employed in Arts, Entertainment & Recreation in Tulsa, OK?
Percentage of Population Employed in Arts, Entertainment & Recreation in Tulsa is 2.7%.
What is the Percentage of Population Employed in Arts, Entertainment & Recreation in Oklahoma?
Percentage of Population Employed in Arts, Entertainment & Recreation in Oklahoma is 2.4%.
What is the Percentage of Population Employed in Arts, Entertainment & Recreation in the United States?
Percentage of Population Employed in Arts, Entertainment & Recreation in the United States is 2.1%.