Zip Codes with the Highest Percentage of Population Employed in Security & Protection in Oklahoma City, OK

RELATED REPORTS & OPTIONS

Security & Protection
Population
Families and Households
Female Fertility
Female Fertility (Unmarried)
Race (Community Size)
Race (Percentage)
Ancestry (Community Size)
AfricanAlaska NativeAlbanianAmericanApacheArabArapahoArgentineanArmenianAustralianAustrianBahamianBangladeshiBarbadianBasqueBelgianBhutaneseBlackfeetBolivianBrazilianBritishBritish West IndianBulgarianBurmeseCajunCambodianCanadianCelticCentral AmericanCentral American IndianCherokeeCheyenneChickasawChileanChippewaChoctawColombianComancheCreeCreekCroatianCubanCzechCzechoslovakianDanishDelawareDominicanDutchDutch West IndianEastern EuropeanEcuadorianEgyptianEnglishEstonianEthiopianEuropeanFijianFilipinoFinnishFrenchFrench American IndianFrench CanadianGermanGerman RussianGhanaianGreekGuamanian / ChamorroGuatemalanGuyaneseHaitianHonduranHopiHungarianIcelanderIndian (Asian)IndonesianInupiatIranianIraqiIrishIroquoisIsraeliItalianJamaicanJapaneseJordanianKenyanKiowaKoreanLaotianLatvianLebaneseLiberianLithuanianLuxembourgerMalaysianMexicanMexican American IndianMongolianMoroccanNative HawaiianNavajoNew ZealanderNicaraguanNigerianNorthern EuropeanNorwegianOkinawanOsagePakistaniPalestinianPanamanianPennsylvania GermanPeruvianPimaPolishPortuguesePotawatomiPuebloPuerto RicanRomanianRussianSalvadoranSamoanScandinavianScotch-IrishScottishSeminoleSerbianSiouxSlavicSlovakSloveneSouth AfricanSouth AmericanSouth American IndianSpaniardSpanishSpanish American IndianSri LankanSubsaharan AfricanSudaneseSwedishSwissSyrianThaiTlingit-HaidaTonganTrinidadian and TobagonianTurkishU.S. Virgin IslanderUkrainianUruguayanVenezuelanVietnameseWelshWest IndianYugoslavianZimbabwean
Ancestry (Percentage)
AfricanAlaska NativeAlbanianAmericanApacheArabArapahoArgentineanArmenianAustralianAustrianBahamianBangladeshiBarbadianBasqueBelgianBhutaneseBlackfeetBolivianBrazilianBritishBritish West IndianBulgarianBurmeseCajunCambodianCanadianCelticCentral AmericanCentral American IndianCherokeeCheyenneChickasawChileanChippewaChoctawColombianComancheCreeCreekCroatianCubanCzechCzechoslovakianDanishDelawareDominicanDutchDutch West IndianEastern EuropeanEcuadorianEgyptianEnglishEstonianEthiopianEuropeanFijianFilipinoFinnishFrenchFrench American IndianFrench CanadianGermanGerman RussianGhanaianGreekGuamanian / ChamorroGuatemalanGuyaneseHaitianHonduranHopiHungarianIcelanderIndian (Asian)IndonesianInupiatIranianIraqiIrishIroquoisIsraeliItalianJamaicanJapaneseJordanianKenyanKiowaKoreanLaotianLatvianLebaneseLiberianLithuanianLuxembourgerMalaysianMexicanMexican American IndianMongolianMoroccanNative HawaiianNavajoNew ZealanderNicaraguanNigerianNorthern EuropeanNorwegianOkinawanOsagePakistaniPalestinianPanamanianPennsylvania GermanPeruvianPimaPolishPortuguesePotawatomiPuebloPuerto RicanRomanianRussianSalvadoranSamoanScandinavianScotch-IrishScottishSeminoleSerbianSiouxSlavicSlovakSloveneSouth AfricanSouth AmericanSouth American IndianSpaniardSpanishSpanish American IndianSri LankanSubsaharan AfricanSudaneseSwedishSwissSyrianThaiTlingit-HaidaTonganTrinidadian and TobagonianTurkishU.S. Virgin IslanderUkrainianUruguayanVenezuelanVietnameseWelshWest IndianYugoslavianZimbabwean
Immigrant Origin (Total)
AfricaArgentinaAsiaAustraliaAustriaBahamasBangladeshBosnia and HerzegovinaBrazilBulgariaBurma / MyanmarCambodiaCameroonCanadaCaribbeanCentral AmericaChileChinaColombiaCubaDominican RepublicEastern AfricaEastern AsiaEastern EuropeEcuadorEgyptEl SalvadorEnglandEritreaEthiopiaEuropeFranceGermanyGhanaGreeceGuatemalaHondurasHong KongIndiaIndonesiaIranIraqIrelandItalyJamaicaJapanJordanKazakhstanKenyaKoreaKuwaitLaosLatin AmericaLebanonLiberiaMalaysiaMexicoMiddle AfricaMoroccoNepalNetherlandsNicaraguaNigeriaNorthern AfricaNorthern EuropeNorwayOceaniaPakistanPanamaPeruPhilippinesPolandPortugalRussiaSaudi ArabiaScotlandSingaporeSouth AfricaSouth AmericaSouth Central AsiaSouth Eastern AsiaSouthern EuropeSpainSudanSyriaTaiwanThailandTrinidad and TobagoTurkeyUkraineVenezuelaVietnamWestern AfricaWestern AsiaWestern EuropeZaireZimbabwe
Immigrant Origin (Percentage)
AfricaArgentinaAsiaAustraliaAustriaBahamasBangladeshBosnia and HerzegovinaBrazilBulgariaBurma / MyanmarCambodiaCameroonCanadaCaribbeanCentral AmericaChileChinaColombiaCubaDominican RepublicEastern AfricaEastern AsiaEastern EuropeEcuadorEgyptEl SalvadorEnglandEritreaEthiopiaEuropeFranceGermanyGhanaGreeceGuatemalaHondurasHong KongIndiaIndonesiaIranIraqIrelandItalyJamaicaJapanJordanKazakhstanKenyaKoreaKuwaitLaosLatin AmericaLebanonLiberiaMalaysiaMexicoMiddle AfricaMoroccoNepalNetherlandsNicaraguaNigeriaNorthern AfricaNorthern EuropeNorwayOceaniaPakistanPanamaPeruPhilippinesPolandPortugalRussiaSaudi ArabiaScotlandSingaporeSouth AfricaSouth AmericaSouth Central AsiaSouth Eastern AsiaSouthern EuropeSpainSudanSyriaTaiwanThailandTrinidad and TobagoTurkeyUkraineVenezuelaVietnamWestern AfricaWestern AsiaWestern EuropeZaireZimbabwe
Income
Income (Families)
Income (Households)
Poverty
Poverty (Families)
Unemployment
Employment Occupations
Employment Industries
Employer Class
Commute Time
Commute Means
School Enrollment
Education by Degree Field
Occupancy
Finances
Physical Characteristics
Oklahoma City
Compare Zip Codes
Comparison Subject

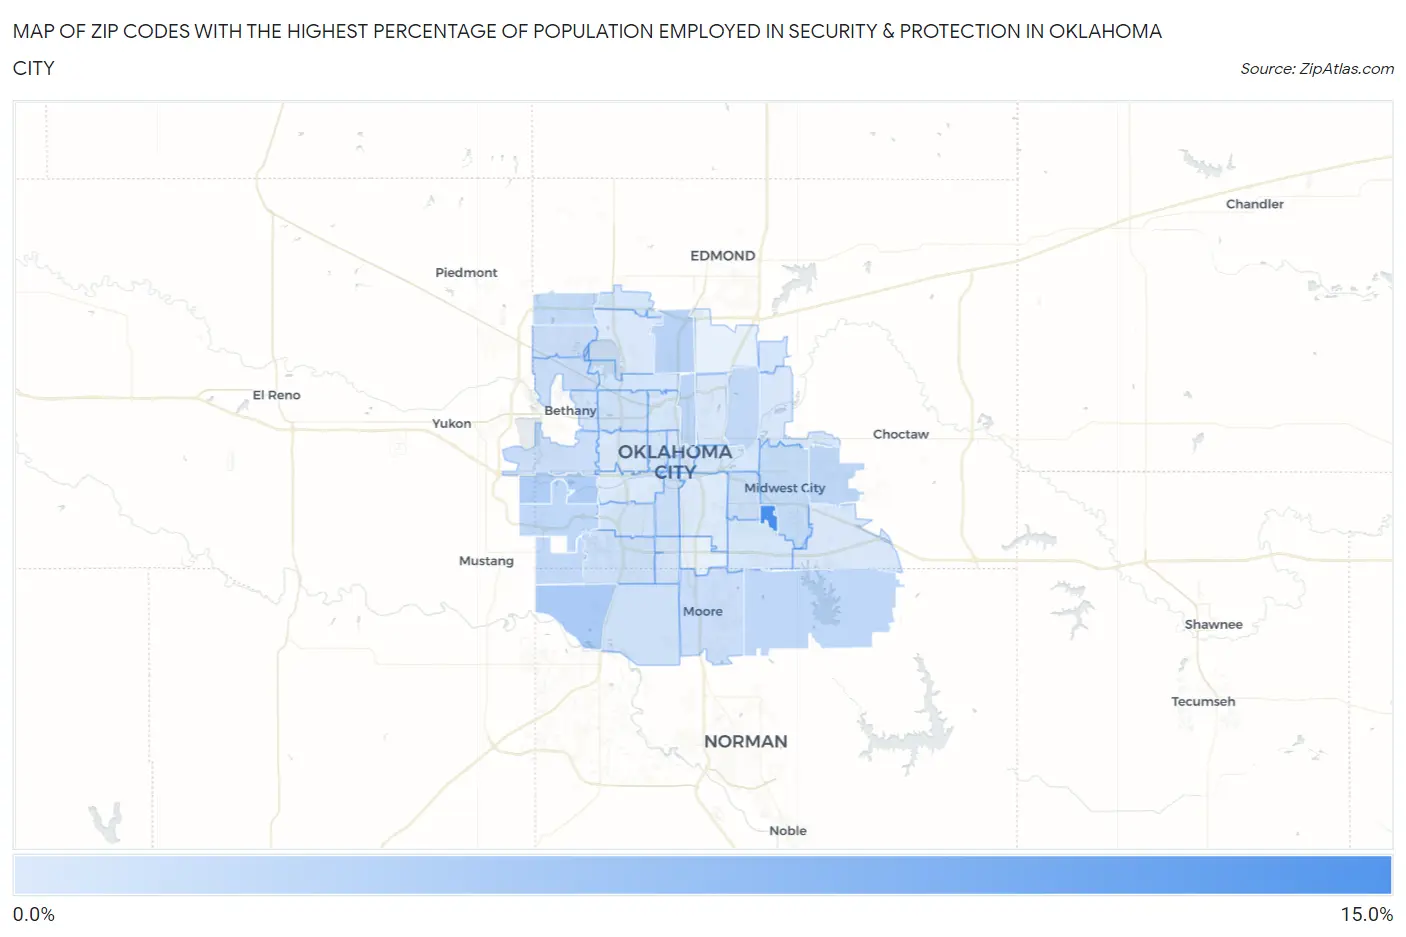
Map of Zip Codes with the Highest Percentage of Population Employed in Security & Protection in Oklahoma City

0.0%
15.0%
Zip Codes with the Highest Percentage of Population Employed in Security & Protection in Oklahoma City Map

Zip Codes with the Highest Percentage of Population Employed in Security & Protection in Oklahoma City, OK

Zip Code % Employed vs State vs National
1.7314514.8%2.0%(+12.8)#92.1%(+12.6)#371
2.731734.9%2.0%(+2.89)#542.1%(+2.75)#3,052
3.731284.2%2.0%(+2.21)#832.1%(+2.07)#4,088
4.731143.7%2.0%(+1.66)#1132.1%(+1.52)#5,222
5.731053.1%2.0%(+1.14)#1482.1%(+0.999)#6,711
6.731793.1%2.0%(+1.05)#1542.1%(+0.914)#7,005
7.731303.0%2.0%(+1.04)#1562.1%(+0.902)#7,038
8.731653.0%2.0%(+0.979)#1622.1%(+0.839)#7,276
9.731212.7%2.0%(+0.703)#1922.1%(+0.563)#8,480
10.731692.7%2.0%(+0.689)#1942.1%(+0.549)#8,540
11.731422.5%2.0%(+0.493)#2112.1%(+0.353)#9,500
12.731102.2%2.0%(+0.232)#2412.1%(+0.093)#11,004
13.731602.0%2.0%(-0.052)#2852.1%(-0.192)#12,843
14.731321.9%2.0%(-0.064)#2862.1%(-0.203)#12,918
15.731271.9%2.0%(-0.108)#2922.1%(-0.247)#13,211
16.731621.9%2.0%(-0.155)#2992.1%(-0.295)#13,529
17.731151.7%2.0%(-0.287)#3222.1%(-0.427)#14,515
18.731091.6%2.0%(-0.370)#3362.1%(-0.510)#15,123
19.731591.6%2.0%(-0.389)#3422.1%(-0.528)#15,260
20.731021.6%2.0%(-0.426)#3472.1%(-0.565)#15,545
21.731121.6%2.0%(-0.438)#3492.1%(-0.578)#15,634
22.731701.6%2.0%(-0.439)#3502.1%(-0.578)#15,641
23.731391.4%2.0%(-0.652)#3822.1%(-0.791)#17,282
24.731221.3%2.0%(-0.725)#3922.1%(-0.865)#17,881
25.731191.1%2.0%(-0.911)#4302.1%(-1.05)#19,300
26.731060.99%2.0%(-1.02)#4402.1%(-1.16)#20,148
27.731160.98%2.0%(-1.03)#4412.1%(-1.17)#20,185
28.731510.98%2.0%(-1.03)#4422.1%(-1.17)#20,212
29.731340.96%2.0%(-1.05)#4472.1%(-1.19)#20,378
30.731350.92%2.0%(-1.08)#4532.1%(-1.22)#20,616
31.731180.90%2.0%(-1.11)#4592.1%(-1.25)#20,823
32.731170.90%2.0%(-1.11)#4602.1%(-1.25)#20,827
33.731030.88%2.0%(-1.13)#4622.1%(-1.27)#20,932
34.731040.86%2.0%(-1.15)#4692.1%(-1.29)#21,063
35.731500.68%2.0%(-1.33)#4932.1%(-1.46)#22,195
36.731410.66%2.0%(-1.35)#4952.1%(-1.49)#22,328
37.731070.65%2.0%(-1.36)#4972.1%(-1.50)#22,372
38.731110.59%2.0%(-1.41)#4982.1%(-1.55)#22,695
39.731200.49%2.0%(-1.52)#5072.1%(-1.65)#23,271
40.731290.24%2.0%(-1.77)#5282.1%(-1.91)#24,396
41.731080.20%2.0%(-1.81)#5312.1%(-1.95)#24,521

Common Questions

What are the Top 10 Zip Codes with the Highest Percentage of Population Employed in Security & Protection in Oklahoma City, OK?
Top 10 Zip Codes with the Highest Percentage of Population Employed in Security & Protection in Oklahoma City, OK are:
#1
14.8%
#2
4.9%
#3
4.2%
#4
3.7%
#5
3.1%
#6
3.1%
#7
3.0%
#8
3.0%
#9
2.7%
#10
2.7%
What zip code has the Highest Percentage of Population Employed in Security & Protection in Oklahoma City, OK?
73145 has the Highest Percentage of Population Employed in Security & Protection in Oklahoma City, OK with 14.8%.
What is the Percentage of Population Employed in Security & Protection in Oklahoma City, OK?
Percentage of Population Employed in Security & Protection in Oklahoma City is 1.8%.
What is the Percentage of Population Employed in Security & Protection in Oklahoma?
Percentage of Population Employed in Security & Protection in Oklahoma is 2.0%.
What is the Percentage of Population Employed in Security & Protection in the United States?
Percentage of Population Employed in Security & Protection in the United States is 2.1%.