Zip Codes with the Highest Percentage of Not-for-profit Organizations in Tulsa, OK

RELATED REPORTS & OPTIONS

Not-for-profit Organizations
Population
Families and Households
Female Fertility
Female Fertility (Unmarried)
Race (Community Size)
Race (Percentage)
Ancestry (Community Size)
AfghanAfricanAleutAmericanApacheArabArapahoArgentineanArmenianAustralianAustrianBahamianBangladeshiBasqueBelgianBelizeanBhutaneseBlackfeetBolivianBrazilianBritishBulgarianBurmeseCajunCanadianCelticCentral AmericanCentral American IndianCherokeeCheyenneChickasawChileanChippewaChoctawColombianComancheCosta RicanCreekCroatianCubanCzechCzechoslovakianDanishDelawareDominicanDutchDutch West IndianEastern EuropeanEcuadorianEgyptianEnglishEstonianEthiopianEuropeanFilipinoFinnishFrenchFrench American IndianFrench CanadianGermanGerman RussianGhanaianGreekGuamanian / ChamorroGuatemalanHaitianHonduranHungarianIcelanderIndian (Asian)IndonesianInupiatIranianIraqiIrishIroquoisIsraeliItalianJamaicanJapaneseJordanianKenyanKiowaKoreanLaotianLatvianLebaneseLiberianLithuanianLumbeeLuxembourgerMalaysianMexicanMexican American IndianMoroccanNative HawaiianNavajoNicaraguanNigerianNorthern EuropeanNorwegianOsageOttawaPakistaniPalestinianPanamanianPennsylvania GermanPeruvianPimaPolishPortuguesePotawatomiPuebloPuerto RicanRomanianRussianSalvadoranSamoanScandinavianScotch-IrishScottishSeminoleSiouxSlavicSlovakSloveneSouth AmericanSouth American IndianSpaniardSpanishSpanish AmericanSri LankanSubsaharan AfricanSudaneseSwedishSwissSyrianThaiTlingit-HaidaTrinidadian and TobagonianTurkishUgandanUkrainianUruguayanVenezuelanVietnameseWelshWest IndianYugoslavian
Ancestry (Percentage)
AfghanAfricanAleutAmericanApacheArabArapahoArgentineanArmenianAustralianAustrianBahamianBangladeshiBasqueBelgianBelizeanBhutaneseBlackfeetBolivianBrazilianBritishBulgarianBurmeseCajunCanadianCelticCentral AmericanCentral American IndianCherokeeCheyenneChickasawChileanChippewaChoctawColombianComancheCosta RicanCreekCroatianCubanCzechCzechoslovakianDanishDelawareDominicanDutchDutch West IndianEastern EuropeanEcuadorianEgyptianEnglishEstonianEthiopianEuropeanFilipinoFinnishFrenchFrench American IndianFrench CanadianGermanGerman RussianGhanaianGreekGuamanian / ChamorroGuatemalanHaitianHonduranHungarianIcelanderIndian (Asian)IndonesianInupiatIranianIraqiIrishIroquoisIsraeliItalianJamaicanJapaneseJordanianKenyanKiowaKoreanLaotianLatvianLebaneseLiberianLithuanianLumbeeLuxembourgerMalaysianMexicanMexican American IndianMoroccanNative HawaiianNavajoNicaraguanNigerianNorthern EuropeanNorwegianOsageOttawaPakistaniPalestinianPanamanianPennsylvania GermanPeruvianPimaPolishPortuguesePotawatomiPuebloPuerto RicanRomanianRussianSalvadoranSamoanScandinavianScotch-IrishScottishSeminoleSiouxSlavicSlovakSloveneSouth AmericanSouth American IndianSpaniardSpanishSpanish AmericanSri LankanSubsaharan AfricanSudaneseSwedishSwissSyrianThaiTlingit-HaidaTrinidadian and TobagonianTurkishUgandanUkrainianUruguayanVenezuelanVietnameseWelshWest IndianYugoslavian
Immigrant Origin (Total)
AfghanistanAfricaArgentinaAsiaAustraliaAustriaBahamasBangladeshBelgiumBelizeBoliviaBrazilBurma / MyanmarCameroonCanadaCaribbeanCentral AmericaChileChinaColombiaCosta RicaCubaDenmarkDominican RepublicEastern AfricaEastern AsiaEastern EuropeEcuadorEgyptEl SalvadorEnglandEritreaEthiopiaEuropeFranceGermanyGhanaGreeceGuatemalaHaitiHondurasHong KongIndiaIndonesiaIranIraqIrelandIsraelItalyJamaicaJapanJordanKazakhstanKenyaKoreaKuwaitLaosLatin AmericaLatviaLebanonLiberiaMalaysiaMexicoMicronesiaMiddle AfricaMoroccoNepalNetherlandsNicaraguaNigeriaNorthern AfricaNorthern EuropeNorwayOceaniaPakistanPanamaPeruPhilippinesPolandPortugalRomaniaRussiaSaudi ArabiaScotlandSouth AfricaSouth AmericaSouth Central AsiaSouth Eastern AsiaSouthern EuropeSpainSwedenSyriaTaiwanThailandTrinidad and TobagoTurkeyUgandaUkraineUruguayVenezuelaVietnamWestern AfricaWestern AsiaWestern EuropeZaireZimbabwe
Immigrant Origin (Percentage)
AfghanistanAfricaArgentinaAsiaAustraliaAustriaBahamasBangladeshBelgiumBelizeBoliviaBrazilBurma / MyanmarCameroonCanadaCaribbeanCentral AmericaChileChinaColombiaCosta RicaCubaDenmarkDominican RepublicEastern AfricaEastern AsiaEastern EuropeEcuadorEgyptEl SalvadorEnglandEritreaEthiopiaEuropeFranceGermanyGhanaGreeceGuatemalaHaitiHondurasHong KongIndiaIndonesiaIranIraqIrelandIsraelItalyJamaicaJapanJordanKazakhstanKenyaKoreaKuwaitLaosLatin AmericaLatviaLebanonLiberiaMalaysiaMexicoMicronesiaMiddle AfricaMoroccoNepalNetherlandsNicaraguaNigeriaNorthern AfricaNorthern EuropeNorwayOceaniaPakistanPanamaPeruPhilippinesPolandPortugalRomaniaRussiaSaudi ArabiaScotlandSouth AfricaSouth AmericaSouth Central AsiaSouth Eastern AsiaSouthern EuropeSpainSwedenSyriaTaiwanThailandTrinidad and TobagoTurkeyUgandaUkraineUruguayVenezuelaVietnamWestern AfricaWestern AsiaWestern EuropeZaireZimbabwe
Income
Income (Families)
Income (Households)
Poverty
Poverty (Families)
Unemployment
Employment Occupations
Employment Industries
Employer Class
Commute Time
Commute Means
School Enrollment
Education by Degree Field
Occupancy
Finances
Physical Characteristics
Tulsa
Compare Zip Codes
Comparison Subject

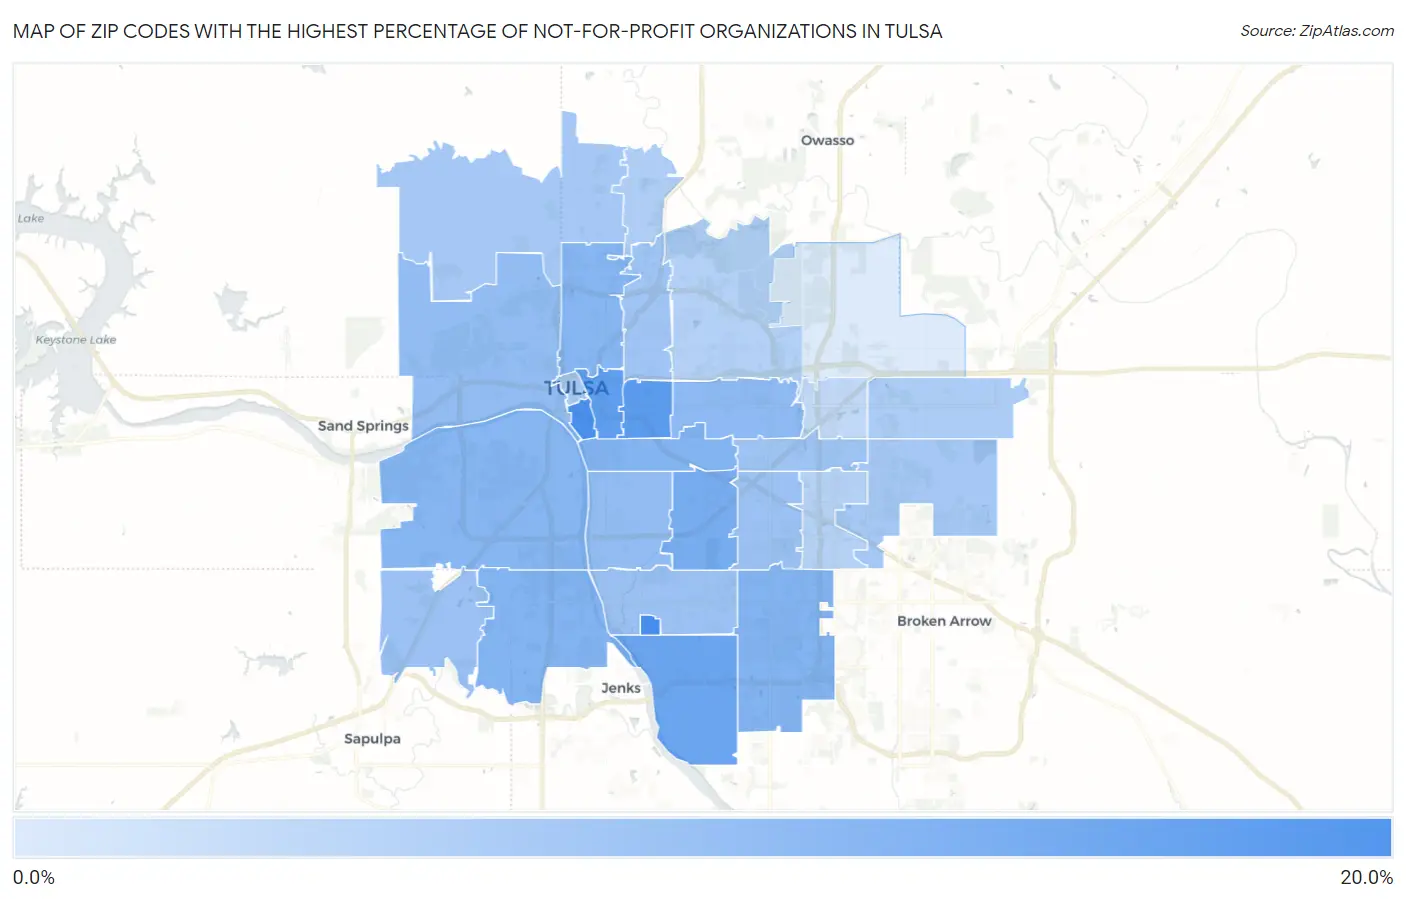
Map of Zip Codes with the Highest Percentage of Not-for-profit Organizations in Tulsa

0.0%
20.0%
Zip Codes with the Highest Percentage of Not-for-profit Organizations in Tulsa Map

Zip Codes with the Highest Percentage of Not-for-profit Organizations in Tulsa, OK

Zip Code % Employed in Not-for-profit vs State vs National
1.7417116.6%6.9%(+9.73)#178.4%(+8.14)#2,190
2.7411916.2%6.9%(+9.39)#208.4%(+7.80)#2,341
3.7410414.2%6.9%(+7.33)#278.4%(+5.75)#3,441
4.7412013.8%6.9%(+6.96)#298.4%(+5.38)#3,740
5.7413712.7%6.9%(+5.80)#348.4%(+4.22)#4,877
6.7413511.3%6.9%(+4.46)#428.4%(+2.87)#6,556
7.7413310.2%6.9%(+3.31)#578.4%(+1.73)#8,563
8.7411410.1%6.9%(+3.26)#588.4%(+1.67)#8,675
9.7413210.1%6.9%(+3.22)#608.4%(+1.64)#8,748
10.741079.6%6.9%(+2.72)#698.4%(+1.14)#9,783
11.741069.6%6.9%(+2.71)#708.4%(+1.12)#9,824
12.741129.0%6.9%(+2.13)#858.4%(+0.542)#11,094
13.741278.5%6.9%(+1.62)#1038.4%(+0.035)#12,327
14.741058.5%6.9%(+1.59)#1048.4%(+0.007)#12,411
15.741367.6%6.9%(+0.728)#1388.4%(-0.858)#14,802
16.741457.5%6.9%(+0.614)#1458.4%(-0.972)#15,151
17.741317.4%6.9%(+0.521)#1508.4%(-1.07)#15,441
18.741297.1%6.9%(+0.284)#1668.4%(-1.30)#16,170
19.741106.9%6.9%(+0.032)#1798.4%(-1.55)#16,915
20.741266.5%6.9%(-0.310)#2028.4%(-1.90)#17,883
21.741346.5%6.9%(-0.401)#2118.4%(-1.99)#18,155
22.741036.3%6.9%(-0.523)#2208.4%(-2.11)#18,518
23.741085.9%6.9%(-0.939)#2488.4%(-2.52)#19,703
24.741305.6%6.9%(-1.22)#2678.4%(-2.80)#20,539
25.741155.1%6.9%(-1.80)#3068.4%(-3.39)#22,202
26.741464.9%6.9%(-2.00)#3208.4%(-3.59)#22,679
27.741283.9%6.9%(-2.99)#3948.4%(-4.58)#24,962
28.741161.1%6.9%(-5.80)#5688.4%(-7.39)#28,882

Common Questions

What are the Top 10 Zip Codes with the Highest Percentage of Not-for-profit Organizations in Tulsa, OK?
Top 10 Zip Codes with the Highest Percentage of Not-for-profit Organizations in Tulsa, OK are:
#1
16.6%
#2
16.2%
#3
14.2%
#4
13.8%
#5
12.7%
#6
11.3%
#7
10.2%
#8
10.1%
#9
10.1%
#10
9.6%
What zip code has the Highest Percentage of Not-for-profit Organizations in Tulsa, OK?
74171 has the Highest Percentage of Not-for-profit Organizations in Tulsa, OK with 16.6%.
What is the Percentage of Not-for-profit Organizations in Tulsa, OK?
Percentage of Not-for-profit Organizations in Tulsa is 8.9%.
What is the Percentage of Not-for-profit Organizations in Oklahoma?
Percentage of Not-for-profit Organizations in Oklahoma is 6.9%.
What is the Percentage of Not-for-profit Organizations in the United States?
Percentage of Not-for-profit Organizations in the United States is 8.4%.