Zip Codes with the Highest Percentage of Population with a Degree in Psychology in Omaha, NE

RELATED REPORTS & OPTIONS

Psychology
Population
Families and Households
Female Fertility
Female Fertility (Unmarried)
Race (Community Size)
Race (Percentage)
Ancestry (Community Size)
AfghanAfricanAlbanianAleutAmericanApacheArabArapahoArgentineanArmenianAustralianAustrianBangladeshiBasqueBelgianBhutaneseBlackfeetBolivianBrazilianBritishBulgarianBurmeseCajunCambodianCanadianCarpatho RusynCentral AmericanCentral American IndianCherokeeChickasawChileanChineseChippewaChoctawColombianComancheCosta RicanCreekCroatianCubanCzechCzechoslovakianDanishDominicanDutchEastern EuropeanEcuadorianEgyptianEnglishEthiopianEuropeanFilipinoFinnishFrenchFrench American IndianFrench CanadianGermanGerman RussianGhanaianGreekGuamanian / ChamorroGuatemalanGuyaneseHaitianHonduranHungarianIcelanderIndian (Asian)IndonesianInupiatIranianIraqiIrishIroquoisIsraeliItalianJamaicanJapaneseJordanianKenyanKiowaKoreanLaotianLatvianLebaneseLithuanianLuxembourgerMacedonianMalaysianMexicanMexican American IndianMoroccanNative HawaiianNavajoNicaraguanNigerianNorthern EuropeanNorwegianPakistaniPalestinianPanamanianPennsylvania GermanPeruvianPolishPortuguesePotawatomiPuebloPuerto RicanRomanianRussianSalvadoranSamoanScandinavianScotch-IrishScottishSeminoleSerbianSiouxSlavicSlovakSloveneSomaliSouth AfricanSouth AmericanSpaniardSpanishSri LankanSubsaharan AfricanSudaneseSwedishSwissSyrianThaiTlingit-HaidaTrinidadian and TobagonianTurkishUkrainianVenezuelanVietnameseWelshWest IndianYugoslavianZimbabwean
Ancestry (Percentage)
AfghanAfricanAlbanianAleutAmericanApacheArabArapahoArgentineanArmenianAustralianAustrianBangladeshiBasqueBelgianBhutaneseBlackfeetBolivianBrazilianBritishBulgarianBurmeseCajunCambodianCanadianCarpatho RusynCentral AmericanCentral American IndianCherokeeChickasawChileanChineseChippewaChoctawColombianComancheCosta RicanCreekCroatianCubanCzechCzechoslovakianDanishDominicanDutchEastern EuropeanEcuadorianEgyptianEnglishEthiopianEuropeanFilipinoFinnishFrenchFrench American IndianFrench CanadianGermanGerman RussianGhanaianGreekGuamanian / ChamorroGuatemalanGuyaneseHaitianHonduranHungarianIcelanderIndian (Asian)IndonesianInupiatIranianIraqiIrishIroquoisIsraeliItalianJamaicanJapaneseJordanianKenyanKiowaKoreanLaotianLatvianLebaneseLithuanianLuxembourgerMacedonianMalaysianMexicanMexican American IndianMoroccanNative HawaiianNavajoNicaraguanNigerianNorthern EuropeanNorwegianPakistaniPalestinianPanamanianPennsylvania GermanPeruvianPolishPortuguesePotawatomiPuebloPuerto RicanRomanianRussianSalvadoranSamoanScandinavianScotch-IrishScottishSeminoleSerbianSiouxSlavicSlovakSloveneSomaliSouth AfricanSouth AmericanSpaniardSpanishSri LankanSubsaharan AfricanSudaneseSwedishSwissSyrianThaiTlingit-HaidaTrinidadian and TobagonianTurkishUkrainianVenezuelanVietnameseWelshWest IndianYugoslavianZimbabwean
Immigrant Origin (Total)
AfghanistanAfricaArgentinaAsiaAustraliaBangladeshBarbadosBelarusBosnia and HerzegovinaBrazilBurma / MyanmarCameroonCanadaCaribbeanCentral AmericaChileChinaColombiaCongoCosta RicaCroatiaCubaCzechoslovakiaDominican RepublicEastern AfricaEastern AsiaEastern EuropeEgyptEl SalvadorEnglandEthiopiaEuropeFranceGermanyGhanaGreeceGuatemalaHondurasHong KongHungaryIndiaIndonesiaIranIraqIrelandIsraelItalyJamaicaJapanJordanKazakhstanKenyaKoreaKuwaitLaosLatin AmericaLatviaLithuaniaMalaysiaMexicoMiddle AfricaMoroccoNepalNetherlandsNicaraguaNigeriaNorthern AfricaNorthern EuropeOceaniaPakistanPanamaPeruPhilippinesPolandPortugalRomaniaRussiaSaudi ArabiaScotlandSierra LeoneSomaliaSouth AfricaSouth AmericaSouth Central AsiaSouth Eastern AsiaSouthern EuropeSpainSri LankaSudanSyriaTaiwanThailandTrinidad and TobagoTurkeyUgandaUkraineVenezuelaVietnamWestern AfricaWestern AsiaWestern EuropeZaireZimbabwe
Immigrant Origin (Percentage)
AfghanistanAfricaArgentinaAsiaAustraliaBangladeshBarbadosBelarusBosnia and HerzegovinaBrazilBurma / MyanmarCameroonCanadaCaribbeanCentral AmericaChileChinaColombiaCongoCosta RicaCroatiaCubaCzechoslovakiaDominican RepublicEastern AfricaEastern AsiaEastern EuropeEgyptEl SalvadorEnglandEthiopiaEuropeFranceGermanyGhanaGreeceGuatemalaHondurasHong KongHungaryIndiaIndonesiaIranIraqIrelandIsraelItalyJamaicaJapanJordanKazakhstanKenyaKoreaKuwaitLaosLatin AmericaLatviaLithuaniaMalaysiaMexicoMiddle AfricaMoroccoNepalNetherlandsNicaraguaNigeriaNorthern AfricaNorthern EuropeOceaniaPakistanPanamaPeruPhilippinesPolandPortugalRomaniaRussiaSaudi ArabiaScotlandSierra LeoneSomaliaSouth AfricaSouth AmericaSouth Central AsiaSouth Eastern AsiaSouthern EuropeSpainSri LankaSudanSyriaTaiwanThailandTrinidad and TobagoTurkeyUgandaUkraineVenezuelaVietnamWestern AfricaWestern AsiaWestern EuropeZaireZimbabwe
Income
Income (Families)
Income (Households)
Poverty
Poverty (Families)
Unemployment
Employment Occupations
Employment Industries
Employer Class
Commute Time
Commute Means
School Enrollment
Education by Degree Field
Occupancy
Finances
Physical Characteristics
Omaha
Compare Zip Codes
Comparison Subject

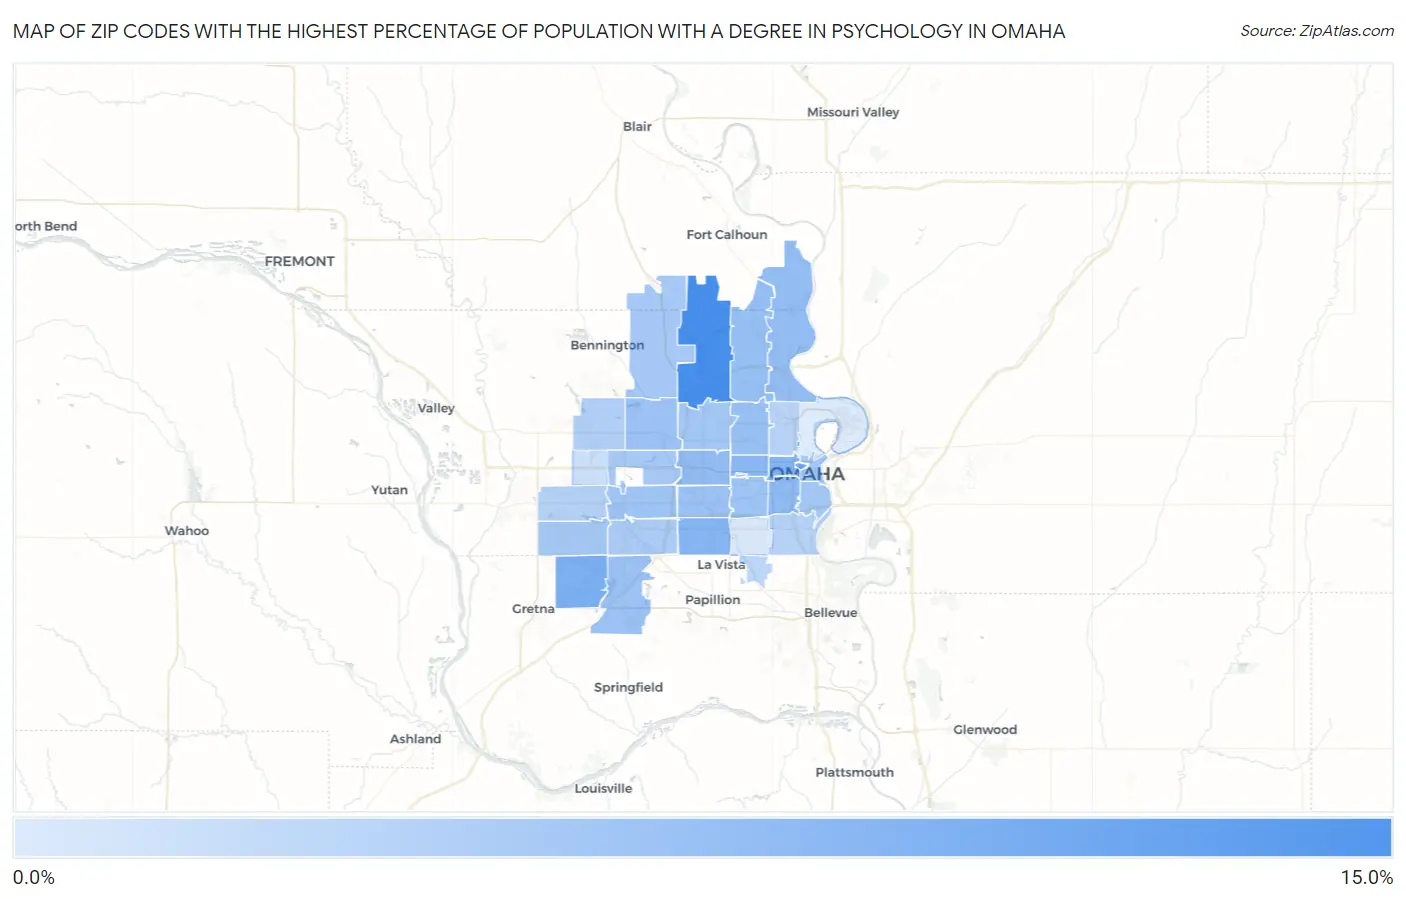
Map of Zip Codes with the Highest Percentage of Population with a Degree in Psychology in Omaha

0.0%
15.0%
Zip Codes with the Highest Percentage of Population with a Degree in Psychology in Omaha Map

Zip Codes with the Highest Percentage of Population with a Degree in Psychology in Omaha, NE

Zip Code % Graduates vs State vs National
1.6812211.1%4.3%(+6.86)#365.1%(+6.07)#2,005
2.681788.0%4.3%(+3.74)#665.1%(+2.95)#4,124
3.681367.2%4.3%(+2.94)#815.1%(+2.14)#5,291
4.681316.7%4.3%(+2.48)#885.1%(+1.69)#6,137
5.681276.6%4.3%(+2.36)#905.1%(+1.57)#6,407
6.681326.2%4.3%(+1.92)#975.1%(+1.13)#7,429
7.681055.9%4.3%(+1.67)#1015.1%(+0.880)#8,161
8.681145.6%4.3%(+1.38)#1125.1%(+0.593)#9,046
9.681125.6%4.3%(+1.30)#1155.1%(+0.504)#9,317
10.681525.5%4.3%(+1.20)#1205.1%(+0.405)#9,666
11.681045.2%4.3%(+0.978)#1265.1%(+0.186)#10,397
12.681645.0%4.3%(+0.735)#1375.1%(-0.057)#11,304
13.681385.0%4.3%(+0.698)#1395.1%(-0.094)#11,430
14.681244.8%4.3%(+0.561)#1455.1%(-0.231)#11,896
15.681064.8%4.3%(+0.521)#1485.1%(-0.271)#12,018
16.681444.7%4.3%(+0.429)#1525.1%(-0.363)#12,364
17.681344.5%4.3%(+0.215)#1625.1%(-0.577)#13,208
18.681024.4%4.3%(+0.138)#1645.1%(-0.654)#13,484
19.681084.3%4.3%(+0.083)#1695.1%(-0.709)#13,704
20.681354.3%4.3%(+0.052)#1735.1%(-0.740)#13,818
21.681424.2%4.3%(-0.057)#1785.1%(-0.849)#14,213
22.681544.2%4.3%(-0.064)#1795.1%(-0.856)#14,243
23.681373.9%4.3%(-0.380)#1895.1%(-1.17)#15,345
24.681163.5%4.3%(-0.760)#2035.1%(-1.55)#16,699
25.681303.2%4.3%(-1.11)#2155.1%(-1.90)#17,788
26.681073.1%4.3%(-1.16)#2185.1%(-1.96)#17,949
27.681113.0%4.3%(-1.30)#2245.1%(-2.09)#18,356
28.681572.6%4.3%(-1.69)#2455.1%(-2.48)#19,435
29.681181.5%4.3%(-2.76)#3105.1%(-3.55)#21,810
30.681170.74%4.3%(-3.52)#3605.1%(-4.31)#23,021
31.681100.41%4.3%(-3.85)#3675.1%(-4.64)#23,329

Common Questions

What are the Top 10 Zip Codes with the Highest Percentage of Population with a Degree in Psychology in Omaha, NE?
Top 10 Zip Codes with the Highest Percentage of Population with a Degree in Psychology in Omaha, NE are:
#1
11.1%
#2
8.0%
#3
7.2%
#4
6.7%
#5
6.6%
#6
6.2%
#7
5.9%
#8
5.6%
#9
5.6%
#10
5.5%
What zip code has the Highest Percentage of Population with a Degree in Psychology in Omaha, NE?
68122 has the Highest Percentage of Population with a Degree in Psychology in Omaha, NE with 11.1%.
What is the Percentage of Population with a Degree in Psychology in Omaha, NE?
Percentage of Population with a Degree in Psychology in Omaha is 4.7%.
What is the Percentage of Population with a Degree in Psychology in Nebraska?
Percentage of Population with a Degree in Psychology in Nebraska is 4.3%.
What is the Percentage of Population with a Degree in Psychology in the United States?
Percentage of Population with a Degree in Psychology in the United States is 5.1%.