Walton, NE Map & Demographics
Walton Map
Walton Overview
$71,509
PER CAPITA INCOME
$46,287
AVG HOUSEHOLD INCOME
81.0%
WAGE / INCOME GAP [ % ]
19.0¢/ $1
WAGE / INCOME GAP [ $ ]
0.67
INEQUALITY / GINI INDEX
474
TOTAL POPULATION
246
MALE POPULATION
228
FEMALE POPULATION
107.89
MALES / 100 FEMALES
92.68
FEMALES / 100 MALES
61.6
MEDIAN AGE
2.4
AVG FAMILY SIZE
2.2
AVG HOUSEHOLD SIZE
340
LABOR FORCE [ PEOPLE ]
71.7%
PERCENT IN LABOR FORCE
Walton Zip Codes
Walton Area Codes
Income in Walton
Income Overview in Walton
| Characteristic | Number | Measure |
| Per Capita Income | 474 | $71,509 |
| Median Family Income | 177 | $0 |
| Mean Family Income | 177 | $170,185 |
| Median Household Income | 219 | $46,287 |
| Mean Household Income | 219 | $142,643 |
| Income Deficit | 177 | $0 |
| Wage / Income Gap (%) | 474 | 81.01% |
| Wage / Income Gap ($) | 474 | 18.99¢ per $1 |
| Gini / Inequality Index | 474 | 0.67 |
Earnings by Sex in Walton
Average Earnings in Walton are $33,243, $33,885 for men and $6,434 for women, a difference of 81.0%.
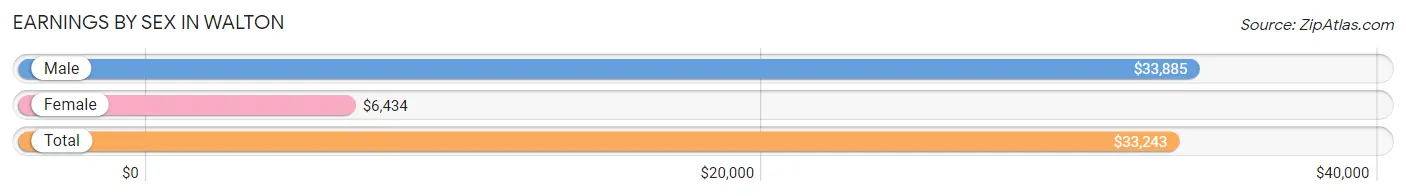
| Sex | Number | Average Earnings |
| Male | 233 (66.6%) | $33,885 |
| Female | 117 (33.4%) | $6,434 |
| Total | 350 (100.0%) | $33,243 |
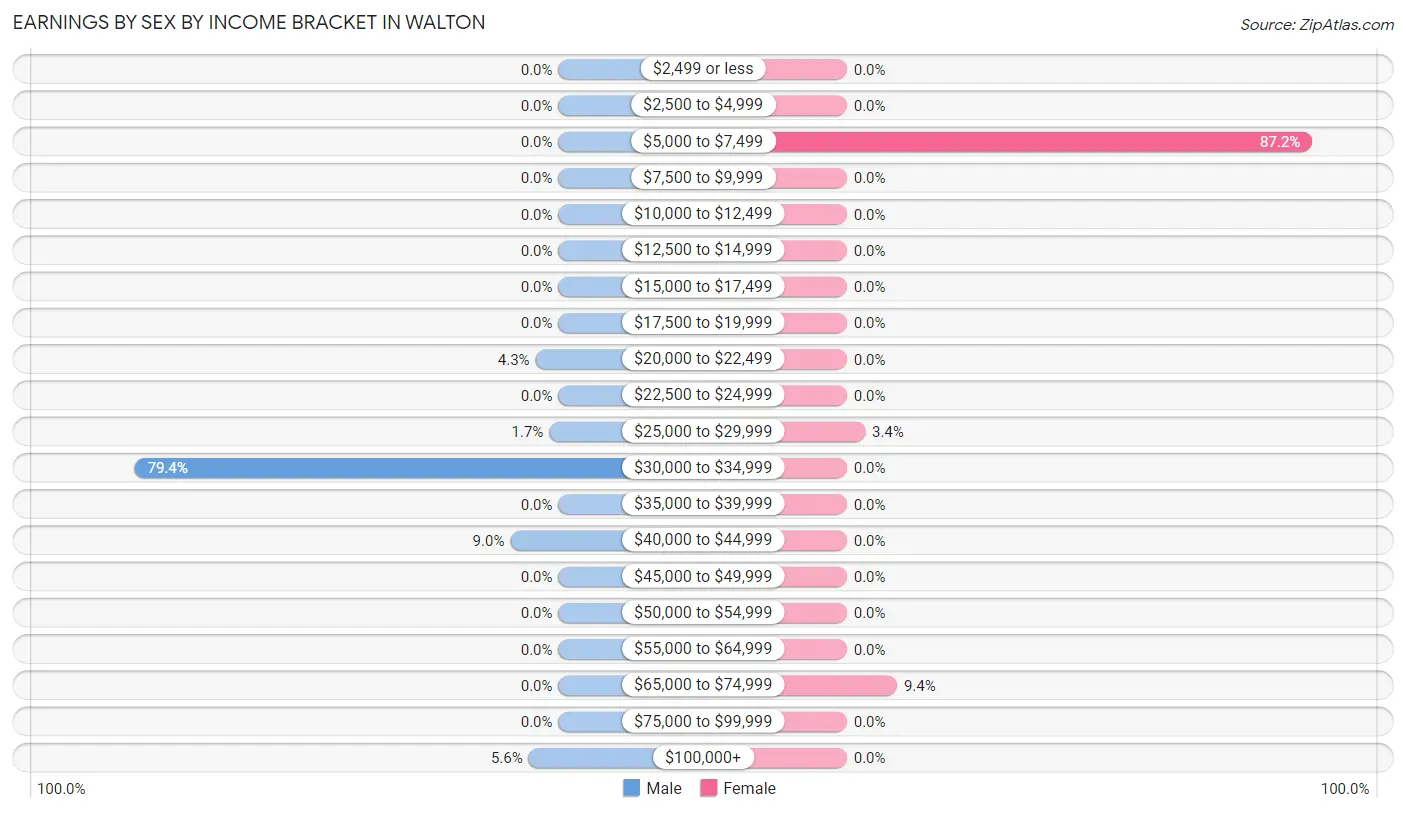
Earnings by Sex by Income Bracket in Walton
The most common earnings brackets in Walton are $30,000 to $34,999 for men (185 | 79.4%) and $5,000 to $7,499 for women (102 | 87.2%).
| Income | Male | Female |
| $2,499 or less | 0 (0.0%) | 0 (0.0%) |
| $2,500 to $4,999 | 0 (0.0%) | 0 (0.0%) |
| $5,000 to $7,499 | 0 (0.0%) | 102 (87.2%) |
| $7,500 to $9,999 | 0 (0.0%) | 0 (0.0%) |
| $10,000 to $12,499 | 0 (0.0%) | 0 (0.0%) |
| $12,500 to $14,999 | 0 (0.0%) | 0 (0.0%) |
| $15,000 to $17,499 | 0 (0.0%) | 0 (0.0%) |
| $17,500 to $19,999 | 0 (0.0%) | 0 (0.0%) |
| $20,000 to $22,499 | 10 (4.3%) | 0 (0.0%) |
| $22,500 to $24,999 | 0 (0.0%) | 0 (0.0%) |
| $25,000 to $29,999 | 4 (1.7%) | 4 (3.4%) |
| $30,000 to $34,999 | 185 (79.4%) | 0 (0.0%) |
| $35,000 to $39,999 | 0 (0.0%) | 0 (0.0%) |
| $40,000 to $44,999 | 21 (9.0%) | 0 (0.0%) |
| $45,000 to $49,999 | 0 (0.0%) | 0 (0.0%) |
| $50,000 to $54,999 | 0 (0.0%) | 0 (0.0%) |
| $55,000 to $64,999 | 0 (0.0%) | 0 (0.0%) |
| $65,000 to $74,999 | 0 (0.0%) | 11 (9.4%) |
| $75,000 to $99,999 | 0 (0.0%) | 0 (0.0%) |
| $100,000+ | 13 (5.6%) | 0 (0.0%) |
| Total | 233 (100.0%) | 117 (100.0%) |
Earnings by Sex by Educational Attainment in Walton
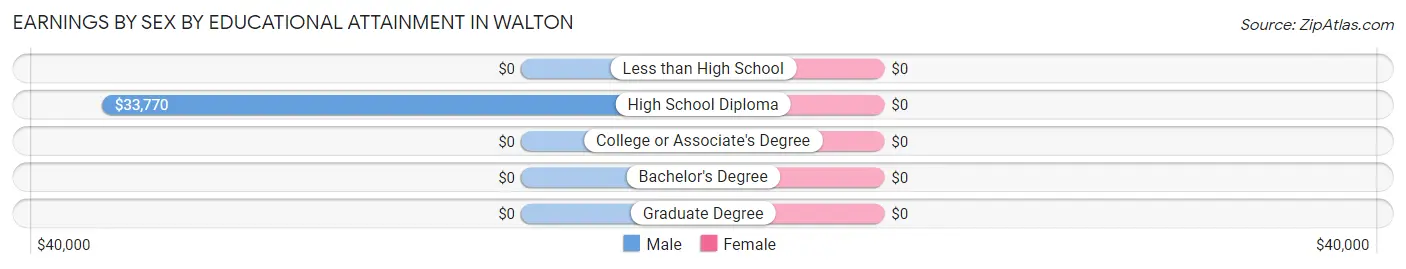
| Educational Attainment | Male Income | Female Income |
| Less than High School | - | - |
| High School Diploma | $33,770 | $0 |
| College or Associate's Degree | - | - |
| Bachelor's Degree | - | - |
| Graduate Degree | - | - |
| Total | $33,885 | $6,434 |
Family Income in Walton
Family Income Brackets in Walton
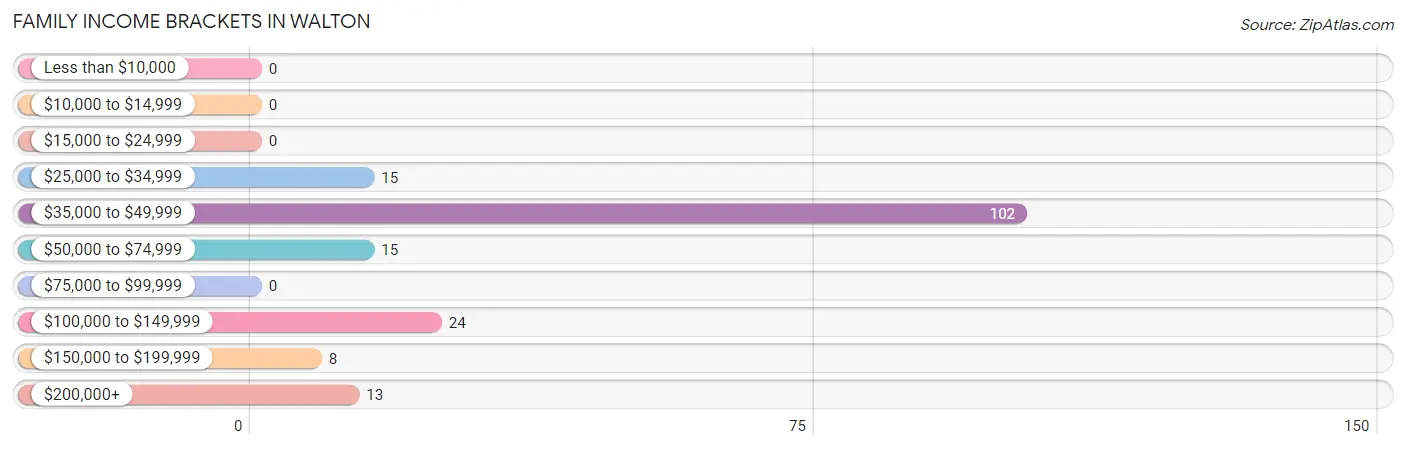
According to the Walton family income data, there are 102 families falling into the $35,000 to $49,999 income range, which is the most common income bracket and makes up 57.6% of all families.
| Income Bracket | # Families | % Families |
| Less than $10,000 | 0 | 0.0% |
| $10,000 to $14,999 | 0 | 0.0% |
| $15,000 to $24,999 | 0 | 0.0% |
| $25,000 to $34,999 | 15 | 8.5% |
| $35,000 to $49,999 | 102 | 57.6% |
| $50,000 to $74,999 | 15 | 8.5% |
| $75,000 to $99,999 | 0 | 0.0% |
| $100,000 to $149,999 | 24 | 13.6% |
| $150,000 to $199,999 | 8 | 4.5% |
| $200,000+ | 13 | 7.3% |
Family Income by Famaliy Size in Walton
| Income Bracket | # Families | Median Income |
| 2-Person Families | 177 (100.0%) | $0 |
| 3-Person Families | 0 (0.0%) | $0 |
| 4-Person Families | 0 (0.0%) | $0 |
| 5-Person Families | 0 (0.0%) | $0 |
| 6-Person Families | 0 (0.0%) | $0 |
| 7+ Person Families | 0 (0.0%) | $0 |
| Total | 177 (100.0%) | $0 |
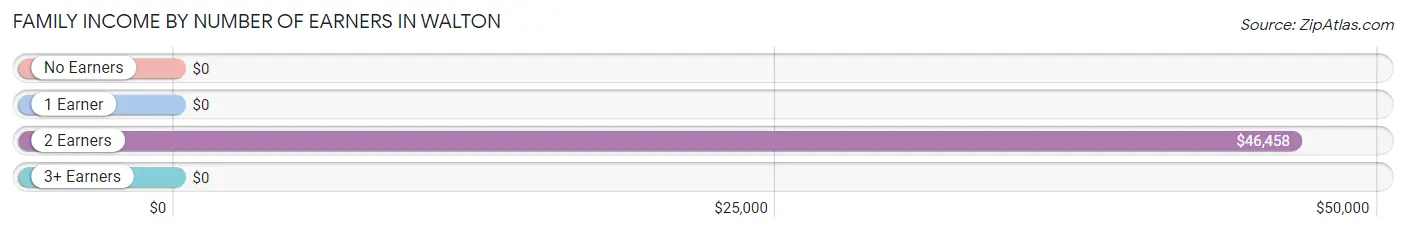
Family Income by Number of Earners in Walton
| Number of Earners | # Families | Median Income |
| No Earners | 26 (14.7%) | $0 |
| 1 Earner | 32 (18.1%) | $0 |
| 2 Earners | 119 (67.2%) | $46,458 |
| 3+ Earners | 0 (0.0%) | $0 |
| Total | 177 (100.0%) | $0 |
Household Income in Walton
Household Income Brackets in Walton
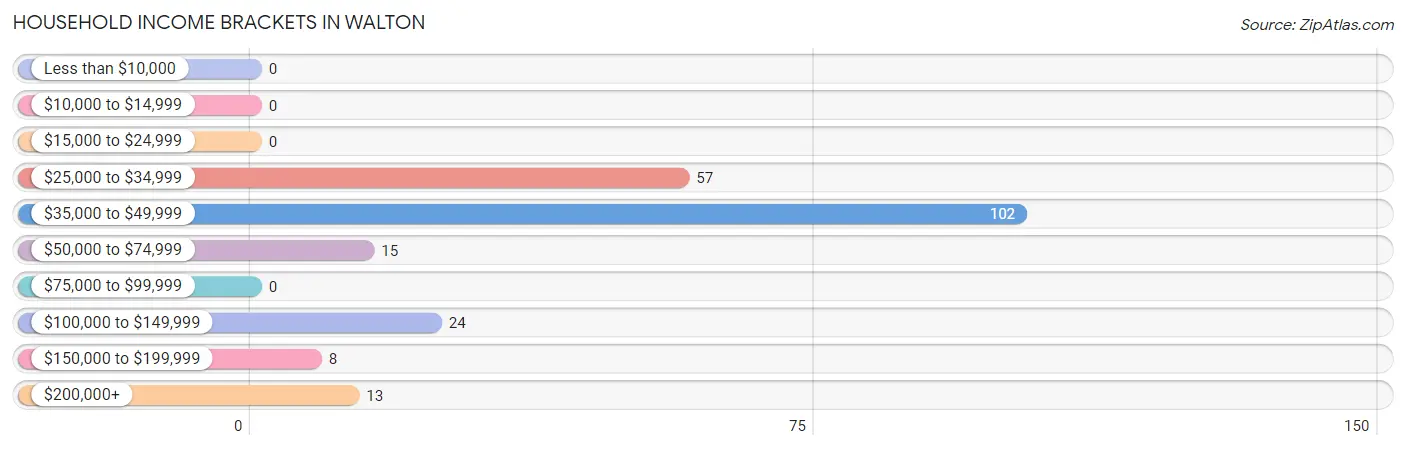
With 102 households falling in the category, the $35,000 to $49,999 income range is the most frequent in Walton, accounting for 46.6% of all households.
| Income Bracket | # Households | % Households |
| Less than $10,000 | 0 | 0.0% |
| $10,000 to $14,999 | 0 | 0.0% |
| $15,000 to $24,999 | 0 | 0.0% |
| $25,000 to $34,999 | 57 | 26.0% |
| $35,000 to $49,999 | 102 | 46.6% |
| $50,000 to $74,999 | 15 | 6.8% |
| $75,000 to $99,999 | 0 | 0.0% |
| $100,000 to $149,999 | 24 | 11.0% |
| $150,000 to $199,999 | 8 | 3.7% |
| $200,000+ | 13 | 5.9% |
Household Income by Householder Age in Walton
The median household income in Walton is $46,287, with the highest median household income of $46,483 found in the 45 to 64 years age bracket for the primary householder. A total of 121 households (55.2%) fall into this category.
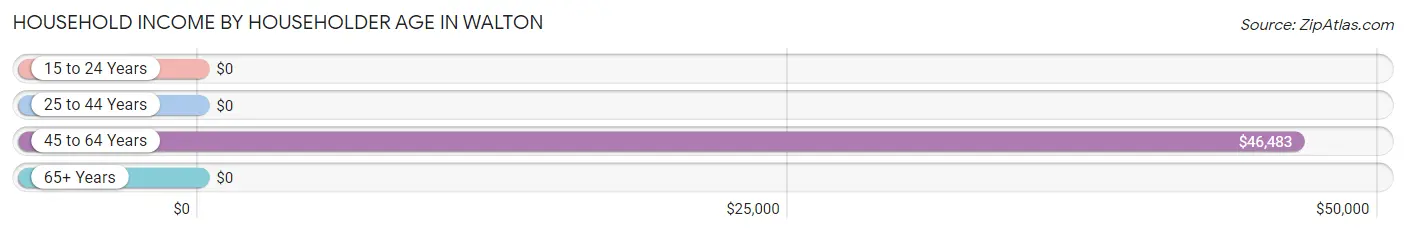
| Income Bracket | # Households | Median Income |
| 15 to 24 Years | 0 (0.0%) | $0 |
| 25 to 44 Years | 0 (0.0%) | $0 |
| 45 to 64 Years | 121 (55.2%) | $46,483 |
| 65+ Years | 98 (44.8%) | $0 |
| Total | 219 (100.0%) | $46,287 |
Poverty in Walton
Income Below Poverty by Sex and Age in Walton
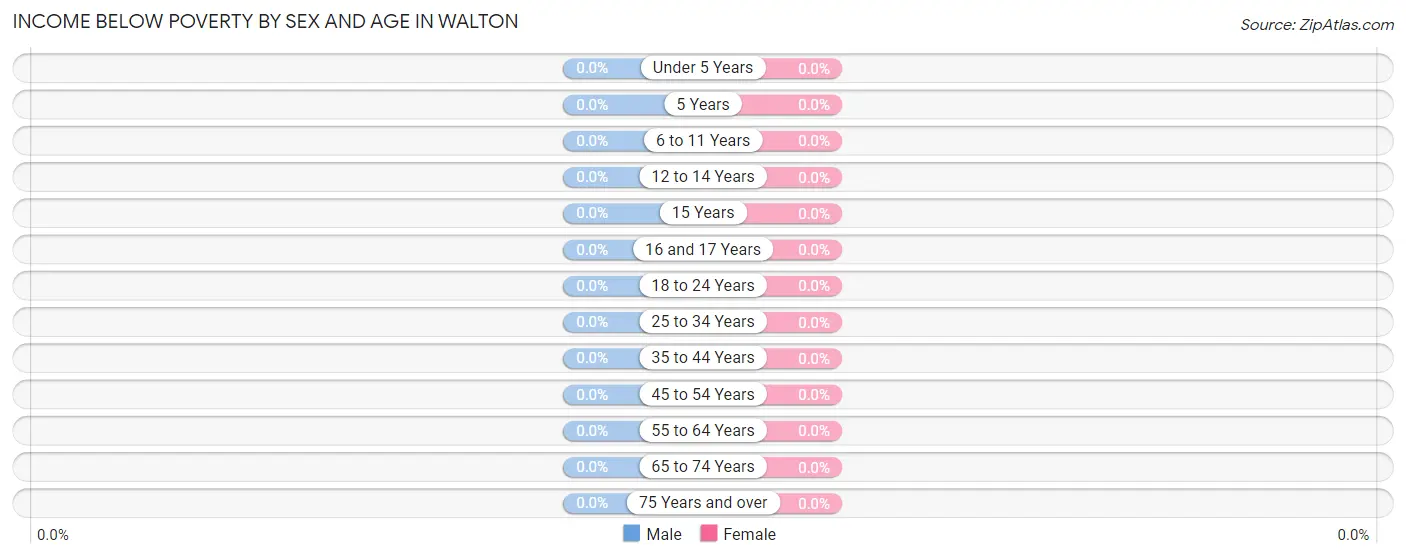
| Age Bracket | Male | Female |
| Under 5 Years | 0 (0.0%) | 0 (0.0%) |
| 5 Years | 0 (0.0%) | 0 (0.0%) |
| 6 to 11 Years | 0 (0.0%) | 0 (0.0%) |
| 12 to 14 Years | 0 (0.0%) | 0 (0.0%) |
| 15 Years | 0 (0.0%) | 0 (0.0%) |
| 16 and 17 Years | 0 (0.0%) | 0 (0.0%) |
| 18 to 24 Years | 0 (0.0%) | 0 (0.0%) |
| 25 to 34 Years | 0 (0.0%) | 0 (0.0%) |
| 35 to 44 Years | 0 (0.0%) | 0 (0.0%) |
| 45 to 54 Years | 0 (0.0%) | 0 (0.0%) |
| 55 to 64 Years | 0 (0.0%) | 0 (0.0%) |
| 65 to 74 Years | 0 (0.0%) | 0 (0.0%) |
| 75 Years and over | 0 (0.0%) | 0 (0.0%) |
| Total | 0 (0.0%) | 0 (0.0%) |
Income Above Poverty by Sex and Age in Walton
According to the poverty statistics in Walton, males aged 55 to 64 years and females aged 55 to 64 years are the age groups that are most secure financially, with 100.0% of males and 100.0% of females in these age groups living above the poverty line.
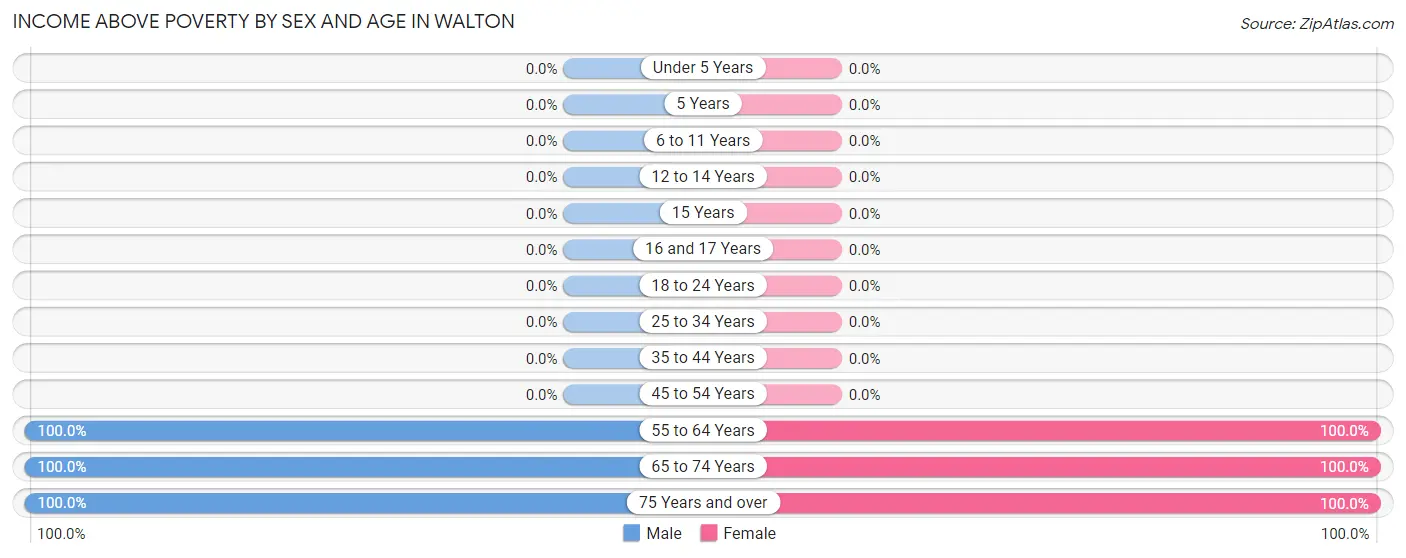
| Age Bracket | Male | Female |
| Under 5 Years | 0 (0.0%) | 0 (0.0%) |
| 5 Years | 0 (0.0%) | 0 (0.0%) |
| 6 to 11 Years | 0 (0.0%) | 0 (0.0%) |
| 12 to 14 Years | 0 (0.0%) | 0 (0.0%) |
| 15 Years | 0 (0.0%) | 0 (0.0%) |
| 16 and 17 Years | 0 (0.0%) | 0 (0.0%) |
| 18 to 24 Years | 0 (0.0%) | 0 (0.0%) |
| 25 to 34 Years | 0 (0.0%) | 0 (0.0%) |
| 35 to 44 Years | 0 (0.0%) | 0 (0.0%) |
| 45 to 54 Years | 0 (0.0%) | 0 (0.0%) |
| 55 to 64 Years | 202 (100.0%) | 132 (100.0%) |
| 65 to 74 Years | 21 (100.0%) | 28 (100.0%) |
| 75 Years and over | 23 (100.0%) | 68 (100.0%) |
| Total | 246 (100.0%) | 228 (100.0%) |
Income Below Poverty Among Married-Couple Families in Walton
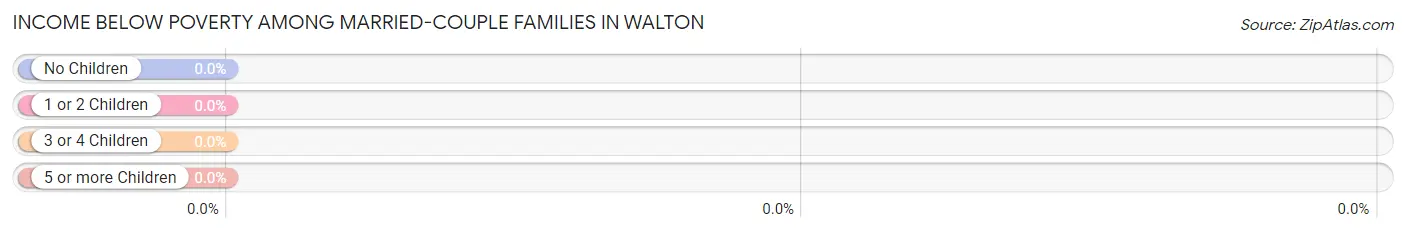
| Children | Above Poverty | Below Poverty |
| No Children | 162 (100.0%) | 0 (0.0%) |
| 1 or 2 Children | 0 (0.0%) | 0 (0.0%) |
| 3 or 4 Children | 0 (0.0%) | 0 (0.0%) |
| 5 or more Children | 0 (0.0%) | 0 (0.0%) |
| Total | 162 (100.0%) | 0 (0.0%) |
Income Below Poverty Among Single-Parent Households in Walton
| Children | Single Father | Single Mother |
| No Children | 0 (0.0%) | 0 (0.0%) |
| 1 or 2 Children | 0 (0.0%) | 0 (0.0%) |
| 3 or 4 Children | 0 (0.0%) | 0 (0.0%) |
| 5 or more Children | 0 (0.0%) | 0 (0.0%) |
| Total | 0 (0.0%) | 0 (0.0%) |
Income Below Poverty Among Married-Couple vs Single-Parent Households in Walton
| Children | Married-Couple Families | Single-Parent Households |
| No Children | 0 (0.0%) | 0 (0.0%) |
| 1 or 2 Children | 0 (0.0%) | 0 (0.0%) |
| 3 or 4 Children | 0 (0.0%) | 0 (0.0%) |
| 5 or more Children | 0 (0.0%) | 0 (0.0%) |
| Total | 0 (0.0%) | 0 (0.0%) |
Race in Walton
The most populous races in Walton are White / Caucasian (468 | 98.7%), and Black / African American (6 | 1.3%).
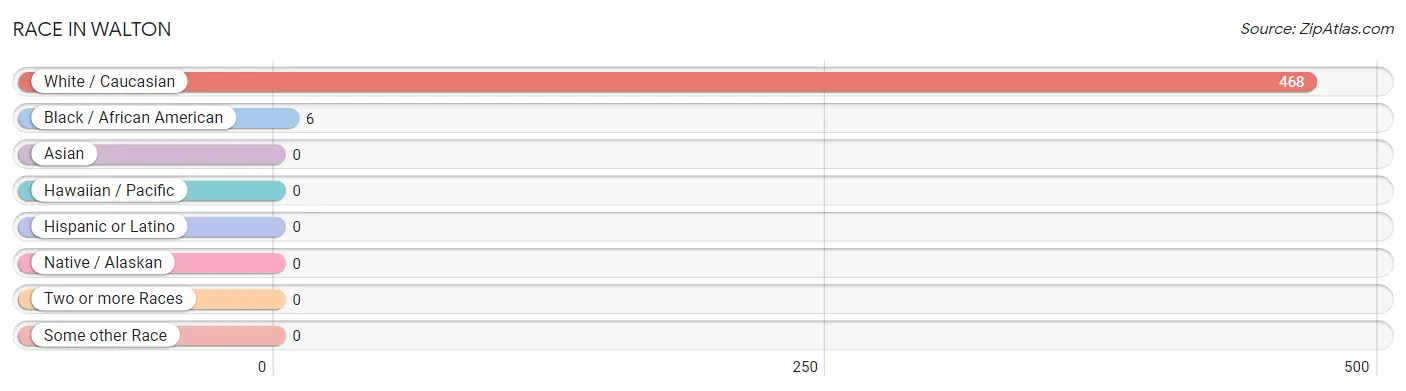
| Race | # Population | % Population |
| Asian | 0 | 0.0% |
| Black / African American | 6 | 1.3% |
| Hawaiian / Pacific | 0 | 0.0% |
| Hispanic or Latino | 0 | 0.0% |
| Native / Alaskan | 0 | 0.0% |
| White / Caucasian | 468 | 98.7% |
| Two or more Races | 0 | 0.0% |
| Some other Race | 0 | 0.0% |
| Total | 474 | 100.0% |
Ancestry in Walton
The most populous ancestries reported in Walton are English (68 | 14.3%), European (42 | 8.9%), German (39 | 8.2%), Czech (23 | 4.9%), and Irish (23 | 4.9%), together accounting for 41.1% of all Walton residents.
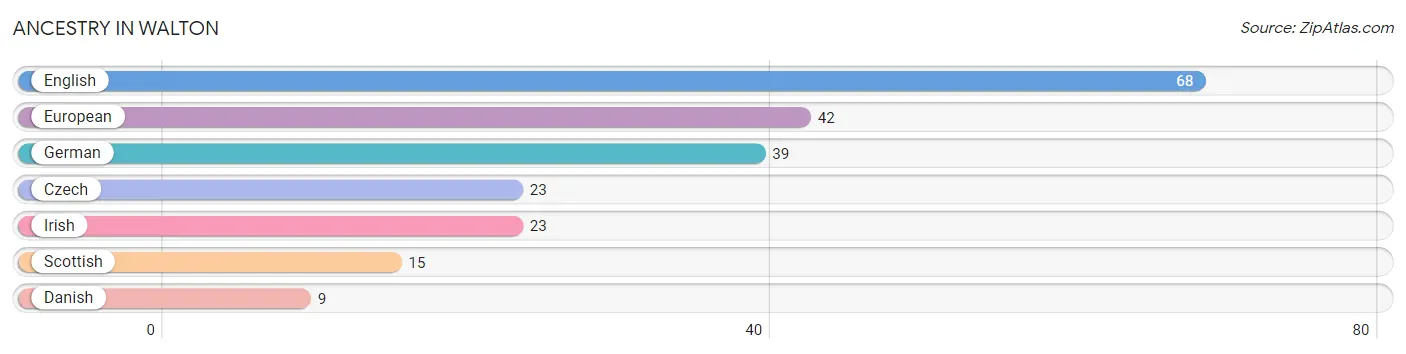
| Ancestry | # Population | % Population |
| Czech | 23 | 4.9% |
| Danish | 9 | 1.9% |
| English | 68 | 14.3% |
| European | 42 | 8.9% |
| German | 39 | 8.2% |
| Irish | 23 | 4.9% |
| Scottish | 15 | 3.2% | View All 7 Rows |
Immigrants in Walton

| Immigration Origin | # Population | % Population | View All 0 Rows |
Sex and Age in Walton
Sex and Age in Walton
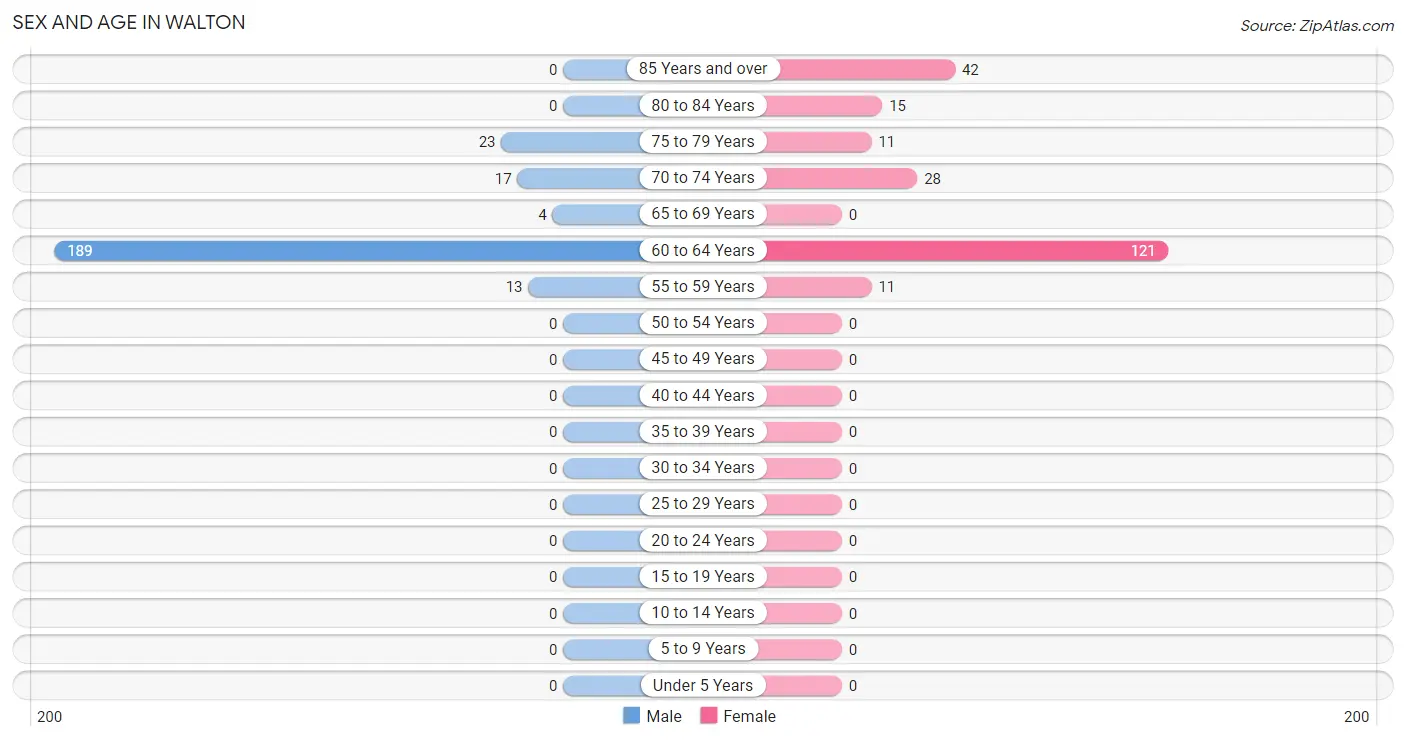
The most populous age groups in Walton are 60 to 64 Years (189 | 76.8%) for men and 60 to 64 Years (121 | 53.1%) for women.
| Age Bracket | Male | Female |
| Under 5 Years | 0 (0.0%) | 0 (0.0%) |
| 5 to 9 Years | 0 (0.0%) | 0 (0.0%) |
| 10 to 14 Years | 0 (0.0%) | 0 (0.0%) |
| 15 to 19 Years | 0 (0.0%) | 0 (0.0%) |
| 20 to 24 Years | 0 (0.0%) | 0 (0.0%) |
| 25 to 29 Years | 0 (0.0%) | 0 (0.0%) |
| 30 to 34 Years | 0 (0.0%) | 0 (0.0%) |
| 35 to 39 Years | 0 (0.0%) | 0 (0.0%) |
| 40 to 44 Years | 0 (0.0%) | 0 (0.0%) |
| 45 to 49 Years | 0 (0.0%) | 0 (0.0%) |
| 50 to 54 Years | 0 (0.0%) | 0 (0.0%) |
| 55 to 59 Years | 13 (5.3%) | 11 (4.8%) |
| 60 to 64 Years | 189 (76.8%) | 121 (53.1%) |
| 65 to 69 Years | 4 (1.6%) | 0 (0.0%) |
| 70 to 74 Years | 17 (6.9%) | 28 (12.3%) |
| 75 to 79 Years | 23 (9.3%) | 11 (4.8%) |
| 80 to 84 Years | 0 (0.0%) | 15 (6.6%) |
| 85 Years and over | 0 (0.0%) | 42 (18.4%) |
| Total | 246 (100.0%) | 228 (100.0%) |
Families and Households in Walton
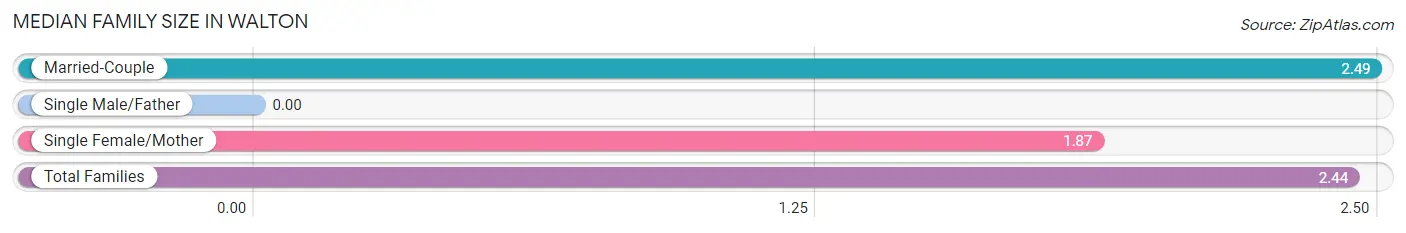
Median Family Size in Walton
| Family Type | # Families | Family Size |
| Married-Couple | 162 (91.5%) | 2.49 |
| Single Male/Father | 0 (0.0%) | - |
| Single Female/Mother | 15 (8.5%) | 1.87 |
| Total Families | 177 (100.0%) | 2.44 |
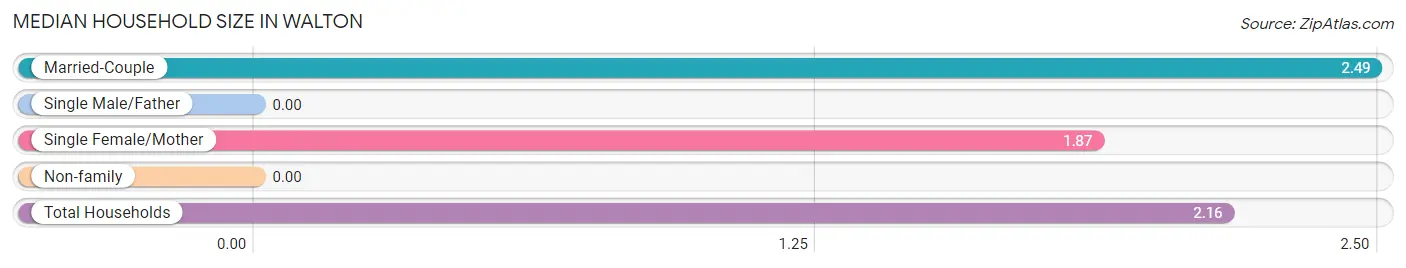
Median Household Size in Walton
| Household Type | # Households | Household Size |
| Married-Couple | 162 (74.0%) | 2.49 |
| Single Male/Father | 0 (0.0%) | - |
| Single Female/Mother | 15 (6.9%) | 1.87 |
| Non-family | 42 (19.2%) | - |
| Total Households | 219 (100.0%) | 2.16 |
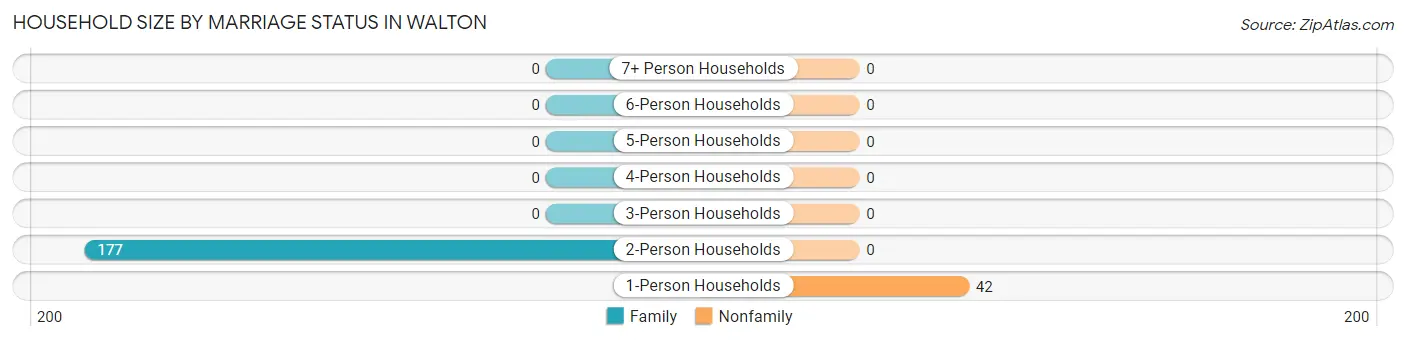
Household Size by Marriage Status in Walton
Out of a total of 219 households in Walton, 177 (80.8%) are family households, while 42 (19.2%) are nonfamily households. The most numerous type of family households are 2-person households, comprising 177, and the most common type of nonfamily households are 1-person households, comprising 42.
| Household Size | Family Households | Nonfamily Households |
| 1-Person Households | - | 42 (19.2%) |
| 2-Person Households | 177 (80.8%) | 0 (0.0%) |
| 3-Person Households | 0 (0.0%) | 0 (0.0%) |
| 4-Person Households | 0 (0.0%) | 0 (0.0%) |
| 5-Person Households | 0 (0.0%) | 0 (0.0%) |
| 6-Person Households | 0 (0.0%) | 0 (0.0%) |
| 7+ Person Households | 0 (0.0%) | 0 (0.0%) |
| Total | 177 (80.8%) | 42 (19.2%) |
Female Fertility in Walton
Fertility by Age in Walton
| Age Bracket | Women with Births | Births / 1,000 Women |
| 15 to 19 years | 0 (0.0%) | 0.0 |
| 20 to 34 years | 0 (0.0%) | 0.0 |
| 35 to 50 years | 0 (0.0%) | 0.0 |
| Total | 0 (0.0%) | 0.0 |
Fertility by Age by Marriage Status in Walton
| Age Bracket | Married | Unmarried |
| 15 to 19 years | 0 (0.0%) | 0 (0.0%) |
| 20 to 34 years | 0 (0.0%) | 0 (0.0%) |
| 35 to 50 years | 0 (0.0%) | 0 (0.0%) |
| Total | 0 (0.0%) | 0 (0.0%) |
Fertility by Education in Walton
| Educational Attainment | Women with Births | Births / 1,000 Women |
| Less than High School | 0 (0.0%) | 0.0 |
| High School Diploma | 0 (0.0%) | 0.0 |
| College or Associate's Degree | 0 (0.0%) | 0.0 |
| Bachelor's Degree | 0 (0.0%) | 0.0 |
| Graduate Degree | 0 (0.0%) | 0.0 |
| Total | 0 (0.0%) | 0.0 |
Fertility by Education by Marriage Status in Walton
| Educational Attainment | Married | Unmarried |
| Less than High School | 0 (0.0%) | 0 (0.0%) |
| High School Diploma | 0 (0.0%) | 0 (0.0%) |
| College or Associate's Degree | 0 (0.0%) | 0 (0.0%) |
| Bachelor's Degree | 0 (0.0%) | 0 (0.0%) |
| Graduate Degree | 0 (0.0%) | 0 (0.0%) |
| Total | 0 (0.0%) | 0 (0.0%) |
Employment Characteristics in Walton
Employment by Class of Employer in Walton
Among the 340 employed individuals in Walton, private company employees (227 | 66.8%), local government employees (102 | 30.0%), and not-for-profit organizations (11 | 3.2%) make up the most common classes of employment.
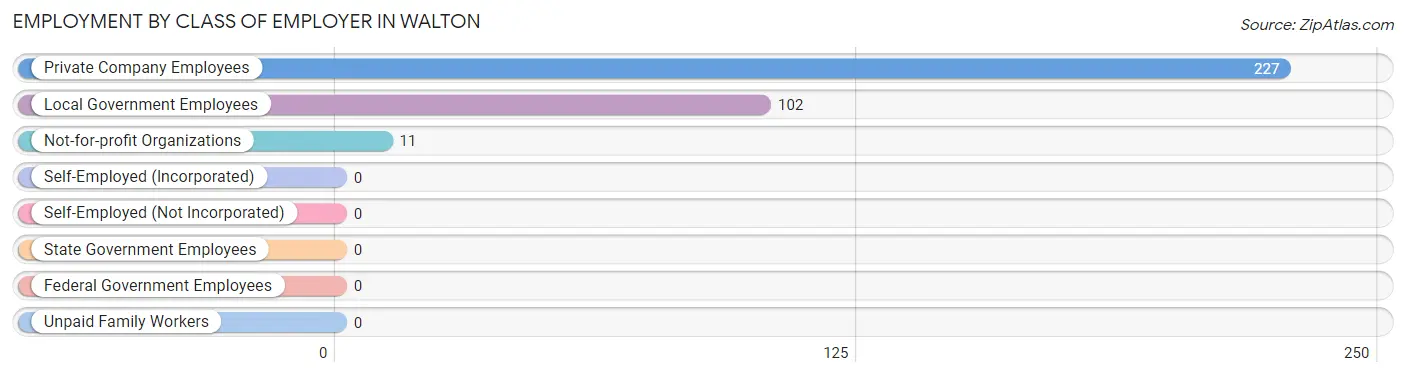
| Employer Class | # Employees | % Employees |
| Private Company Employees | 227 | 66.8% |
| Self-Employed (Incorporated) | 0 | 0.0% |
| Self-Employed (Not Incorporated) | 0 | 0.0% |
| Not-for-profit Organizations | 11 | 3.2% |
| Local Government Employees | 102 | 30.0% |
| State Government Employees | 0 | 0.0% |
| Federal Government Employees | 0 | 0.0% |
| Unpaid Family Workers | 0 | 0.0% |
| Total | 340 | 100.0% |
Employment Status by Age in Walton
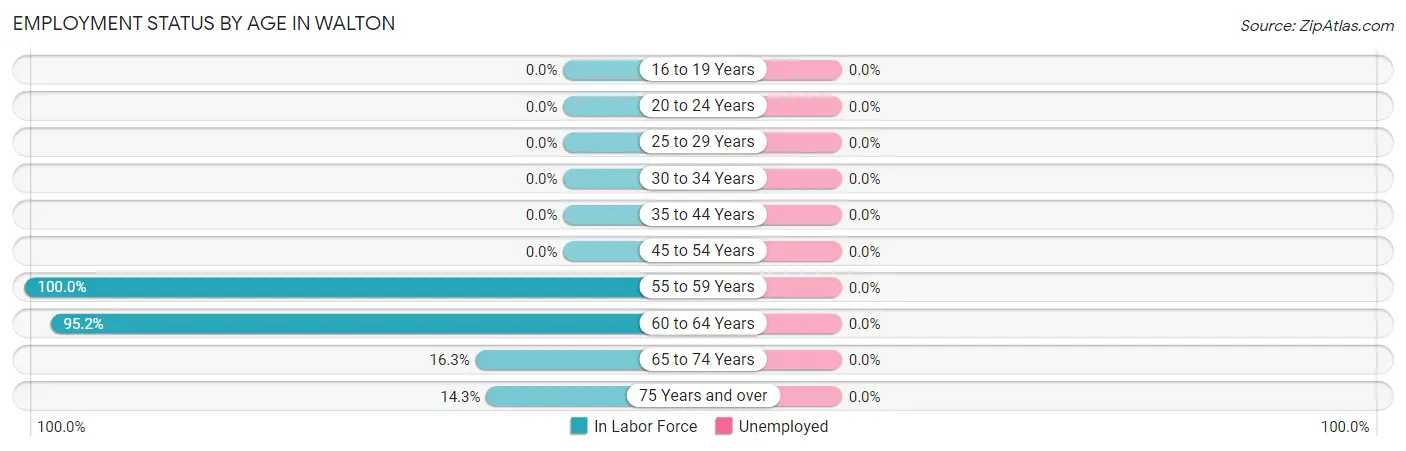
| Age Bracket | In Labor Force | Unemployed |
| 16 to 19 Years | 0 (0.0%) | 0 (0.0%) |
| 20 to 24 Years | 0 (0.0%) | 0 (0.0%) |
| 25 to 29 Years | 0 (0.0%) | 0 (0.0%) |
| 30 to 34 Years | 0 (0.0%) | 0 (0.0%) |
| 35 to 44 Years | 0 (0.0%) | 0 (0.0%) |
| 45 to 54 Years | 0 (0.0%) | 0 (0.0%) |
| 55 to 59 Years | 24 (100.0%) | 0 (0.0%) |
| 60 to 64 Years | 295 (95.2%) | 0 (0.0%) |
| 65 to 74 Years | 8 (16.3%) | 0 (0.0%) |
| 75 Years and over | 13 (14.3%) | 0 (0.0%) |
| Total | 340 (71.7%) | 0 (0.0%) |
Employment Status by Educational Attainment in Walton
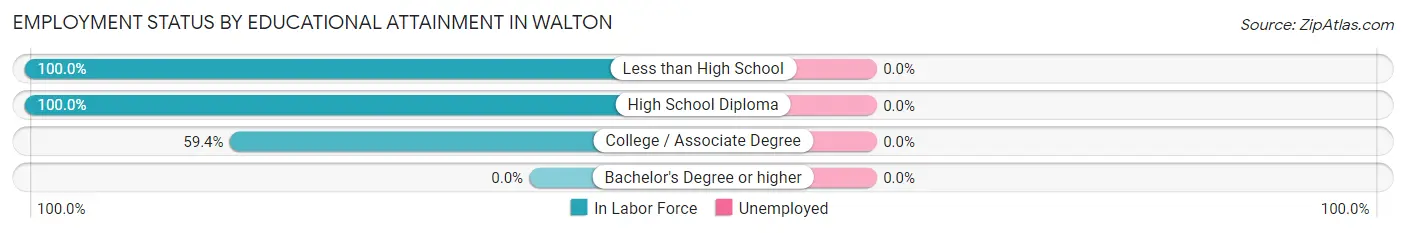
| Educational Attainment | In Labor Force | Unemployed |
| Less than High School | 102 (100.0%) | 0 (0.0%) |
| High School Diploma | 198 (100.0%) | 0 (0.0%) |
| College / Associate Degree | 19 (59.4%) | 0 (0.0%) |
| Bachelor's Degree or higher | 0 (0.0%) | 0 (0.0%) |
| Total | 319 (95.5%) | 0 (0.0%) |
Employment Occupations by Sex in Walton
Management, Business, Science and Arts Occupations
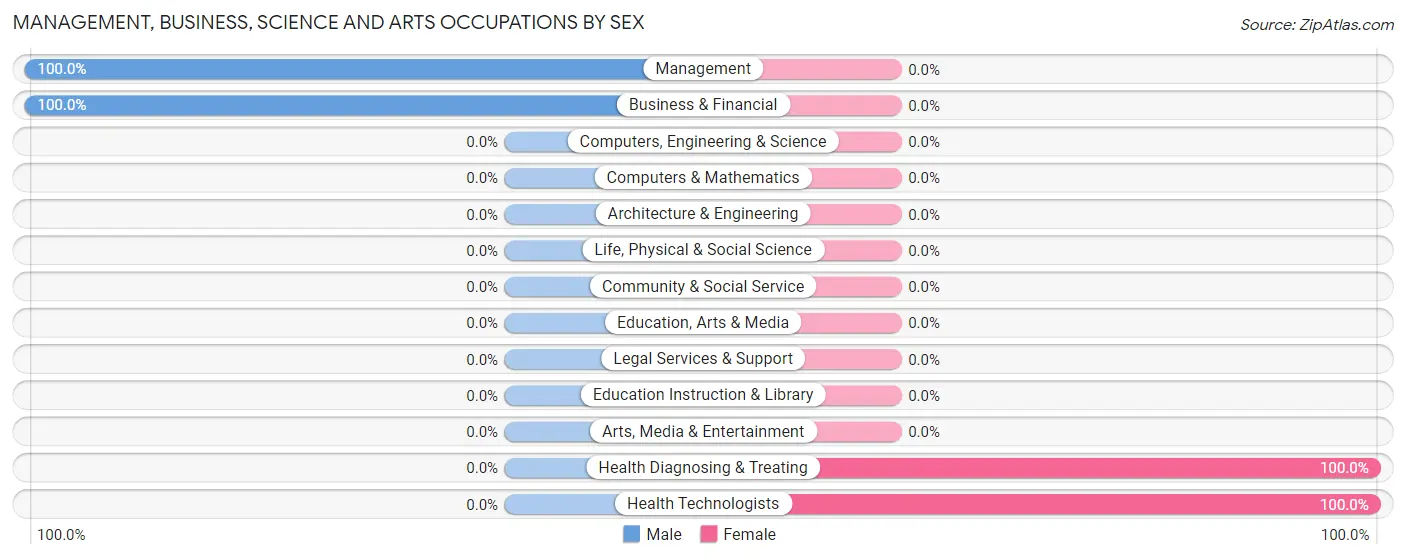
The most common Management, Business, Science and Arts occupations in Walton are Management (13 | 3.8%), Health Diagnosing & Treating (11 | 3.2%), Health Technologists (11 | 3.2%), and Business & Financial (8 | 2.4%).
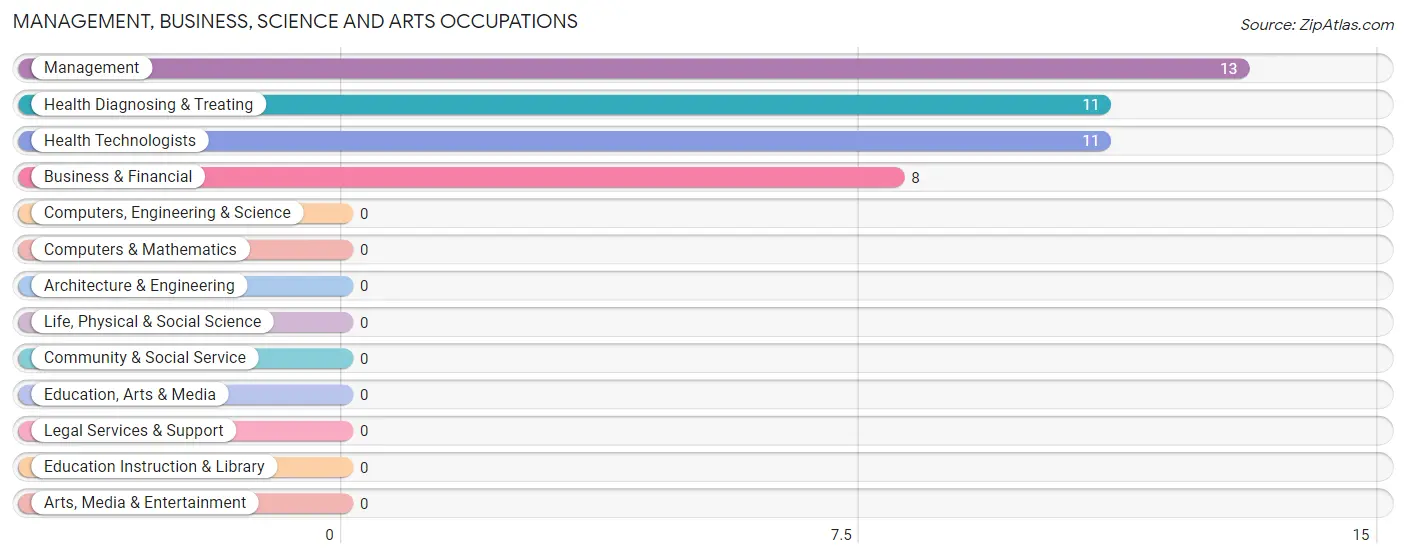
Management, Business, Science and Arts Occupations by Sex
Within the Management, Business, Science and Arts occupations in Walton, the most male-oriented occupations are Management (100.0%), and Business & Financial (100.0%), while the most female-oriented occupations are Health Diagnosing & Treating (100.0%), and Health Technologists (100.0%).
| Occupation | Male | Female |
| Management | 13 (100.0%) | 0 (0.0%) |
| Business & Financial | 8 (100.0%) | 0 (0.0%) |
| Computers, Engineering & Science | 0 (0.0%) | 0 (0.0%) |
| Computers & Mathematics | 0 (0.0%) | 0 (0.0%) |
| Architecture & Engineering | 0 (0.0%) | 0 (0.0%) |
| Life, Physical & Social Science | 0 (0.0%) | 0 (0.0%) |
| Community & Social Service | 0 (0.0%) | 0 (0.0%) |
| Education, Arts & Media | 0 (0.0%) | 0 (0.0%) |
| Legal Services & Support | 0 (0.0%) | 0 (0.0%) |
| Education Instruction & Library | 0 (0.0%) | 0 (0.0%) |
| Arts, Media & Entertainment | 0 (0.0%) | 0 (0.0%) |
| Health Diagnosing & Treating | 0 (0.0%) | 11 (100.0%) |
| Health Technologists | 0 (0.0%) | 11 (100.0%) |
| Total (Category) | 21 (65.6%) | 11 (34.4%) |
| Total (Overall) | 223 (65.6%) | 117 (34.4%) |
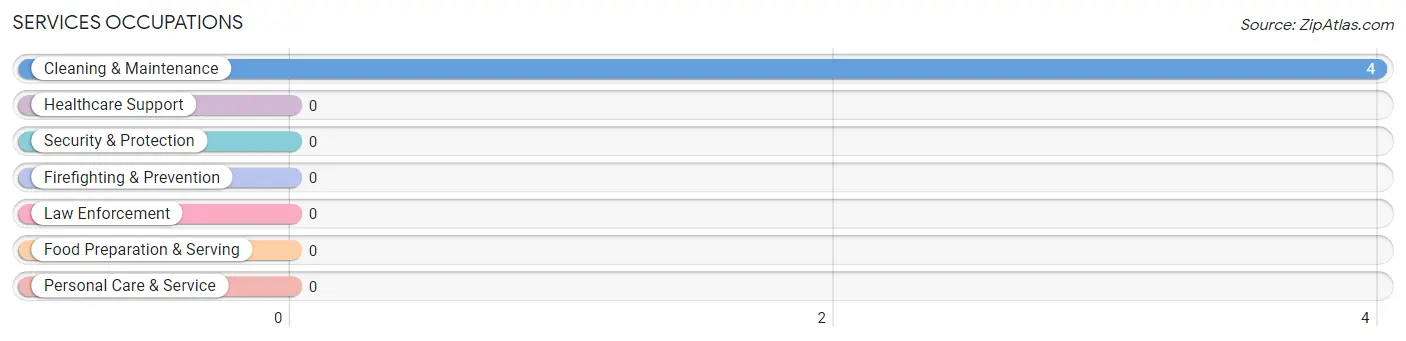
Services Occupations
The most common Services occupations in Walton are , and Cleaning & Maintenance (4 | 1.2%).
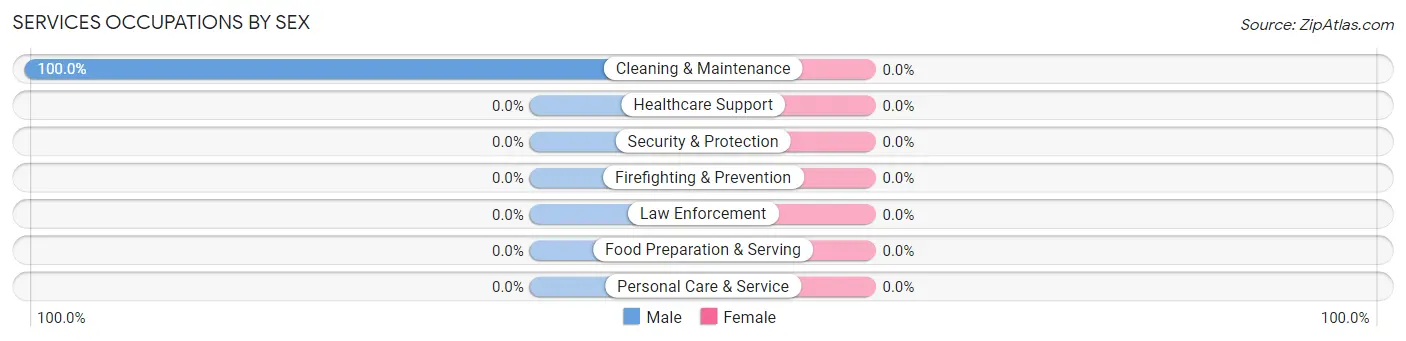
Services Occupations by Sex
| Occupation | Male | Female |
| Healthcare Support | 0 (0.0%) | 0 (0.0%) |
| Security & Protection | 0 (0.0%) | 0 (0.0%) |
| Firefighting & Prevention | 0 (0.0%) | 0 (0.0%) |
| Law Enforcement | 0 (0.0%) | 0 (0.0%) |
| Food Preparation & Serving | 0 (0.0%) | 0 (0.0%) |
| Cleaning & Maintenance | 4 (100.0%) | 0 (0.0%) |
| Personal Care & Service | 0 (0.0%) | 0 (0.0%) |
| Total (Category) | 4 (100.0%) | 0 (0.0%) |
| Total (Overall) | 223 (65.6%) | 117 (34.4%) |
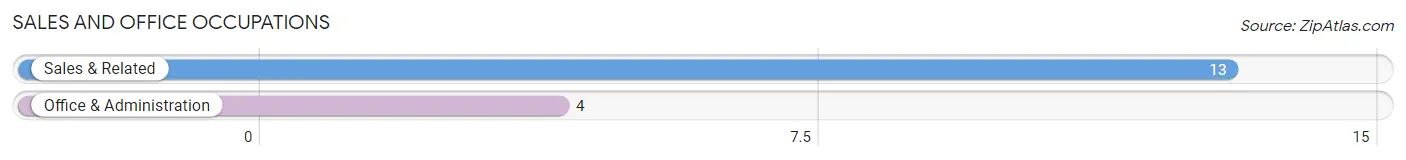
Sales and Office Occupations
The most common Sales and Office occupations in Walton are Sales & Related (13 | 3.8%), and Office & Administration (4 | 1.2%).
Sales and Office Occupations by Sex

| Occupation | Male | Female |
| Sales & Related | 13 (100.0%) | 0 (0.0%) |
| Office & Administration | 0 (0.0%) | 4 (100.0%) |
| Total (Category) | 13 (76.5%) | 4 (23.5%) |
| Total (Overall) | 223 (65.6%) | 117 (34.4%) |
Natural Resources, Construction and Maintenance Occupations
Natural Resources, Construction and Maintenance Occupations by Sex
| Occupation | Male | Female |
| Farming, Fishing & Forestry | 0 (0.0%) | 0 (0.0%) |
| Construction & Extraction | 0 (0.0%) | 0 (0.0%) |
| Installation, Maintenance & Repair | 0 (0.0%) | 0 (0.0%) |
| Total (Category) | 0 (0.0%) | 0 (0.0%) |
| Total (Overall) | 223 (65.6%) | 117 (34.4%) |
Production, Transportation and Moving Occupations
The most common Production, Transportation and Moving occupations in Walton are , and Transportation (287 | 84.4%).
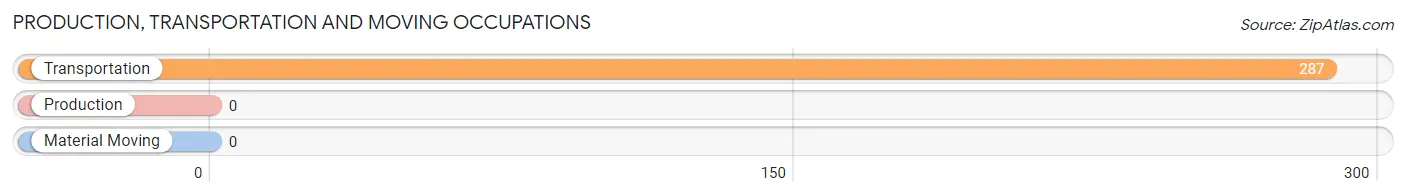
Production, Transportation and Moving Occupations by Sex
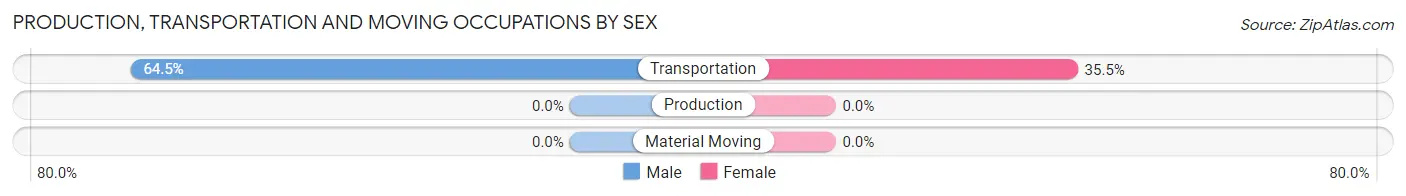
| Occupation | Male | Female |
| Production | 0 (0.0%) | 0 (0.0%) |
| Transportation | 185 (64.5%) | 102 (35.5%) |
| Material Moving | 0 (0.0%) | 0 (0.0%) |
| Total (Category) | 185 (64.5%) | 102 (35.5%) |
| Total (Overall) | 223 (65.6%) | 117 (34.4%) |
Employment Industries by Sex in Walton
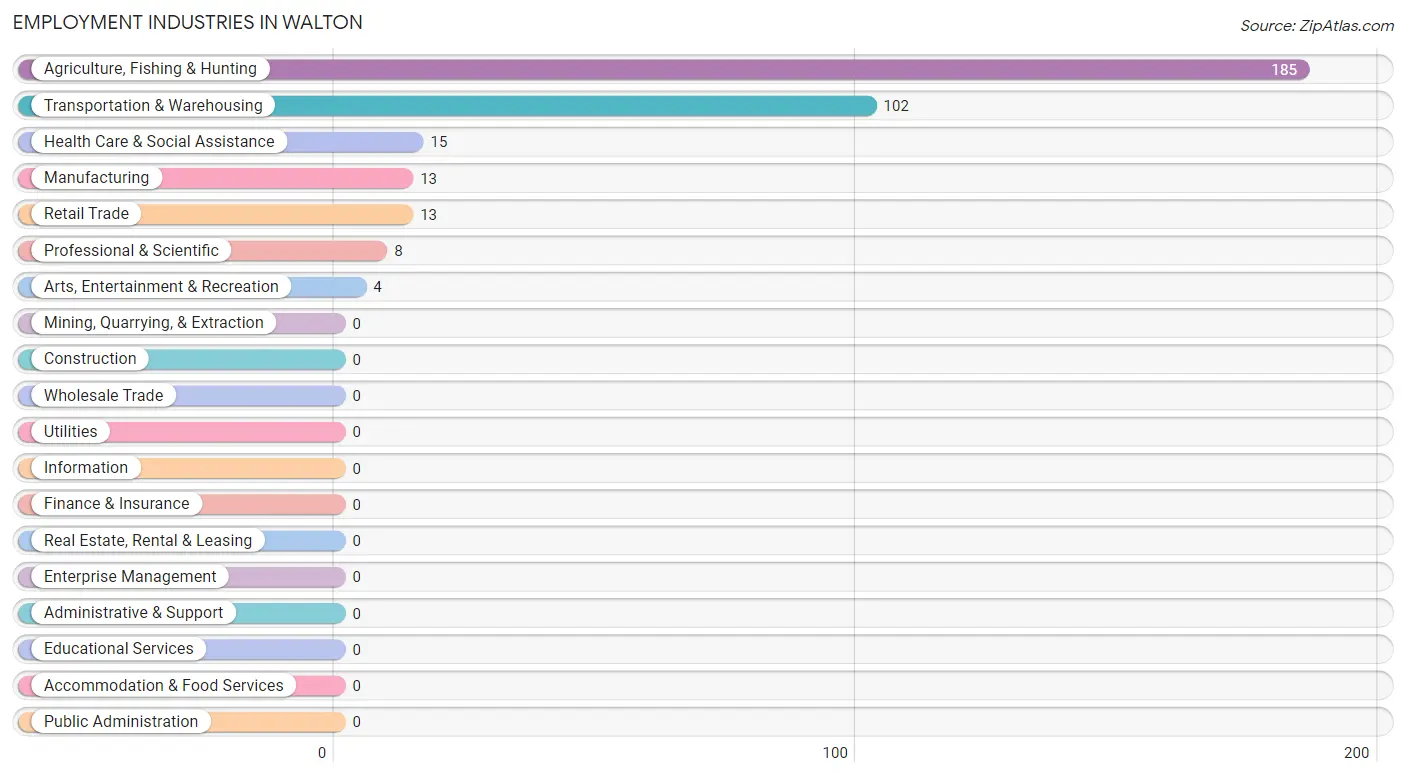
Employment Industries in Walton
The major employment industries in Walton include Agriculture, Fishing & Hunting (185 | 54.4%), Transportation & Warehousing (102 | 30.0%), Health Care & Social Assistance (15 | 4.4%), Manufacturing (13 | 3.8%), and Retail Trade (13 | 3.8%).
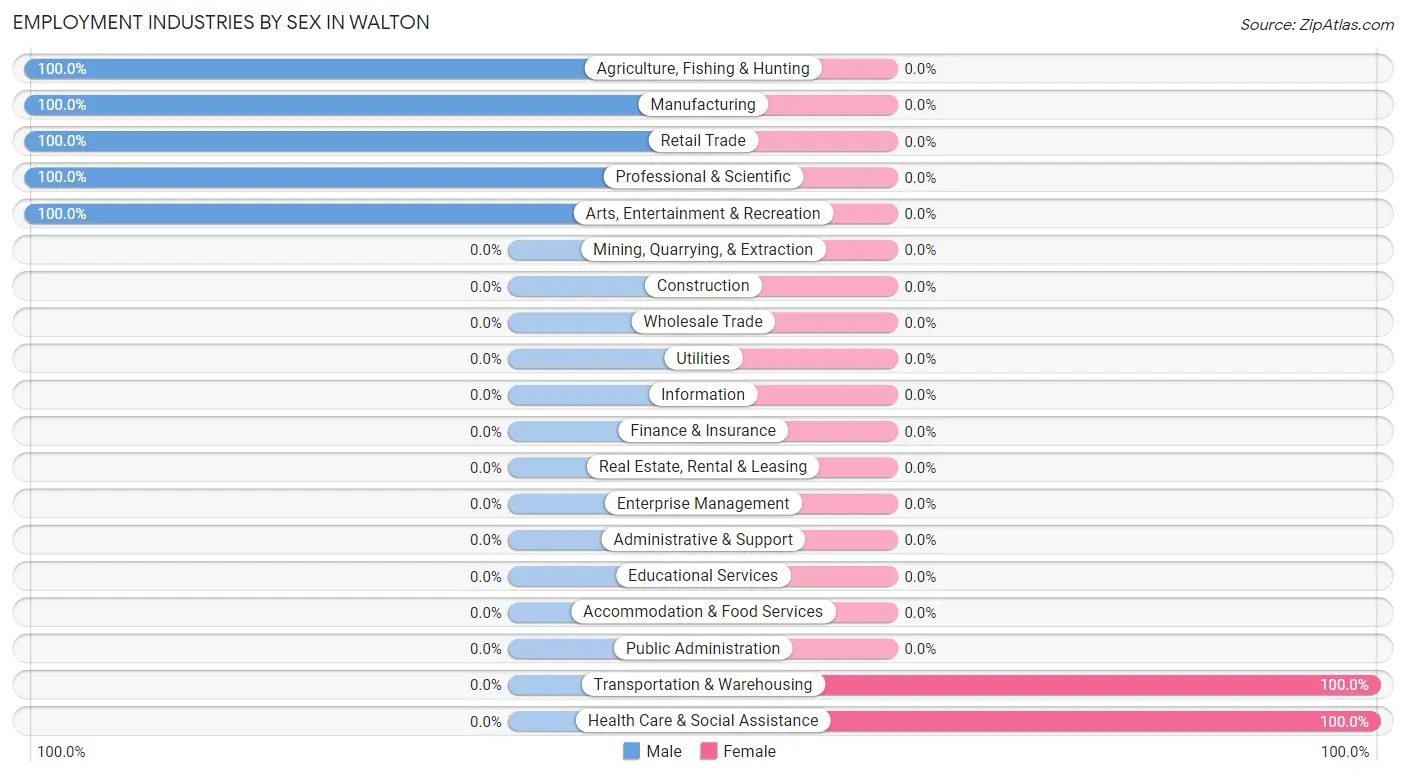
Employment Industries by Sex in Walton
The Walton industries that see more men than women are Agriculture, Fishing & Hunting (100.0%), Manufacturing (100.0%), and Retail Trade (100.0%), whereas the industries that tend to have a higher number of women are Transportation & Warehousing (100.0%), and Health Care & Social Assistance (100.0%).
| Industry | Male | Female |
| Agriculture, Fishing & Hunting | 185 (100.0%) | 0 (0.0%) |
| Mining, Quarrying, & Extraction | 0 (0.0%) | 0 (0.0%) |
| Construction | 0 (0.0%) | 0 (0.0%) |
| Manufacturing | 13 (100.0%) | 0 (0.0%) |
| Wholesale Trade | 0 (0.0%) | 0 (0.0%) |
| Retail Trade | 13 (100.0%) | 0 (0.0%) |
| Transportation & Warehousing | 0 (0.0%) | 102 (100.0%) |
| Utilities | 0 (0.0%) | 0 (0.0%) |
| Information | 0 (0.0%) | 0 (0.0%) |
| Finance & Insurance | 0 (0.0%) | 0 (0.0%) |
| Real Estate, Rental & Leasing | 0 (0.0%) | 0 (0.0%) |
| Professional & Scientific | 8 (100.0%) | 0 (0.0%) |
| Enterprise Management | 0 (0.0%) | 0 (0.0%) |
| Administrative & Support | 0 (0.0%) | 0 (0.0%) |
| Educational Services | 0 (0.0%) | 0 (0.0%) |
| Health Care & Social Assistance | 0 (0.0%) | 15 (100.0%) |
| Arts, Entertainment & Recreation | 4 (100.0%) | 0 (0.0%) |
| Accommodation & Food Services | 0 (0.0%) | 0 (0.0%) |
| Public Administration | 0 (0.0%) | 0 (0.0%) |
| Total | 223 (65.6%) | 117 (34.4%) |
Education in Walton
School Enrollment in Walton
| School Level | # Students | % Students |
| Nursery / Preschool | 0 | 0.0% |
| Kindergarten | 0 | 0.0% |
| Elementary School | 0 | 0.0% |
| Middle School | 0 | 0.0% |
| High School | 0 | 0.0% |
| College / Undergraduate | 0 | 0.0% |
| Graduate / Professional | 0 | 0.0% |
| Total | 0 | 0.0% |
School Enrollment by Age by Funding Source in Walton
| Age Bracket | Public School | Private School |
| 3 to 4 Year Olds | 0 (0.0%) | 0 (0.0%) |
| 5 to 9 Year Old | 0 (0.0%) | 0 (0.0%) |
| 10 to 14 Year Olds | 0 (0.0%) | 0 (0.0%) |
| 15 to 17 Year Olds | 0 (0.0%) | 0 (0.0%) |
| 18 to 19 Year Olds | 0 (0.0%) | 0 (0.0%) |
| 20 to 24 Year Olds | 0 (0.0%) | 0 (0.0%) |
| 25 to 34 Year Olds | 0 (0.0%) | 0 (0.0%) |
| 35 Years and over | 0 (0.0%) | 0 (0.0%) |
| Total | 0 (0.0%) | 0 (0.0%) |
Educational Attainment by Field of Study in Walton
Education (50 | 50.5%), business (21 | 21.2%), communications (13 | 13.1%), psychology (11 | 11.1%), and engineering (4 | 4.0%) are the most common fields of study among 99 individuals in Walton who have obtained a bachelor's degree or higher.
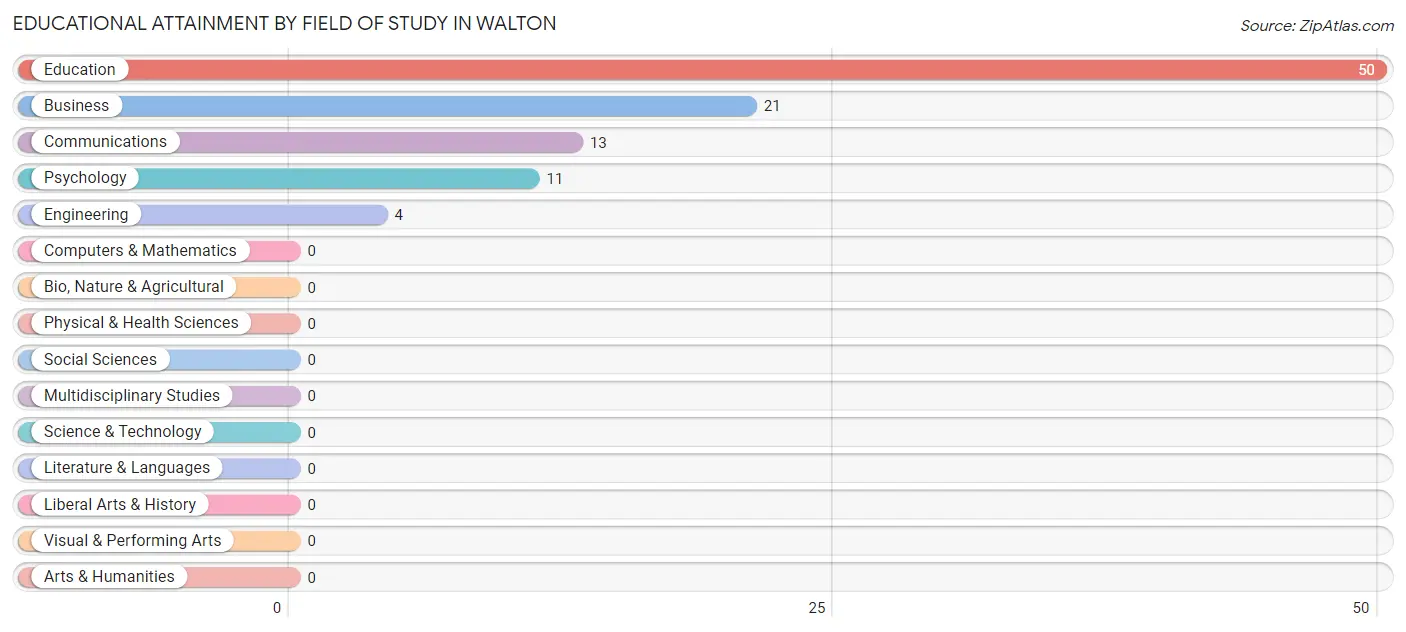
| Field of Study | # Graduates | % Graduates |
| Computers & Mathematics | 0 | 0.0% |
| Bio, Nature & Agricultural | 0 | 0.0% |
| Physical & Health Sciences | 0 | 0.0% |
| Psychology | 11 | 11.1% |
| Social Sciences | 0 | 0.0% |
| Engineering | 4 | 4.0% |
| Multidisciplinary Studies | 0 | 0.0% |
| Science & Technology | 0 | 0.0% |
| Business | 21 | 21.2% |
| Education | 50 | 50.5% |
| Literature & Languages | 0 | 0.0% |
| Liberal Arts & History | 0 | 0.0% |
| Visual & Performing Arts | 0 | 0.0% |
| Communications | 13 | 13.1% |
| Arts & Humanities | 0 | 0.0% |
| Total | 99 | 100.0% |
Transportation & Commute in Walton
Vehicle Availability by Sex in Walton
The most prevalent vehicle ownership categories in Walton are males with 5 or more vehicles (185, accounting for 83.0%) and females with 5 or more vehicles (102, making up 158.1%).
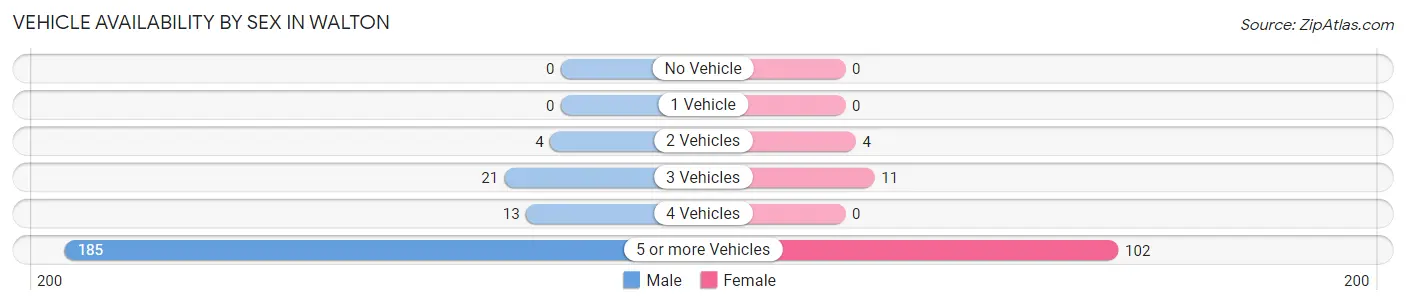
| Vehicles Available | Male | Female |
| No Vehicle | 0 (0.0%) | 0 (0.0%) |
| 1 Vehicle | 0 (0.0%) | 0 (0.0%) |
| 2 Vehicles | 4 (1.8%) | 4 (3.4%) |
| 3 Vehicles | 21 (9.4%) | 11 (9.4%) |
| 4 Vehicles | 13 (5.8%) | 0 (0.0%) |
| 5 or more Vehicles | 185 (83.0%) | 102 (87.2%) |
| Total | 223 (100.0%) | 117 (100.0%) |
Commute Time in Walton
The most frequently occuring commute durations in Walton are 15 to 19 minutes (17 commuters, 32.1%), 25 to 29 minutes (15 commuters, 28.3%), and 20 to 24 minutes (13 commuters, 24.5%).
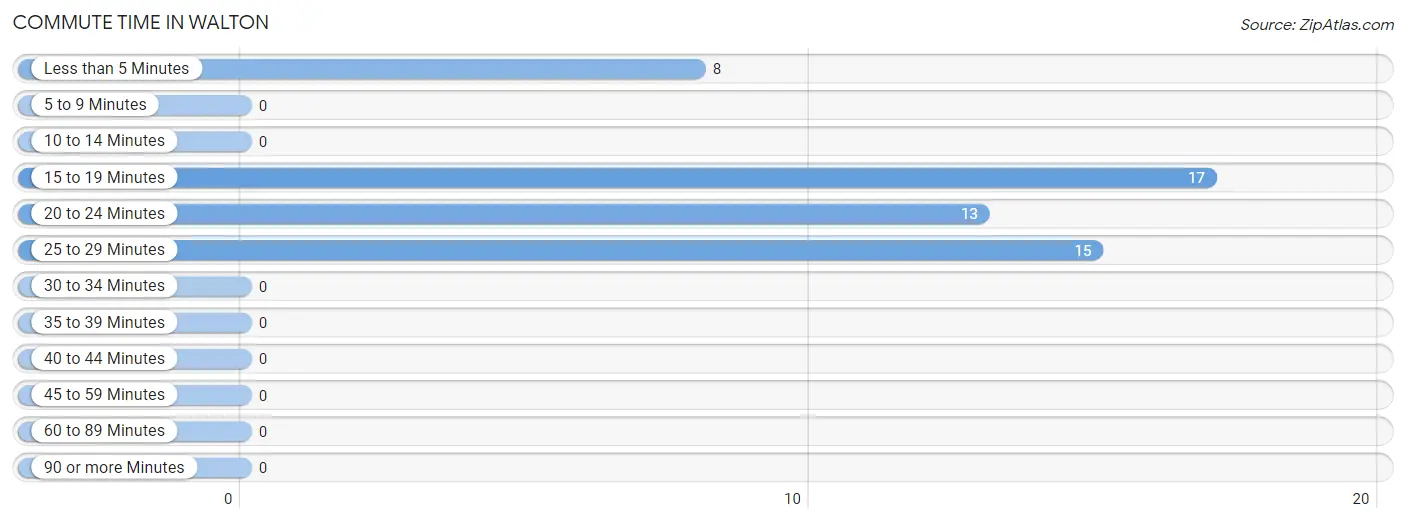
| Commute Time | # Commuters | % Commuters |
| Less than 5 Minutes | 8 | 15.1% |
| 5 to 9 Minutes | 0 | 0.0% |
| 10 to 14 Minutes | 0 | 0.0% |
| 15 to 19 Minutes | 17 | 32.1% |
| 20 to 24 Minutes | 13 | 24.5% |
| 25 to 29 Minutes | 15 | 28.3% |
| 30 to 34 Minutes | 0 | 0.0% |
| 35 to 39 Minutes | 0 | 0.0% |
| 40 to 44 Minutes | 0 | 0.0% |
| 45 to 59 Minutes | 0 | 0.0% |
| 60 to 89 Minutes | 0 | 0.0% |
| 90 or more Minutes | 0 | 0.0% |
Commute Time by Sex in Walton
The most common commute times in Walton are 15 to 19 minutes (13 commuters, 34.2%) for males and 25 to 29 minutes (11 commuters, 73.3%) for females.
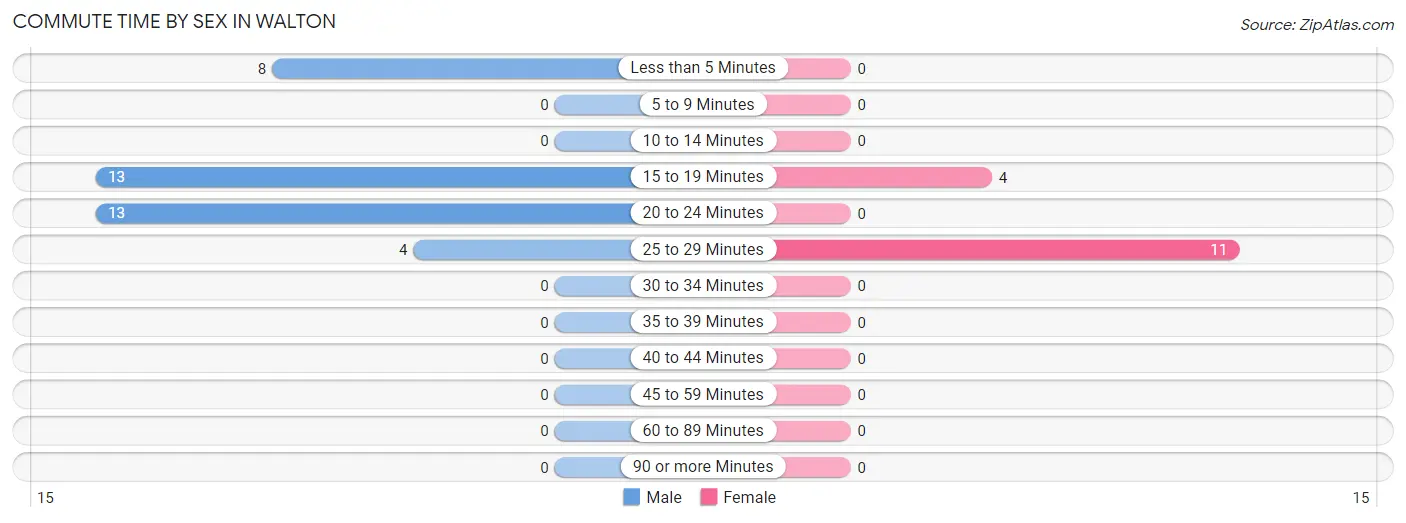
| Commute Time | Male | Female |
| Less than 5 Minutes | 8 (21.0%) | 0 (0.0%) |
| 5 to 9 Minutes | 0 (0.0%) | 0 (0.0%) |
| 10 to 14 Minutes | 0 (0.0%) | 0 (0.0%) |
| 15 to 19 Minutes | 13 (34.2%) | 4 (26.7%) |
| 20 to 24 Minutes | 13 (34.2%) | 0 (0.0%) |
| 25 to 29 Minutes | 4 (10.5%) | 11 (73.3%) |
| 30 to 34 Minutes | 0 (0.0%) | 0 (0.0%) |
| 35 to 39 Minutes | 0 (0.0%) | 0 (0.0%) |
| 40 to 44 Minutes | 0 (0.0%) | 0 (0.0%) |
| 45 to 59 Minutes | 0 (0.0%) | 0 (0.0%) |
| 60 to 89 Minutes | 0 (0.0%) | 0 (0.0%) |
| 90 or more Minutes | 0 (0.0%) | 0 (0.0%) |
Time of Departure to Work by Sex in Walton
The most frequent times of departure to work in Walton are 6:30 AM to 6:59 AM (21, 55.3%) for males and 4:00 PM to 11:59 PM (11, 73.3%) for females.
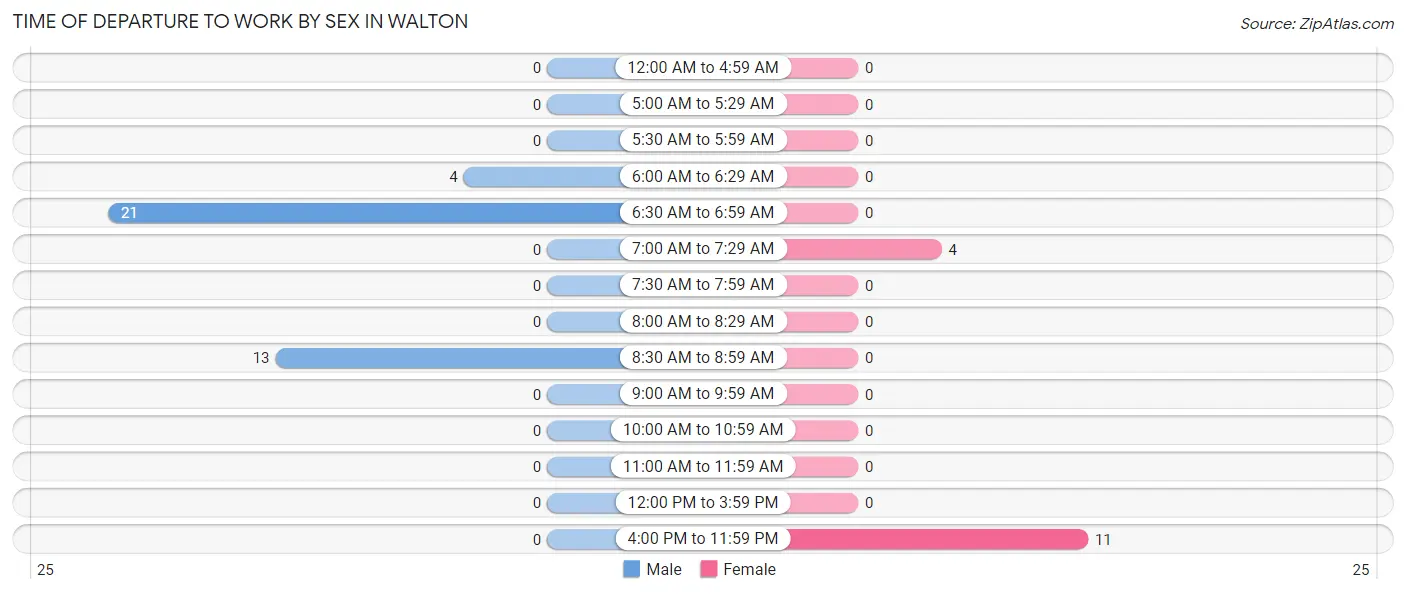
| Time of Departure | Male | Female |
| 12:00 AM to 4:59 AM | 0 (0.0%) | 0 (0.0%) |
| 5:00 AM to 5:29 AM | 0 (0.0%) | 0 (0.0%) |
| 5:30 AM to 5:59 AM | 0 (0.0%) | 0 (0.0%) |
| 6:00 AM to 6:29 AM | 4 (10.5%) | 0 (0.0%) |
| 6:30 AM to 6:59 AM | 21 (55.3%) | 0 (0.0%) |
| 7:00 AM to 7:29 AM | 0 (0.0%) | 4 (26.7%) |
| 7:30 AM to 7:59 AM | 0 (0.0%) | 0 (0.0%) |
| 8:00 AM to 8:29 AM | 0 (0.0%) | 0 (0.0%) |
| 8:30 AM to 8:59 AM | 13 (34.2%) | 0 (0.0%) |
| 9:00 AM to 9:59 AM | 0 (0.0%) | 0 (0.0%) |
| 10:00 AM to 10:59 AM | 0 (0.0%) | 0 (0.0%) |
| 11:00 AM to 11:59 AM | 0 (0.0%) | 0 (0.0%) |
| 12:00 PM to 3:59 PM | 0 (0.0%) | 0 (0.0%) |
| 4:00 PM to 11:59 PM | 0 (0.0%) | 11 (73.3%) |
| Total | 38 (100.0%) | 15 (100.0%) |
Housing Occupancy in Walton
Occupancy by Ownership in Walton
Of the total 219 dwellings in Walton, owner-occupied units account for 200 (91.3%), while renter-occupied units make up 19 (8.7%).
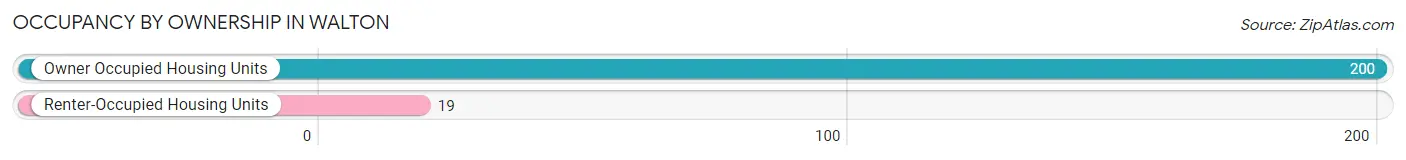
| Occupancy | # Housing Units | % Housing Units |
| Owner Occupied Housing Units | 200 | 91.3% |
| Renter-Occupied Housing Units | 19 | 8.7% |
| Total Occupied Housing Units | 219 | 100.0% |
Occupancy by Household Size in Walton
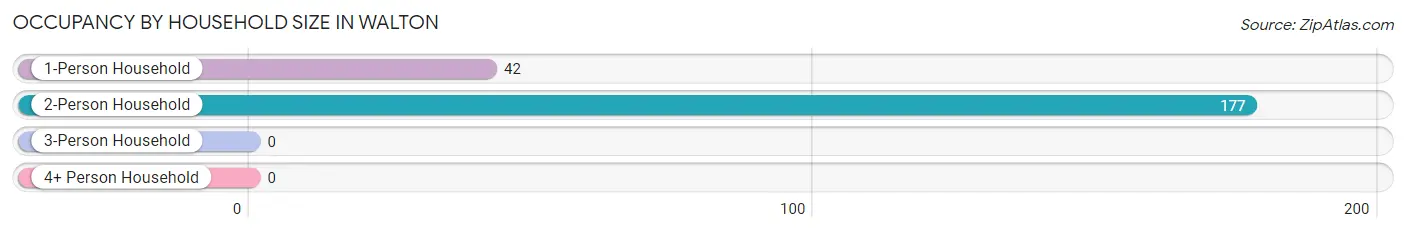
| Household Size | # Housing Units | % Housing Units |
| 1-Person Household | 42 | 19.2% |
| 2-Person Household | 177 | 80.8% |
| 3-Person Household | 0 | 0.0% |
| 4+ Person Household | 0 | 0.0% |
| Total Housing Units | 219 | 100.0% |
Occupancy by Ownership by Household Size in Walton
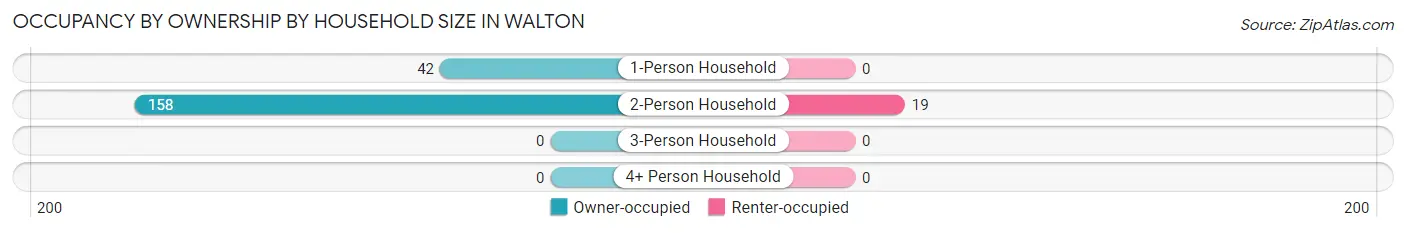
| Household Size | Owner-occupied | Renter-occupied |
| 1-Person Household | 42 (100.0%) | 0 (0.0%) |
| 2-Person Household | 158 (89.3%) | 19 (10.7%) |
| 3-Person Household | 0 (0.0%) | 0 (0.0%) |
| 4+ Person Household | 0 (0.0%) | 0 (0.0%) |
| Total Housing Units | 200 (91.3%) | 19 (8.7%) |
Occupancy by Educational Attainment in Walton
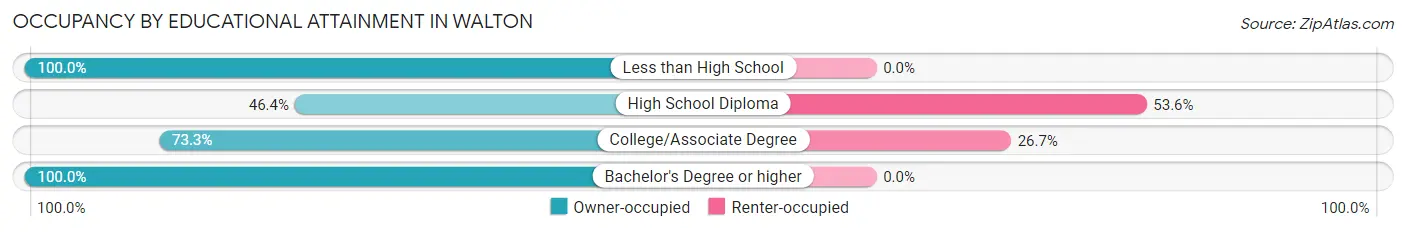
| Household Size | Owner-occupied | Renter-occupied |
| Less than High School | 102 (100.0%) | 0 (0.0%) |
| High School Diploma | 13 (46.4%) | 15 (53.6%) |
| College/Associate Degree | 11 (73.3%) | 4 (26.7%) |
| Bachelor's Degree or higher | 74 (100.0%) | 0 (0.0%) |
Occupancy by Age of Householder in Walton
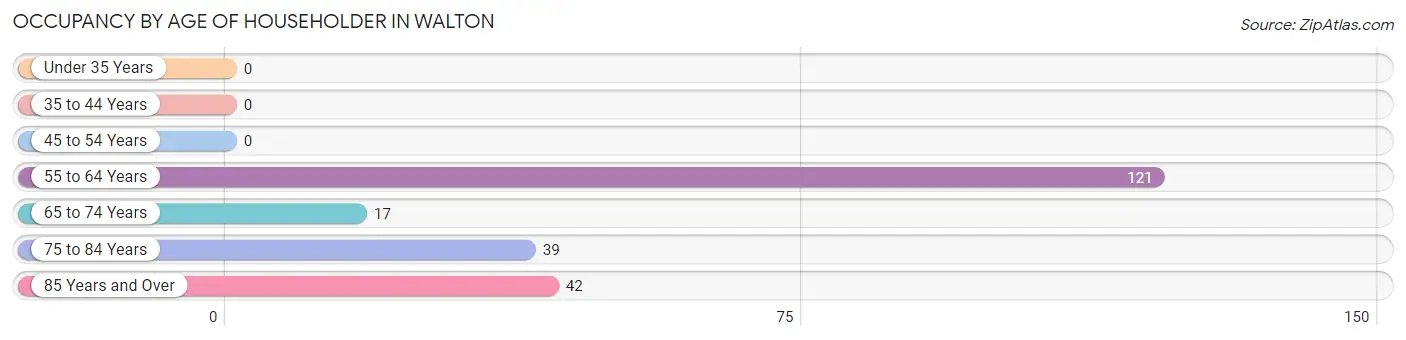
| Age Bracket | # Households | % Households |
| Under 35 Years | 0 | 0.0% |
| 35 to 44 Years | 0 | 0.0% |
| 45 to 54 Years | 0 | 0.0% |
| 55 to 64 Years | 121 | 55.2% |
| 65 to 74 Years | 17 | 7.8% |
| 75 to 84 Years | 39 | 17.8% |
| 85 Years and Over | 42 | 19.2% |
| Total | 219 | 100.0% |
Housing Finances in Walton
Median Income by Occupancy in Walton
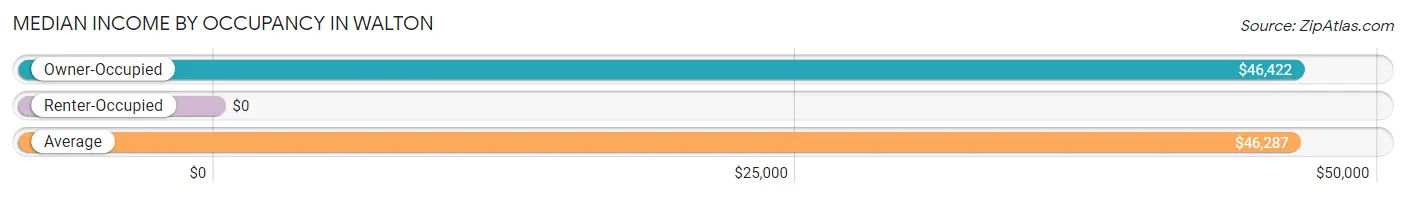
| Occupancy Type | # Households | Median Income |
| Owner-Occupied | 200 (91.3%) | $46,422 |
| Renter-Occupied | 19 (8.7%) | $0 |
| Average | 219 (100.0%) | $46,287 |
Occupancy by Householder Income Bracket in Walton
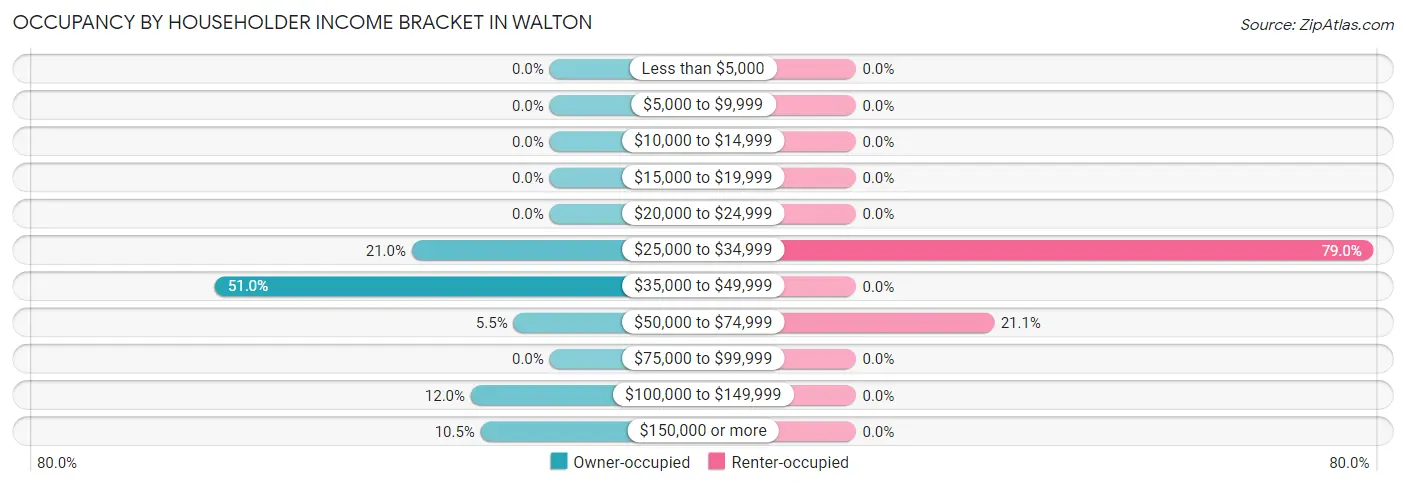
| Income Bracket | Owner-occupied | Renter-occupied |
| Less than $5,000 | 0 (0.0%) | 0 (0.0%) |
| $5,000 to $9,999 | 0 (0.0%) | 0 (0.0%) |
| $10,000 to $14,999 | 0 (0.0%) | 0 (0.0%) |
| $15,000 to $19,999 | 0 (0.0%) | 0 (0.0%) |
| $20,000 to $24,999 | 0 (0.0%) | 0 (0.0%) |
| $25,000 to $34,999 | 42 (21.0%) | 15 (78.9%) |
| $35,000 to $49,999 | 102 (51.0%) | 0 (0.0%) |
| $50,000 to $74,999 | 11 (5.5%) | 4 (21.0%) |
| $75,000 to $99,999 | 0 (0.0%) | 0 (0.0%) |
| $100,000 to $149,999 | 24 (12.0%) | 0 (0.0%) |
| $150,000 or more | 21 (10.5%) | 0 (0.0%) |
| Total | 200 (100.0%) | 19 (100.0%) |
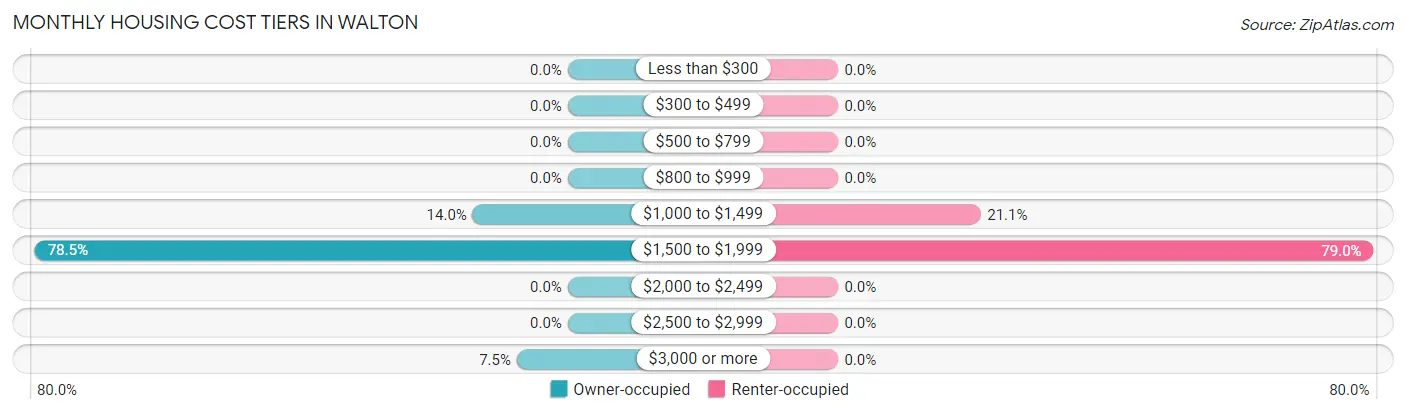
Monthly Housing Cost Tiers in Walton
| Monthly Cost | Owner-occupied | Renter-occupied |
| Less than $300 | 0 (0.0%) | 0 (0.0%) |
| $300 to $499 | 0 (0.0%) | 0 (0.0%) |
| $500 to $799 | 0 (0.0%) | 0 (0.0%) |
| $800 to $999 | 0 (0.0%) | 0 (0.0%) |
| $1,000 to $1,499 | 28 (14.0%) | 4 (21.0%) |
| $1,500 to $1,999 | 157 (78.5%) | 15 (78.9%) |
| $2,000 to $2,499 | 0 (0.0%) | 0 (0.0%) |
| $2,500 to $2,999 | 0 (0.0%) | 0 (0.0%) |
| $3,000 or more | 15 (7.5%) | 0 (0.0%) |
| Total | 200 (100.0%) | 19 (100.0%) |
Physical Housing Characteristics in Walton
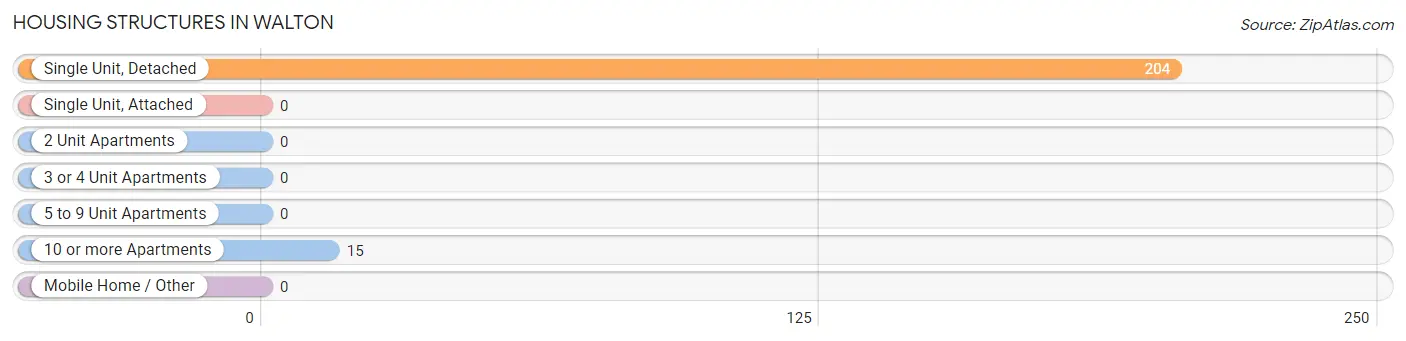
Housing Structures in Walton
| Structure Type | # Housing Units | % Housing Units |
| Single Unit, Detached | 204 | 93.1% |
| Single Unit, Attached | 0 | 0.0% |
| 2 Unit Apartments | 0 | 0.0% |
| 3 or 4 Unit Apartments | 0 | 0.0% |
| 5 to 9 Unit Apartments | 0 | 0.0% |
| 10 or more Apartments | 15 | 6.9% |
| Mobile Home / Other | 0 | 0.0% |
| Total | 219 | 100.0% |
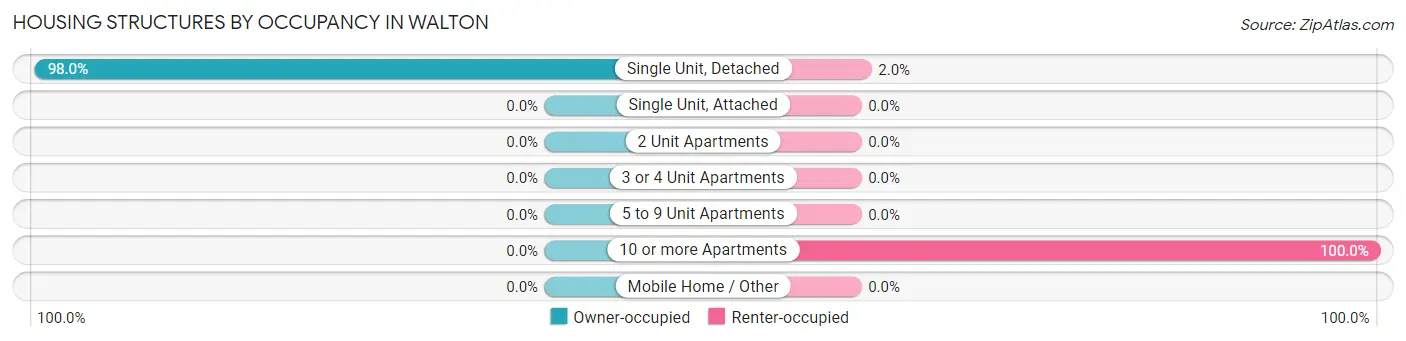
Housing Structures by Occupancy in Walton
| Structure Type | Owner-occupied | Renter-occupied |
| Single Unit, Detached | 200 (98.0%) | 4 (2.0%) |
| Single Unit, Attached | 0 (0.0%) | 0 (0.0%) |
| 2 Unit Apartments | 0 (0.0%) | 0 (0.0%) |
| 3 or 4 Unit Apartments | 0 (0.0%) | 0 (0.0%) |
| 5 to 9 Unit Apartments | 0 (0.0%) | 0 (0.0%) |
| 10 or more Apartments | 0 (0.0%) | 15 (100.0%) |
| Mobile Home / Other | 0 (0.0%) | 0 (0.0%) |
| Total | 200 (91.3%) | 19 (8.7%) |
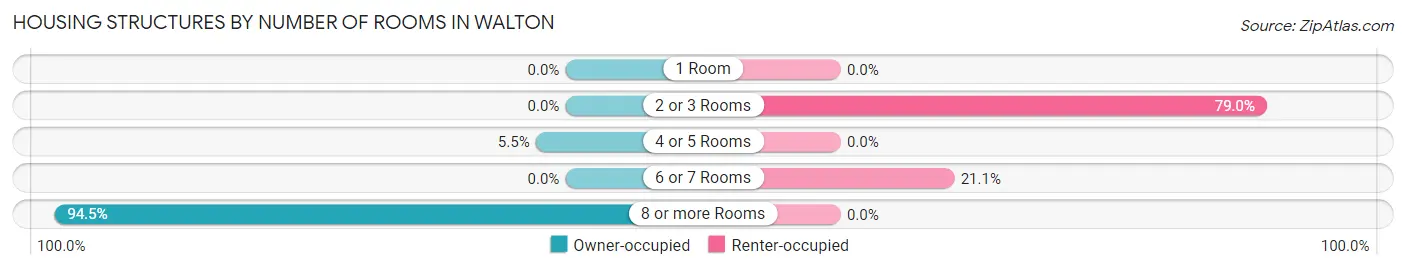
Housing Structures by Number of Rooms in Walton
| Number of Rooms | Owner-occupied | Renter-occupied |
| 1 Room | 0 (0.0%) | 0 (0.0%) |
| 2 or 3 Rooms | 0 (0.0%) | 15 (78.9%) |
| 4 or 5 Rooms | 11 (5.5%) | 0 (0.0%) |
| 6 or 7 Rooms | 0 (0.0%) | 4 (21.0%) |
| 8 or more Rooms | 189 (94.5%) | 0 (0.0%) |
| Total | 200 (100.0%) | 19 (100.0%) |
Housing Structure by Heating Type in Walton
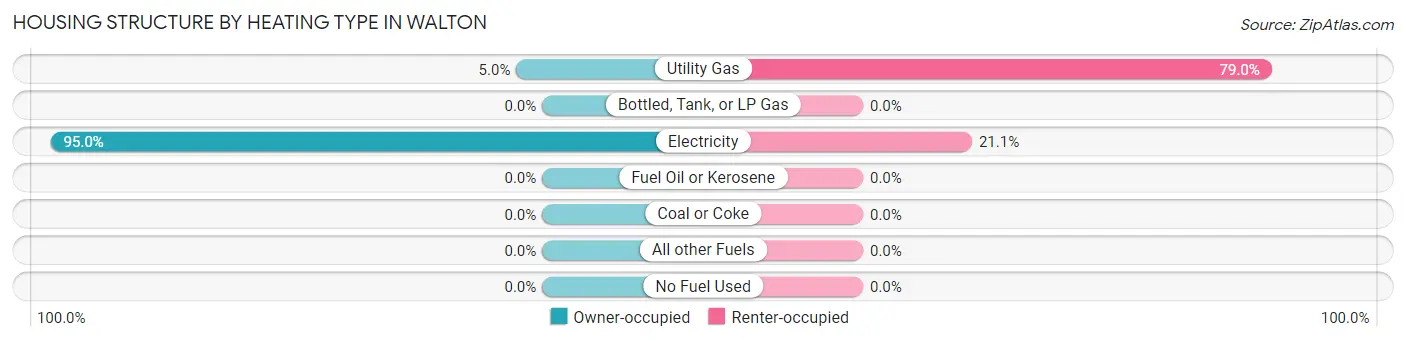
| Heating Type | Owner-occupied | Renter-occupied |
| Utility Gas | 10 (5.0%) | 15 (78.9%) |
| Bottled, Tank, or LP Gas | 0 (0.0%) | 0 (0.0%) |
| Electricity | 190 (95.0%) | 4 (21.0%) |
| Fuel Oil or Kerosene | 0 (0.0%) | 0 (0.0%) |
| Coal or Coke | 0 (0.0%) | 0 (0.0%) |
| All other Fuels | 0 (0.0%) | 0 (0.0%) |
| No Fuel Used | 0 (0.0%) | 0 (0.0%) |
| Total | 200 (100.0%) | 19 (100.0%) |
Household Vehicle Usage in Walton
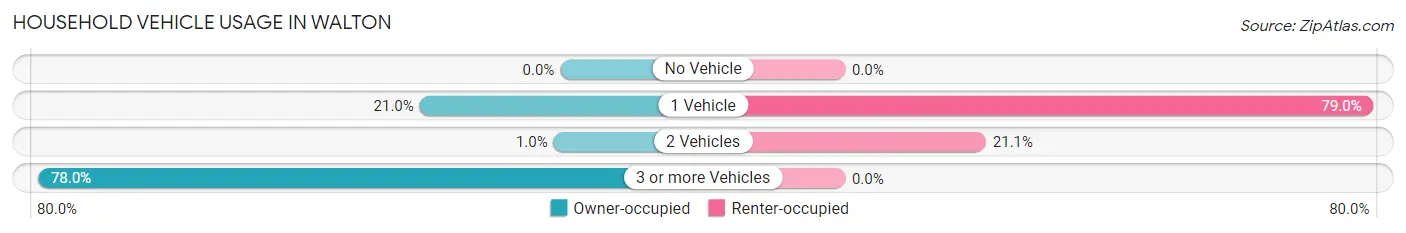
| Vehicles per Household | Owner-occupied | Renter-occupied |
| No Vehicle | 0 (0.0%) | 0 (0.0%) |
| 1 Vehicle | 42 (21.0%) | 15 (78.9%) |
| 2 Vehicles | 2 (1.0%) | 4 (21.0%) |
| 3 or more Vehicles | 156 (78.0%) | 0 (0.0%) |
| Total | 200 (100.0%) | 19 (100.0%) |
Real Estate & Mortgages in Walton
Real Estate and Mortgage Overview in Walton
| Characteristic | Without Mortgage | With Mortgage |
| Housing Units | 83 | 117 |
| Median Property Value | $837,900 | $457,400 |
| Median Household Income | - | - |
| Monthly Housing Costs | $1,501 | $15 |
| Real Estate Taxes | $10,001 | $0 |
Property Value by Mortgage Status in Walton
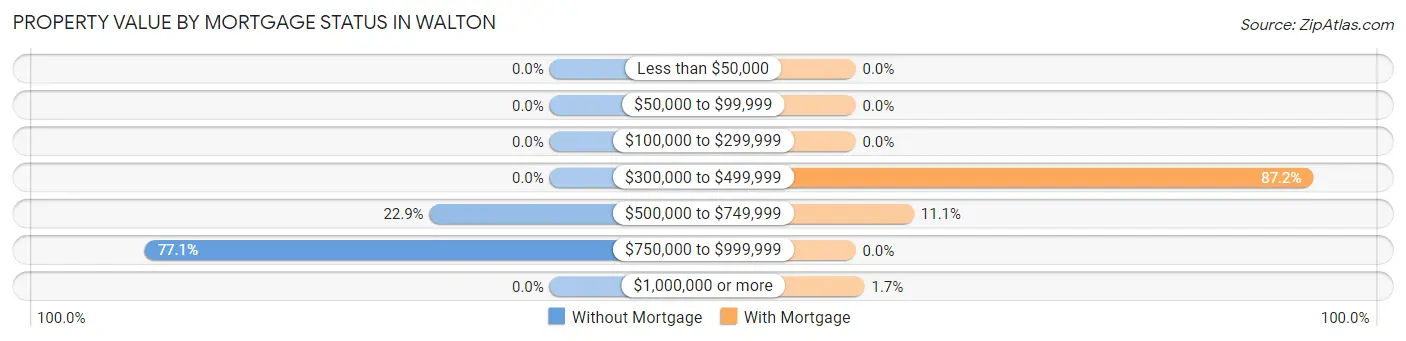
| Property Value | Without Mortgage | With Mortgage |
| Less than $50,000 | 0 (0.0%) | 0 (0.0%) |
| $50,000 to $99,999 | 0 (0.0%) | 0 (0.0%) |
| $100,000 to $299,999 | 0 (0.0%) | 0 (0.0%) |
| $300,000 to $499,999 | 0 (0.0%) | 102 (87.2%) |
| $500,000 to $749,999 | 19 (22.9%) | 13 (11.1%) |
| $750,000 to $999,999 | 64 (77.1%) | 0 (0.0%) |
| $1,000,000 or more | 0 (0.0%) | 2 (1.7%) |
| Total | 83 (100.0%) | 117 (100.0%) |
Household Income by Mortgage Status in Walton
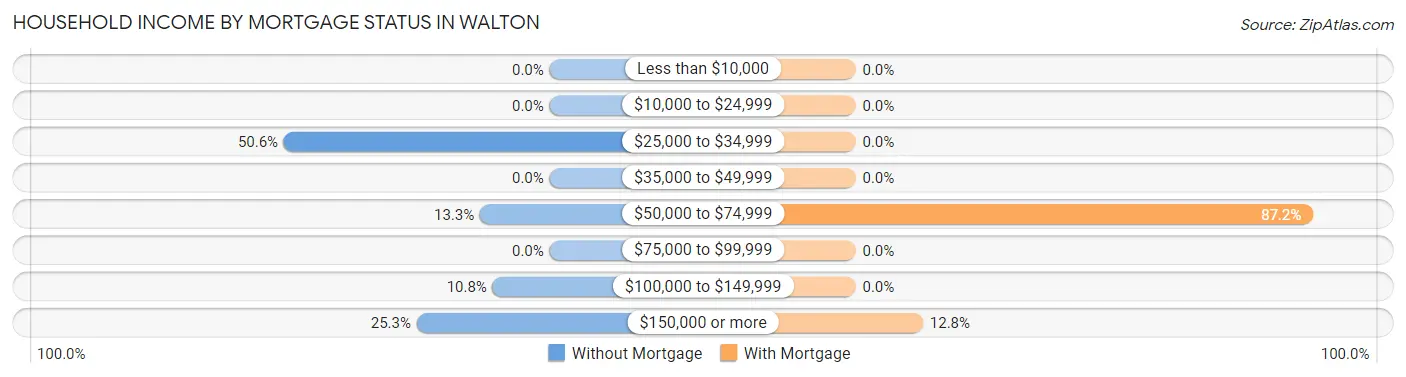
| Household Income | Without Mortgage | With Mortgage |
| Less than $10,000 | 0 (0.0%) | 0 (0.0%) |
| $10,000 to $24,999 | 0 (0.0%) | 0 (0.0%) |
| $25,000 to $34,999 | 42 (50.6%) | 0 (0.0%) |
| $35,000 to $49,999 | 0 (0.0%) | 0 (0.0%) |
| $50,000 to $74,999 | 11 (13.3%) | 102 (87.2%) |
| $75,000 to $99,999 | 0 (0.0%) | 0 (0.0%) |
| $100,000 to $149,999 | 9 (10.8%) | 0 (0.0%) |
| $150,000 or more | 21 (25.3%) | 15 (12.8%) |
| Total | 83 (100.0%) | 117 (100.0%) |
Property Value to Household Income Ratio in Walton
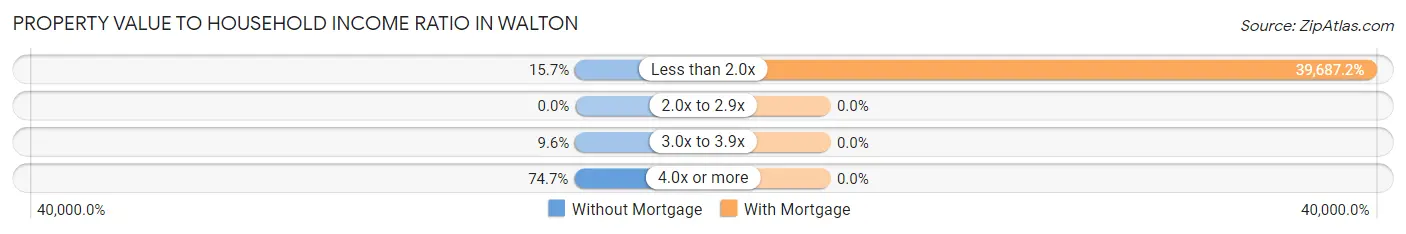
| Value-to-Income Ratio | Without Mortgage | With Mortgage |
| Less than 2.0x | 13 (15.7%) | 46,434 (39,687.2%) |
| 2.0x to 2.9x | 0 (0.0%) | 0 (0.0%) |
| 3.0x to 3.9x | 8 (9.6%) | 0 (0.0%) |
| 4.0x or more | 62 (74.7%) | 0 (0.0%) |
| Total | 83 (100.0%) | 117 (100.0%) |
Real Estate Taxes by Mortgage Status in Walton
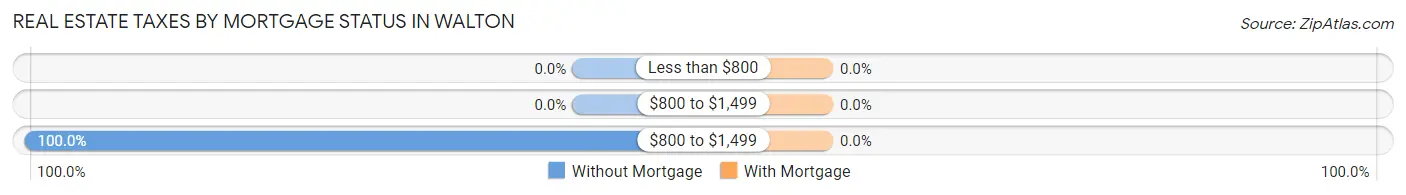
| Property Taxes | Without Mortgage | With Mortgage |
| Less than $800 | 0 (0.0%) | 0 (0.0%) |
| $800 to $1,499 | 0 (0.0%) | 0 (0.0%) |
| $800 to $1,499 | 83 (100.0%) | 0 (0.0%) |
| Total | 83 (100.0%) | 117 (100.0%) |
Health & Disability in Walton
Health Insurance Coverage by Age in Walton
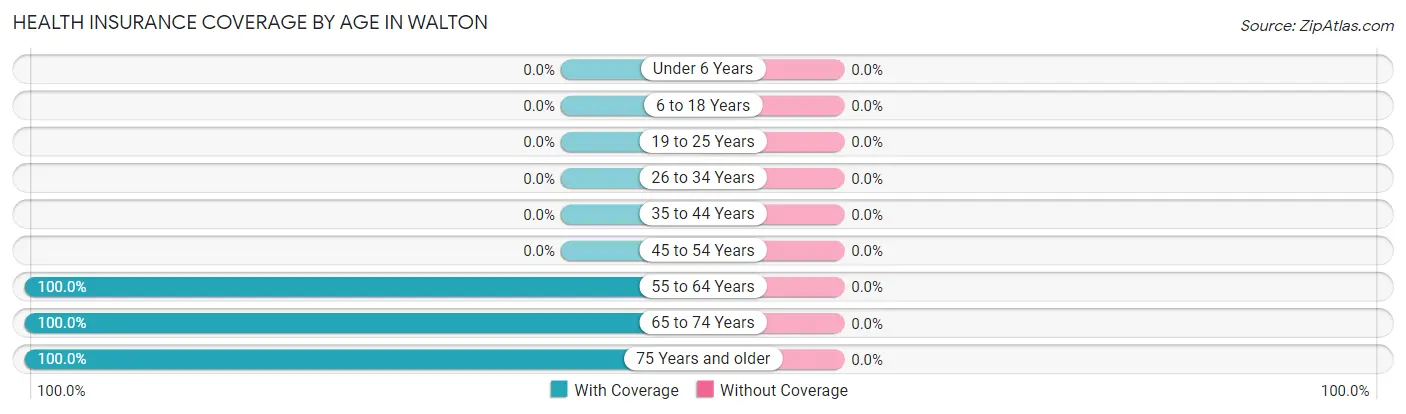
| Age Bracket | With Coverage | Without Coverage |
| Under 6 Years | 0 (0.0%) | 0 (0.0%) |
| 6 to 18 Years | 0 (0.0%) | 0 (0.0%) |
| 19 to 25 Years | 0 (0.0%) | 0 (0.0%) |
| 26 to 34 Years | 0 (0.0%) | 0 (0.0%) |
| 35 to 44 Years | 0 (0.0%) | 0 (0.0%) |
| 45 to 54 Years | 0 (0.0%) | 0 (0.0%) |
| 55 to 64 Years | 334 (100.0%) | 0 (0.0%) |
| 65 to 74 Years | 49 (100.0%) | 0 (0.0%) |
| 75 Years and older | 91 (100.0%) | 0 (0.0%) |
| Total | 474 (100.0%) | 0 (0.0%) |
Health Insurance Coverage by Citizenship Status in Walton
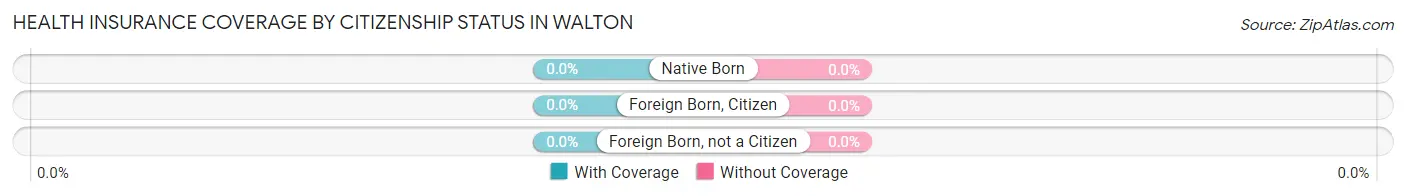
| Citizenship Status | With Coverage | Without Coverage |
| Native Born | 0 (0.0%) | 0 (0.0%) |
| Foreign Born, Citizen | 0 (0.0%) | 0 (0.0%) |
| Foreign Born, not a Citizen | 0 (0.0%) | 0 (0.0%) |
Health Insurance Coverage by Household Income in Walton
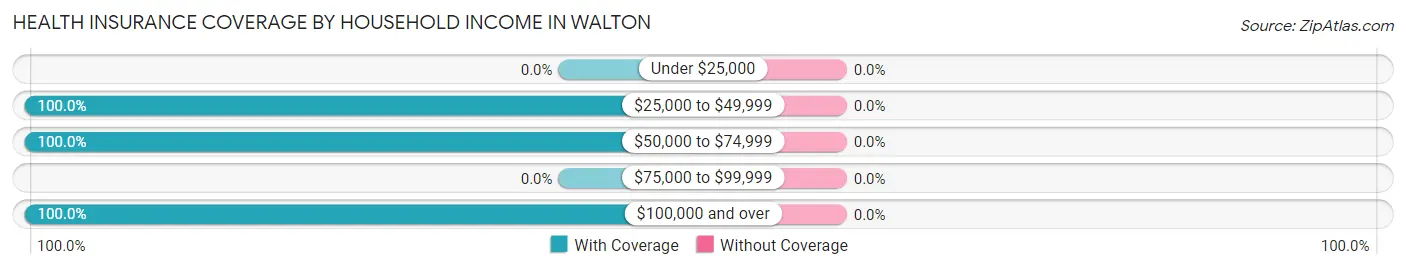
| Household Income | With Coverage | Without Coverage |
| Under $25,000 | 0 (0.0%) | 0 (0.0%) |
| $25,000 to $49,999 | 357 (100.0%) | 0 (0.0%) |
| $50,000 to $74,999 | 29 (100.0%) | 0 (0.0%) |
| $75,000 to $99,999 | 0 (0.0%) | 0 (0.0%) |
| $100,000 and over | 88 (100.0%) | 0 (0.0%) |
Public vs Private Health Insurance Coverage by Age in Walton
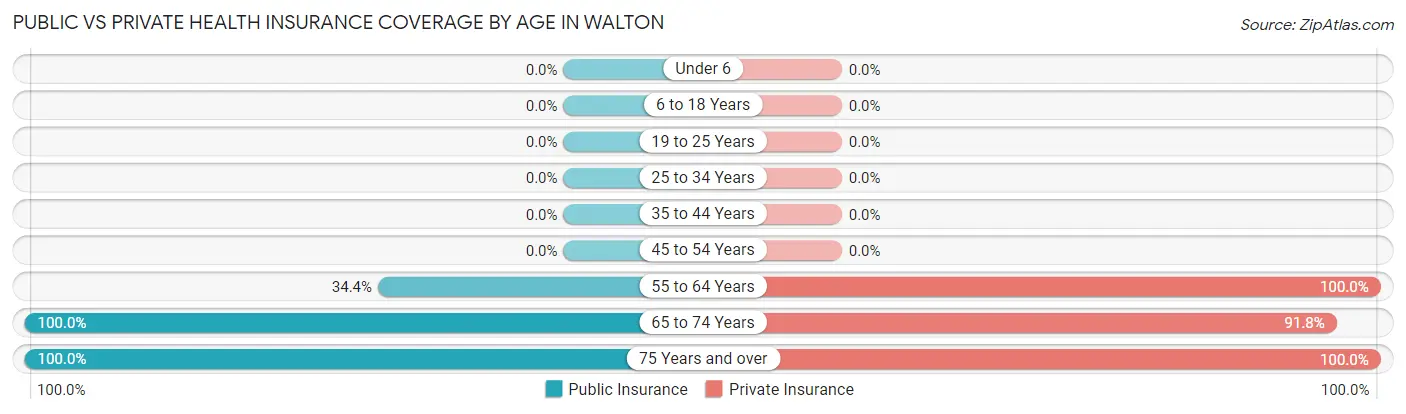
| Age Bracket | Public Insurance | Private Insurance |
| Under 6 | 0 (0.0%) | 0 (0.0%) |
| 6 to 18 Years | 0 (0.0%) | 0 (0.0%) |
| 19 to 25 Years | 0 (0.0%) | 0 (0.0%) |
| 25 to 34 Years | 0 (0.0%) | 0 (0.0%) |
| 35 to 44 Years | 0 (0.0%) | 0 (0.0%) |
| 45 to 54 Years | 0 (0.0%) | 0 (0.0%) |
| 55 to 64 Years | 115 (34.4%) | 334 (100.0%) |
| 65 to 74 Years | 49 (100.0%) | 45 (91.8%) |
| 75 Years and over | 91 (100.0%) | 91 (100.0%) |
| Total | 255 (53.8%) | 470 (99.2%) |
Disability Status by Sex by Age in Walton
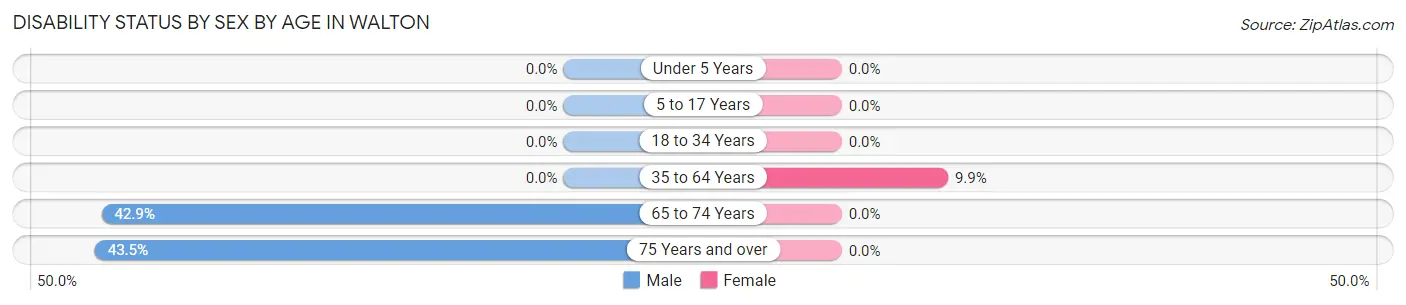
| Age Bracket | Male | Female |
| Under 5 Years | 0 (0.0%) | 0 (0.0%) |
| 5 to 17 Years | 0 (0.0%) | 0 (0.0%) |
| 18 to 34 Years | 0 (0.0%) | 0 (0.0%) |
| 35 to 64 Years | 0 (0.0%) | 13 (9.9%) |
| 65 to 74 Years | 9 (42.9%) | 0 (0.0%) |
| 75 Years and over | 10 (43.5%) | 0 (0.0%) |
Disability Class by Sex by Age in Walton
Disability Class: Hearing Difficulty
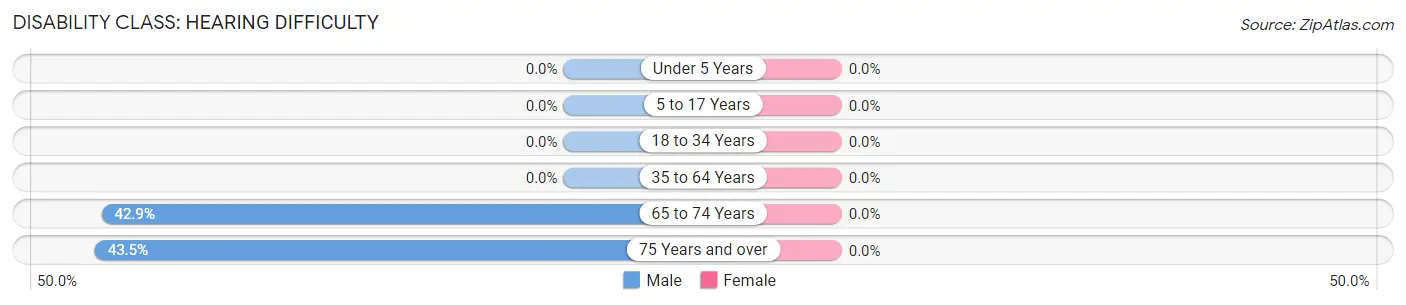
| Age Bracket | Male | Female |
| Under 5 Years | 0 (0.0%) | 0 (0.0%) |
| 5 to 17 Years | 0 (0.0%) | 0 (0.0%) |
| 18 to 34 Years | 0 (0.0%) | 0 (0.0%) |
| 35 to 64 Years | 0 (0.0%) | 0 (0.0%) |
| 65 to 74 Years | 9 (42.9%) | 0 (0.0%) |
| 75 Years and over | 10 (43.5%) | 0 (0.0%) |
Disability Class: Vision Difficulty
| Age Bracket | Male | Female |
| Under 5 Years | 0 (0.0%) | 0 (0.0%) |
| 5 to 17 Years | 0 (0.0%) | 0 (0.0%) |
| 18 to 34 Years | 0 (0.0%) | 0 (0.0%) |
| 35 to 64 Years | 0 (0.0%) | 0 (0.0%) |
| 65 to 74 Years | 0 (0.0%) | 0 (0.0%) |
| 75 Years and over | 0 (0.0%) | 0 (0.0%) |
Disability Class: Cognitive Difficulty
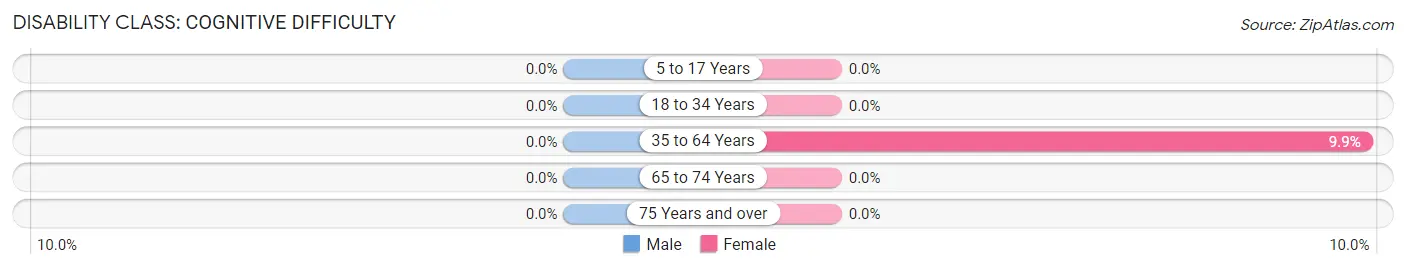
| Age Bracket | Male | Female |
| 5 to 17 Years | 0 (0.0%) | 0 (0.0%) |
| 18 to 34 Years | 0 (0.0%) | 0 (0.0%) |
| 35 to 64 Years | 0 (0.0%) | 13 (9.9%) |
| 65 to 74 Years | 0 (0.0%) | 0 (0.0%) |
| 75 Years and over | 0 (0.0%) | 0 (0.0%) |
Disability Class: Ambulatory Difficulty
| Age Bracket | Male | Female |
| 5 to 17 Years | 0 (0.0%) | 0 (0.0%) |
| 18 to 34 Years | 0 (0.0%) | 0 (0.0%) |
| 35 to 64 Years | 0 (0.0%) | 0 (0.0%) |
| 65 to 74 Years | 0 (0.0%) | 0 (0.0%) |
| 75 Years and over | 0 (0.0%) | 0 (0.0%) |
Disability Class: Self-Care Difficulty
| Age Bracket | Male | Female |
| 5 to 17 Years | 0 (0.0%) | 0 (0.0%) |
| 18 to 34 Years | 0 (0.0%) | 0 (0.0%) |
| 35 to 64 Years | 0 (0.0%) | 0 (0.0%) |
| 65 to 74 Years | 0 (0.0%) | 0 (0.0%) |
| 75 Years and over | 0 (0.0%) | 0 (0.0%) |
Technology Access in Walton
Computing Device Access in Walton
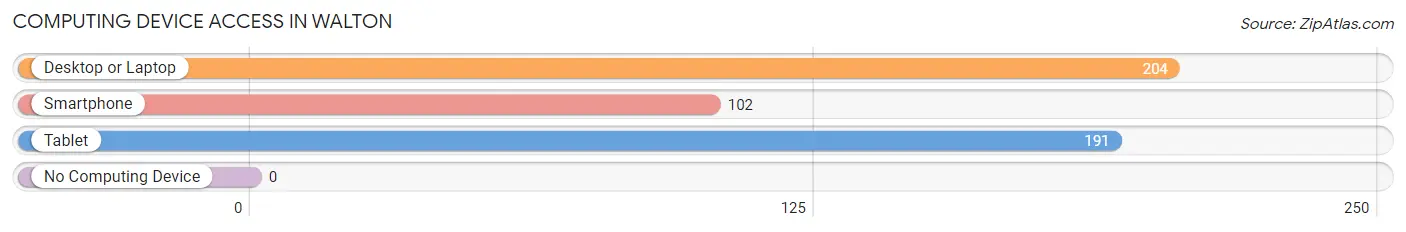
| Device Type | # Households | % Households |
| Desktop or Laptop | 204 | 93.1% |
| Smartphone | 102 | 46.6% |
| Tablet | 191 | 87.2% |
| No Computing Device | 0 | 0.0% |
| Total | 219 | 100.0% |
Internet Access in Walton
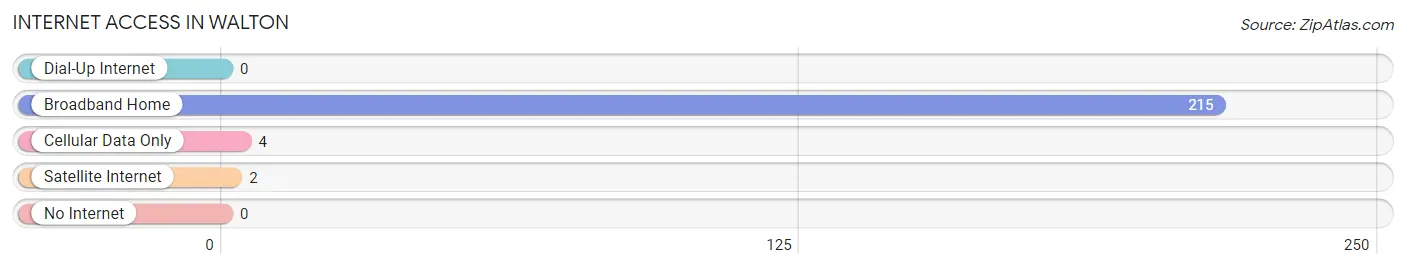
| Internet Type | # Households | % Households |
| Dial-Up Internet | 0 | 0.0% |
| Broadband Home | 215 | 98.2% |
| Cellular Data Only | 4 | 1.8% |
| Satellite Internet | 2 | 0.9% |
| No Internet | 0 | 0.0% |
| Total | 219 | 100.0% |
Walton Summary
Walton, Nebraska is a small town located in the southeastern corner of the state, in the heart of the Great Plains. It is situated in the Platte River Valley, and is surrounded by rolling hills and farmland. The town was founded in 1871, and has a population of just over 500 people.
Walton is located in the Platte River Valley, which is a major agricultural region in Nebraska. The town is situated on the banks of the Platte River, and is surrounded by rolling hills and farmland. The area is known for its rich soil and abundant water resources, which make it ideal for farming and ranching. The town is also home to a variety of wildlife, including deer, antelope, and wild turkeys.
Walton is a small town with a rich history. The town was founded in 1871, and was named after the first settler, William Walton. The town was originally a trading post, and was a popular stop for travelers and settlers heading west. The town grew steadily over the years, and by the early 1900s, it had become a thriving agricultural center.
The economy of Walton is largely based on agriculture. The town is home to several large farms and ranches, and the surrounding area is known for its production of corn, soybeans, and wheat. The town also has a number of small businesses, including a grocery store, a hardware store, and a few restaurants.
The demographics of Walton are largely rural. The town has a population of just over 500 people, and the majority of the population is white. The median age of the population is 44, and the median household income is $45,000. The town has a low unemployment rate, and the majority of the population is employed in the agricultural sector.
Walton is a small town with a rich history and a vibrant economy. The town is surrounded by rolling hills and farmland, and is home to a variety of wildlife. The town is also home to a number of small businesses, and the majority of the population is employed in the agricultural sector. The town has a population of just over 500 people, and the median age of the population is 44. The median household income is $45,000, and the town has a low unemployment rate.
Common Questions
What is Per Capita Income in Walton?
Per Capita income in Walton is $71,509.
What is the Median Household income in Walton?
Median Household Income in Walton is $46,287.
What is Income or Wage Gap in Walton?
Income or Wage Gap in Walton is 81.0%.
Women in Walton earn 19.0 cents for every dollar earned by a man.
What is Inequality or Gini Index in Walton?
Inequality or Gini Index in Walton is 0.67.
What is the Total Population of Walton?
Total Population of Walton is 474.
What is the Total Male Population of Walton?
Total Male Population of Walton is 246.
What is the Total Female Population of Walton?
Total Female Population of Walton is 228.
What is the Ratio of Males per 100 Females in Walton?
There are 107.89 Males per 100 Females in Walton.
What is the Ratio of Females per 100 Males in Walton?
There are 92.68 Females per 100 Males in Walton.
What is the Median Population Age in Walton?
Median Population Age in Walton is 61.6 Years.
What is the Average Family Size in Walton
Average Family Size in Walton is 2.4 People.
What is the Average Household Size in Walton
Average Household Size in Walton is 2.2 People.
How Large is the Labor Force in Walton?
There are 340 People in the Labor Forcein in Walton.
What is the Percentage of People in the Labor Force in Walton?
71.7% of People are in the Labor Force in Walton.