Atkinson, NE Map & Demographics
Atkinson Map
Atkinson Overview
$30,704
PER CAPITA INCOME
$86,395
AVG FAMILY INCOME
$72,656
AVG HOUSEHOLD INCOME
41.7%
WAGE / INCOME GAP [ % ]
58.3¢/ $1
WAGE / INCOME GAP [ $ ]
$5,617
FAMILY INCOME DEFICIT
0.39
INEQUALITY / GINI INDEX
1,426
TOTAL POPULATION
666
MALE POPULATION
760
FEMALE POPULATION
87.63
MALES / 100 FEMALES
114.11
FEMALES / 100 MALES
39.1
MEDIAN AGE
3.1
AVG FAMILY SIZE
2.5
AVG HOUSEHOLD SIZE
727
LABOR FORCE [ PEOPLE ]
69.9%
PERCENT IN LABOR FORCE
4.4%
UNEMPLOYMENT RATE
Atkinson Zip Codes
Atkinson Area Codes
Income in Atkinson
Income Overview in Atkinson
Per Capita Income in Atkinson is $30,704, while median incomes of families and households are $86,395 and $72,656 respectively.
| Characteristic | Number | Measure |
| Per Capita Income | 1,426 | $30,704 |
| Median Family Income | 390 | $86,395 |
| Mean Family Income | 390 | $94,310 |
| Median Household Income | 555 | $72,656 |
| Mean Household Income | 555 | $77,441 |
| Income Deficit | 390 | $5,617 |
| Wage / Income Gap (%) | 1,426 | 41.66% |
| Wage / Income Gap ($) | 1,426 | 58.34¢ per $1 |
| Gini / Inequality Index | 1,426 | 0.39 |
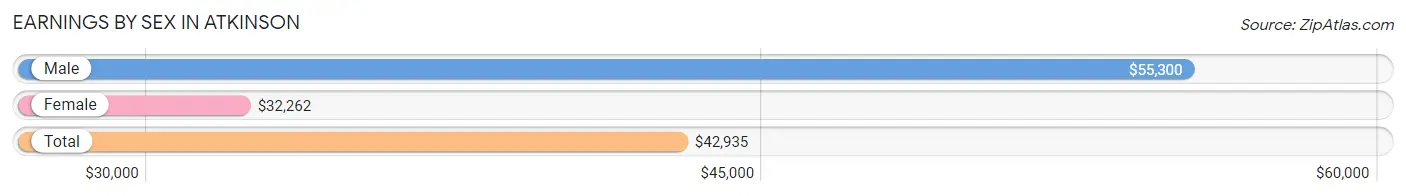
Earnings by Sex in Atkinson
Average Earnings in Atkinson are $42,935, $55,300 for men and $32,262 for women, a difference of 41.7%.
| Sex | Number | Average Earnings |
| Male | 384 (51.6%) | $55,300 |
| Female | 360 (48.4%) | $32,262 |
| Total | 744 (100.0%) | $42,935 |
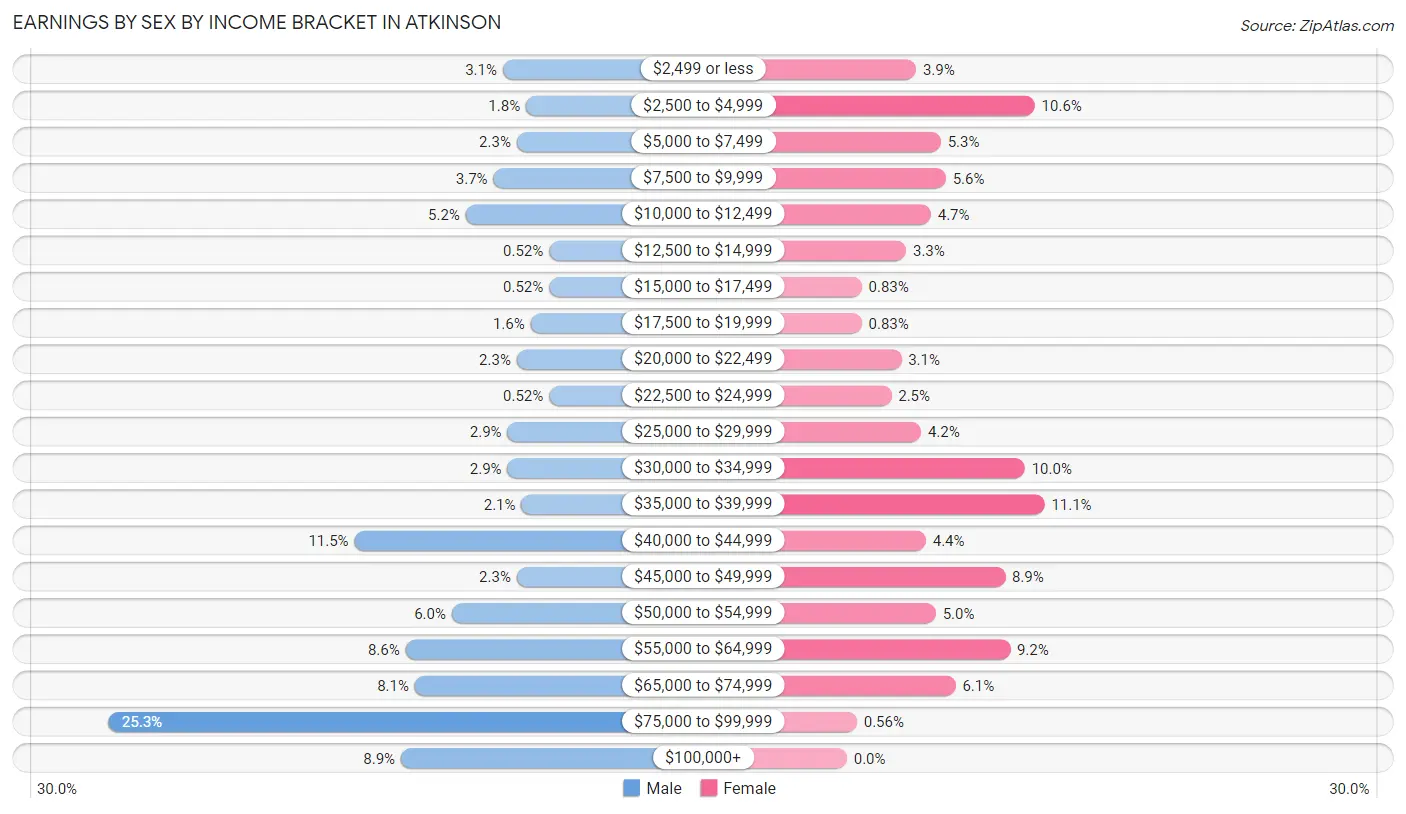
Earnings by Sex by Income Bracket in Atkinson
The most common earnings brackets in Atkinson are $75,000 to $99,999 for men (97 | 25.3%) and $35,000 to $39,999 for women (40 | 11.1%).
| Income | Male | Female |
| $2,499 or less | 12 (3.1%) | 14 (3.9%) |
| $2,500 to $4,999 | 7 (1.8%) | 38 (10.6%) |
| $5,000 to $7,499 | 9 (2.3%) | 19 (5.3%) |
| $7,500 to $9,999 | 14 (3.6%) | 20 (5.6%) |
| $10,000 to $12,499 | 20 (5.2%) | 17 (4.7%) |
| $12,500 to $14,999 | 2 (0.5%) | 12 (3.3%) |
| $15,000 to $17,499 | 2 (0.5%) | 3 (0.8%) |
| $17,500 to $19,999 | 6 (1.6%) | 3 (0.8%) |
| $20,000 to $22,499 | 9 (2.3%) | 11 (3.1%) |
| $22,500 to $24,999 | 2 (0.5%) | 9 (2.5%) |
| $25,000 to $29,999 | 11 (2.9%) | 15 (4.2%) |
| $30,000 to $34,999 | 11 (2.9%) | 36 (10.0%) |
| $35,000 to $39,999 | 8 (2.1%) | 40 (11.1%) |
| $40,000 to $44,999 | 44 (11.5%) | 16 (4.4%) |
| $45,000 to $49,999 | 9 (2.3%) | 32 (8.9%) |
| $50,000 to $54,999 | 23 (6.0%) | 18 (5.0%) |
| $55,000 to $64,999 | 33 (8.6%) | 33 (9.2%) |
| $65,000 to $74,999 | 31 (8.1%) | 22 (6.1%) |
| $75,000 to $99,999 | 97 (25.3%) | 2 (0.6%) |
| $100,000+ | 34 (8.8%) | 0 (0.0%) |
| Total | 384 (100.0%) | 360 (100.0%) |
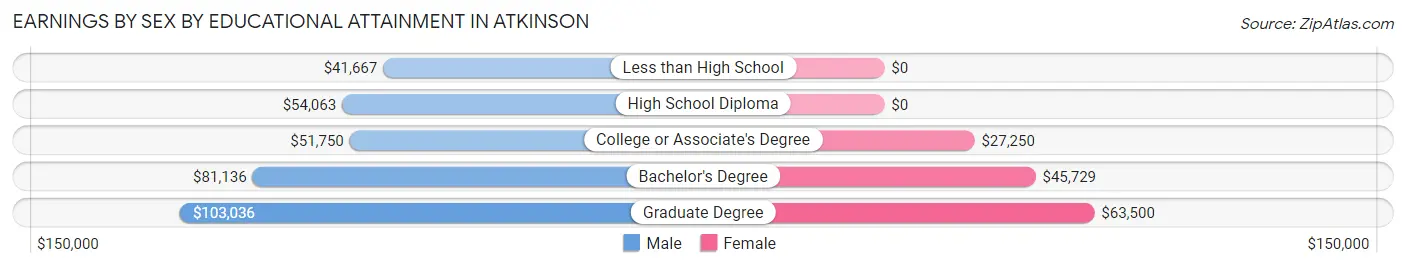
Earnings by Sex by Educational Attainment in Atkinson
Average earnings in Atkinson are $57,050 for men and $34,833 for women, a difference of 38.9%. Men with an educational attainment of graduate degree enjoy the highest average annual earnings of $103,036, while those with less than high school education earn the least with $41,667. Women with an educational attainment of graduate degree earn the most with the average annual earnings of $63,500, while those with college or associate's degree education have the smallest earnings of $27,250.
| Educational Attainment | Male Income | Female Income |
| Less than High School | $41,667 | $0 |
| High School Diploma | $54,063 | $0 |
| College or Associate's Degree | $51,750 | $27,250 |
| Bachelor's Degree | $81,136 | $45,729 |
| Graduate Degree | $103,036 | $63,500 |
| Total | $57,050 | $34,833 |
Family Income in Atkinson
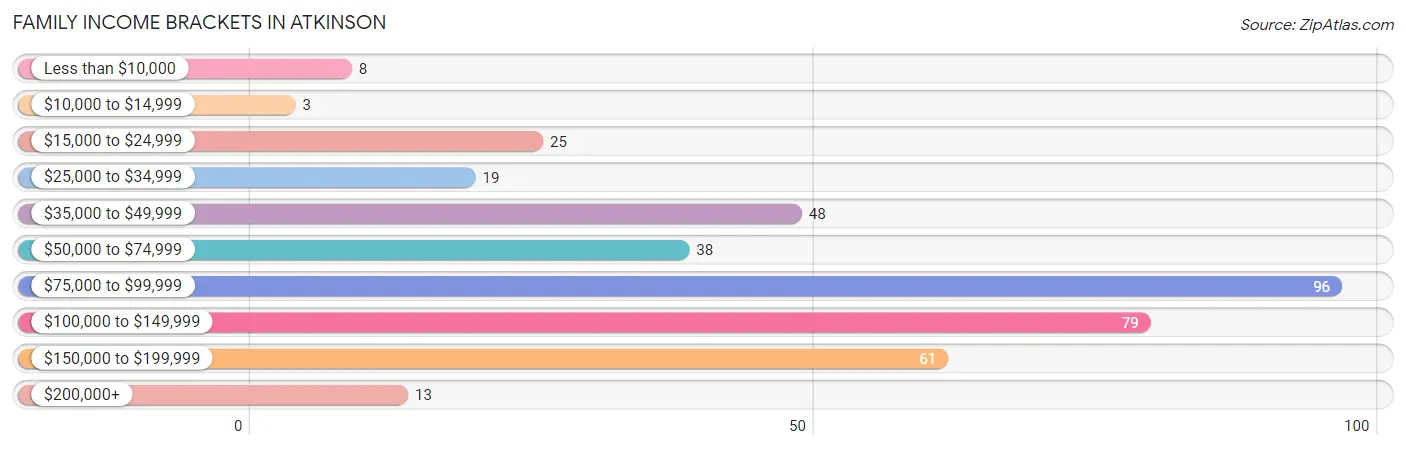
Family Income Brackets in Atkinson
According to the Atkinson family income data, there are 96 families falling into the $75,000 to $99,999 income range, which is the most common income bracket and makes up 24.6% of all families. Conversely, the $10,000 to $14,999 income bracket is the least frequent group with only 3 families (0.8%) belonging to this category.
| Income Bracket | # Families | % Families |
| Less than $10,000 | 8 | 2.1% |
| $10,000 to $14,999 | 3 | 0.8% |
| $15,000 to $24,999 | 25 | 6.4% |
| $25,000 to $34,999 | 19 | 4.9% |
| $35,000 to $49,999 | 48 | 12.3% |
| $50,000 to $74,999 | 38 | 9.7% |
| $75,000 to $99,999 | 96 | 24.6% |
| $100,000 to $149,999 | 79 | 20.3% |
| $150,000 to $199,999 | 61 | 15.6% |
| $200,000+ | 13 | 3.3% |
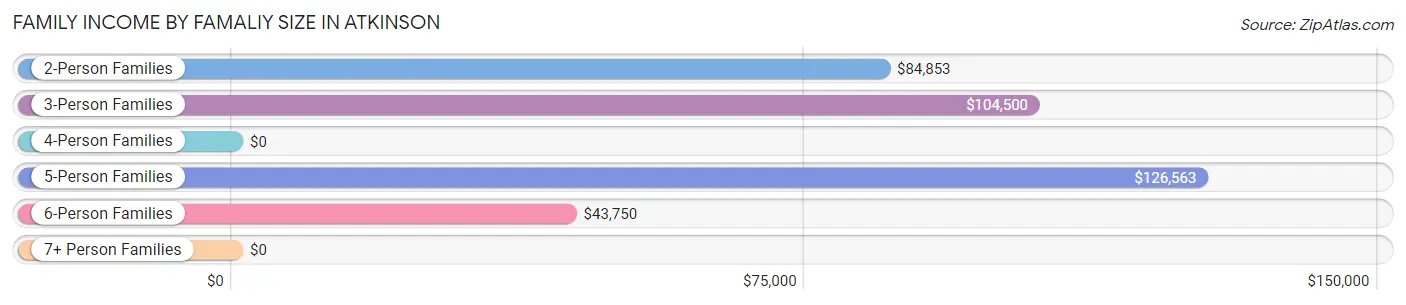
Family Income by Famaliy Size in Atkinson
5-person families (23 | 5.9%) account for the highest median family income in Atkinson with $126,563 per family, while 2-person families (234 | 60.0%) have the highest median income of $42,426 per family member.
| Income Bracket | # Families | Median Income |
| 2-Person Families | 234 (60.0%) | $84,853 |
| 3-Person Families | 76 (19.5%) | $104,500 |
| 4-Person Families | 11 (2.8%) | $0 |
| 5-Person Families | 23 (5.9%) | $126,563 |
| 6-Person Families | 20 (5.1%) | $43,750 |
| 7+ Person Families | 26 (6.7%) | $0 |
| Total | 390 (100.0%) | $86,395 |
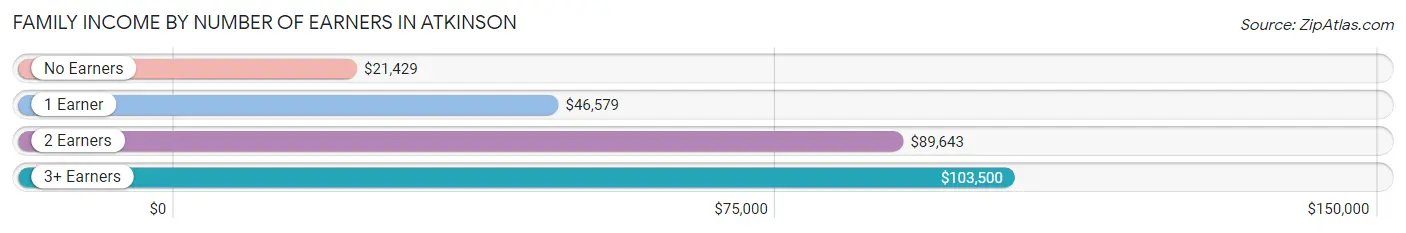
Family Income by Number of Earners in Atkinson
The median family income in Atkinson is $86,395, with families comprising 3+ earners (20) having the highest median family income of $103,500, while families with no earners (30) have the lowest median family income of $21,429, accounting for 5.1% and 7.7% of families, respectively.
| Number of Earners | # Families | Median Income |
| No Earners | 30 (7.7%) | $21,429 |
| 1 Earner | 112 (28.7%) | $46,579 |
| 2 Earners | 228 (58.5%) | $89,643 |
| 3+ Earners | 20 (5.1%) | $103,500 |
| Total | 390 (100.0%) | $86,395 |
Household Income in Atkinson
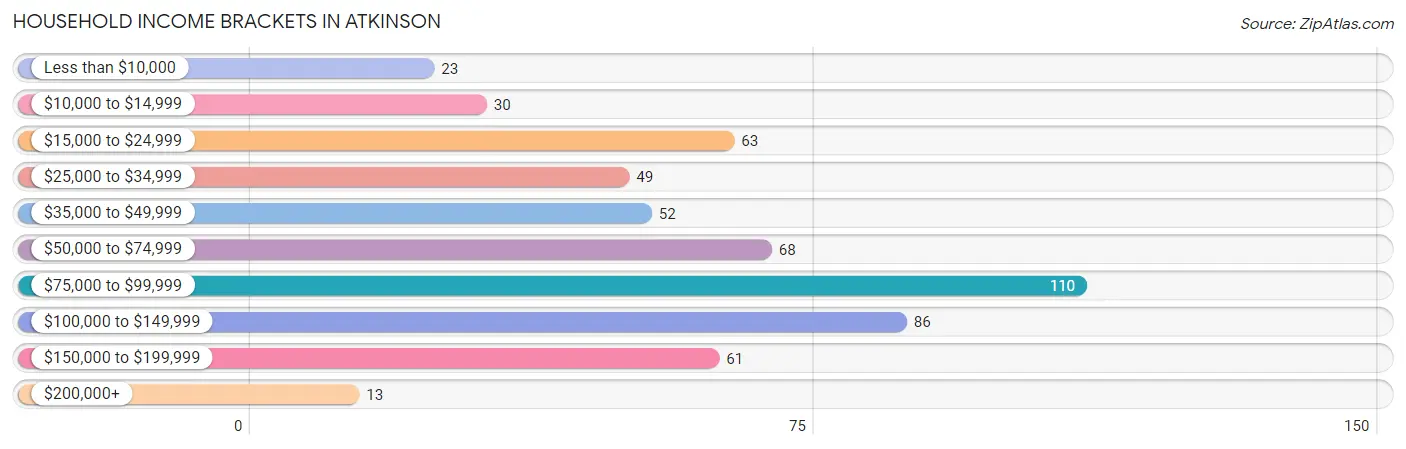
Household Income Brackets in Atkinson
With 110 households falling in the category, the $75,000 to $99,999 income range is the most frequent in Atkinson, accounting for 19.8% of all households. In contrast, only 13 households (2.3%) fall into the $200,000+ income bracket, making it the least populous group.
| Income Bracket | # Households | % Households |
| Less than $10,000 | 23 | 4.1% |
| $10,000 to $14,999 | 30 | 5.4% |
| $15,000 to $24,999 | 63 | 11.4% |
| $25,000 to $34,999 | 49 | 8.8% |
| $35,000 to $49,999 | 52 | 9.4% |
| $50,000 to $74,999 | 68 | 12.3% |
| $75,000 to $99,999 | 110 | 19.8% |
| $100,000 to $149,999 | 86 | 15.5% |
| $150,000 to $199,999 | 61 | 11.0% |
| $200,000+ | 13 | 2.3% |
Household Income by Householder Age in Atkinson
The median household income in Atkinson is $72,656, with the highest median household income of $112,500 found in the 15 to 24 years age bracket for the primary householder. A total of 14 households (2.5%) fall into this category. Meanwhile, the 65+ years age bracket for the primary householder has the lowest median household income of $34,342, with 226 households (40.7%) in this group.
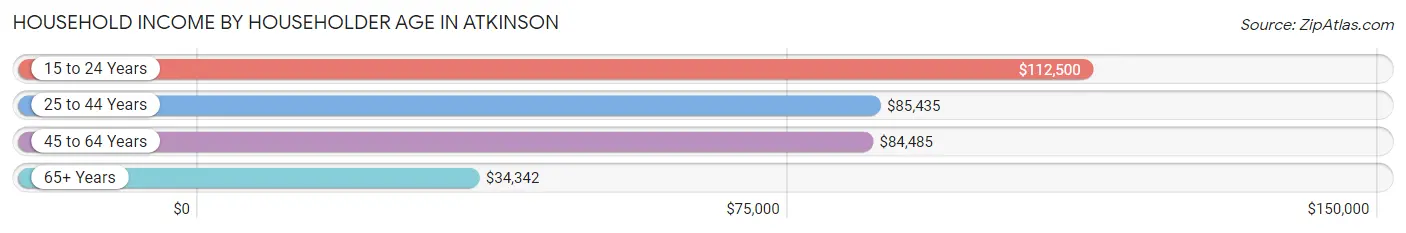
| Income Bracket | # Households | Median Income |
| 15 to 24 Years | 14 (2.5%) | $112,500 |
| 25 to 44 Years | 164 (29.5%) | $85,435 |
| 45 to 64 Years | 151 (27.2%) | $84,485 |
| 65+ Years | 226 (40.7%) | $34,342 |
| Total | 555 (100.0%) | $72,656 |
Poverty in Atkinson
Income Below Poverty by Sex and Age in Atkinson
With 9.2% poverty level for males and 6.1% for females among the residents of Atkinson, 16 and 17 year old males and 18 to 24 year old females are the most vulnerable to poverty, with 5 males (100.0%) and 6 females (16.7%) in their respective age groups living below the poverty level.
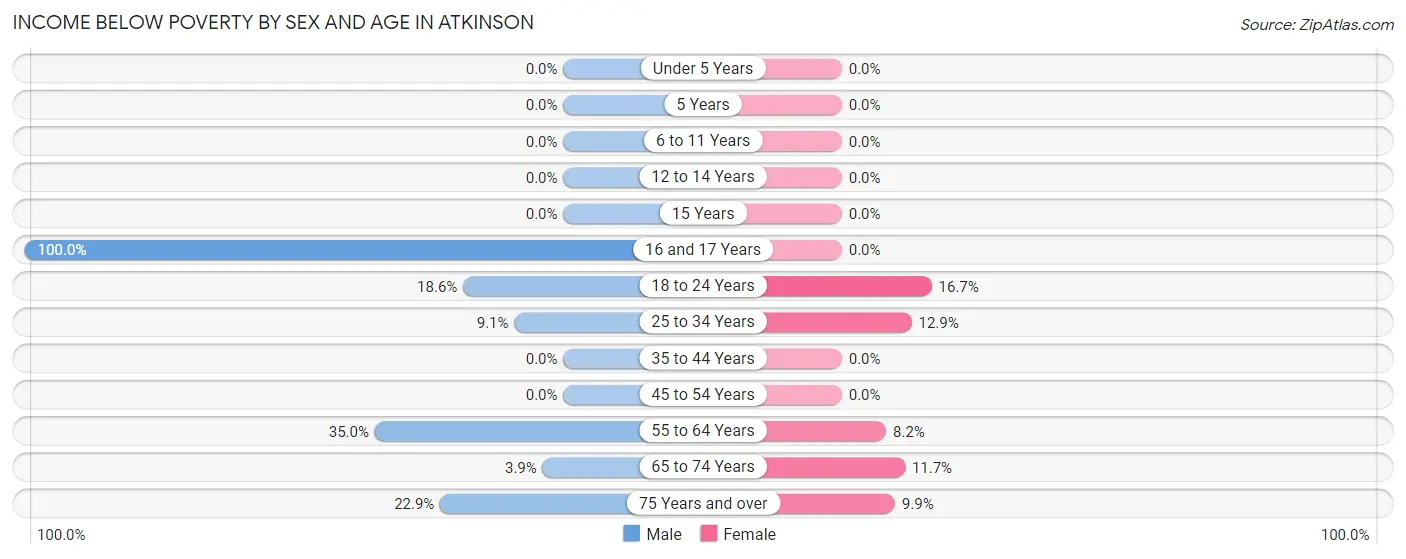
| Age Bracket | Male | Female |
| Under 5 Years | 0 (0.0%) | 0 (0.0%) |
| 5 Years | 0 (0.0%) | 0 (0.0%) |
| 6 to 11 Years | 0 (0.0%) | 0 (0.0%) |
| 12 to 14 Years | 0 (0.0%) | 0 (0.0%) |
| 15 Years | 0 (0.0%) | 0 (0.0%) |
| 16 and 17 Years | 5 (100.0%) | 0 (0.0%) |
| 18 to 24 Years | 8 (18.6%) | 6 (16.7%) |
| 25 to 34 Years | 7 (9.1%) | 11 (12.9%) |
| 35 to 44 Years | 0 (0.0%) | 0 (0.0%) |
| 45 to 54 Years | 0 (0.0%) | 0 (0.0%) |
| 55 to 64 Years | 28 (35.0%) | 6 (8.2%) |
| 65 to 74 Years | 4 (3.8%) | 15 (11.7%) |
| 75 Years and over | 8 (22.9%) | 7 (9.9%) |
| Total | 60 (9.2%) | 45 (6.1%) |
Income Above Poverty by Sex and Age in Atkinson
According to the poverty statistics in Atkinson, males aged under 5 years and females aged under 5 years are the age groups that are most secure financially, with 100.0% of males and 100.0% of females in these age groups living above the poverty line.
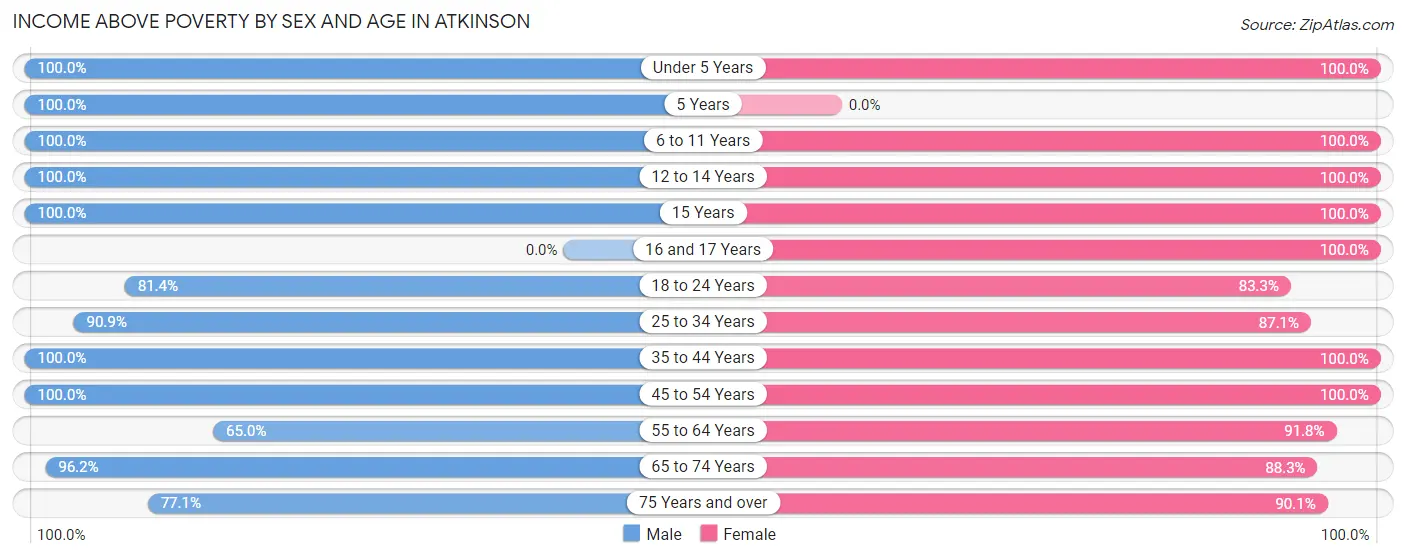
| Age Bracket | Male | Female |
| Under 5 Years | 83 (100.0%) | 37 (100.0%) |
| 5 Years | 5 (100.0%) | 0 (0.0%) |
| 6 to 11 Years | 51 (100.0%) | 120 (100.0%) |
| 12 to 14 Years | 36 (100.0%) | 48 (100.0%) |
| 15 Years | 5 (100.0%) | 1 (100.0%) |
| 16 and 17 Years | 0 (0.0%) | 8 (100.0%) |
| 18 to 24 Years | 35 (81.4%) | 30 (83.3%) |
| 25 to 34 Years | 70 (90.9%) | 74 (87.1%) |
| 35 to 44 Years | 66 (100.0%) | 78 (100.0%) |
| 45 to 54 Years | 63 (100.0%) | 48 (100.0%) |
| 55 to 64 Years | 52 (65.0%) | 67 (91.8%) |
| 65 to 74 Years | 100 (96.2%) | 113 (88.3%) |
| 75 Years and over | 27 (77.1%) | 64 (90.1%) |
| Total | 593 (90.8%) | 688 (93.9%) |
Income Below Poverty Among Married-Couple Families in Atkinson
The poverty statistics for married-couple families in Atkinson show that 5.6% or 18 of the total 324 families live below the poverty line. Families with no children have the highest poverty rate of 7.0%, comprising of 14 families. On the other hand, families with 3 or 4 children have the lowest poverty rate of 0.0%, which includes 0 families.
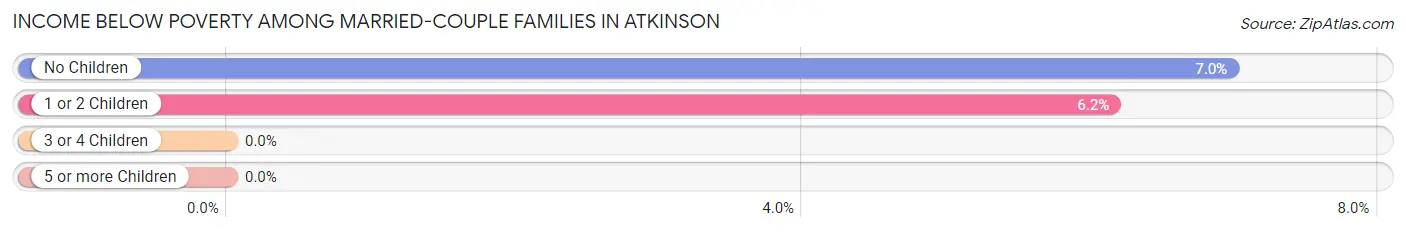
| Children | Above Poverty | Below Poverty |
| No Children | 187 (93.0%) | 14 (7.0%) |
| 1 or 2 Children | 61 (93.9%) | 4 (6.1%) |
| 3 or 4 Children | 32 (100.0%) | 0 (0.0%) |
| 5 or more Children | 26 (100.0%) | 0 (0.0%) |
| Total | 306 (94.4%) | 18 (5.6%) |
Income Below Poverty Among Single-Parent Households in Atkinson
| Children | Single Father | Single Mother |
| No Children | 0 (0.0%) | 0 (0.0%) |
| 1 or 2 Children | 0 (0.0%) | 0 (0.0%) |
| 3 or 4 Children | 0 (0.0%) | 0 (0.0%) |
| 5 or more Children | 0 (0.0%) | 0 (0.0%) |
| Total | 0 (0.0%) | 0 (0.0%) |
Income Below Poverty Among Married-Couple vs Single-Parent Households in Atkinson
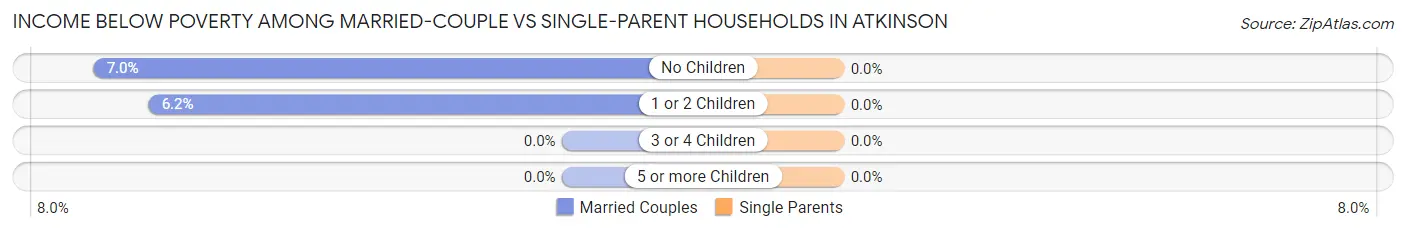
| Children | Married-Couple Families | Single-Parent Households |
| No Children | 14 (7.0%) | 0 (0.0%) |
| 1 or 2 Children | 4 (6.1%) | 0 (0.0%) |
| 3 or 4 Children | 0 (0.0%) | 0 (0.0%) |
| 5 or more Children | 0 (0.0%) | 0 (0.0%) |
| Total | 18 (5.6%) | 0 (0.0%) |
Race in Atkinson
The most populous races in Atkinson are White / Caucasian (1,371 | 96.1%), Hispanic or Latino (25 | 1.8%), and Some other Race (23 | 1.6%).
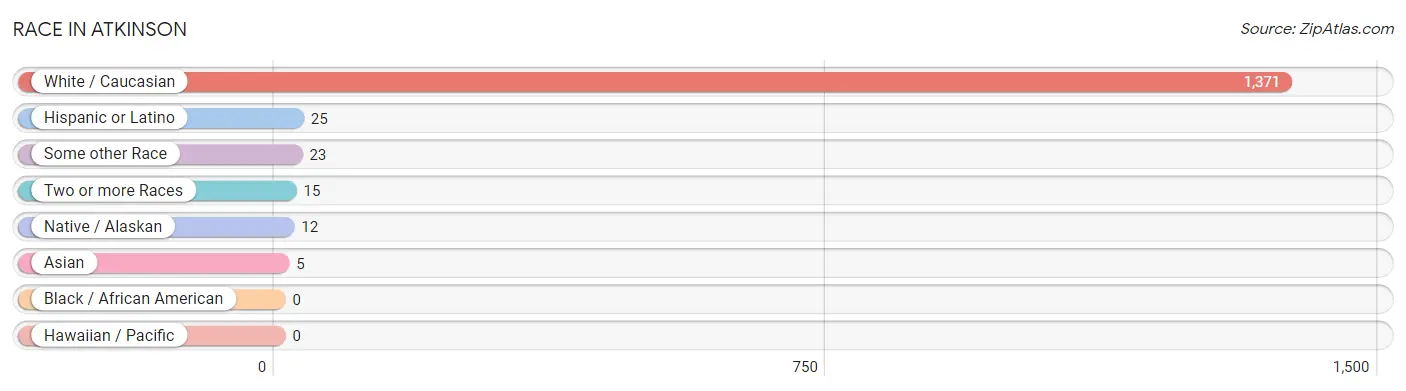
| Race | # Population | % Population |
| Asian | 5 | 0.4% |
| Black / African American | 0 | 0.0% |
| Hawaiian / Pacific | 0 | 0.0% |
| Hispanic or Latino | 25 | 1.8% |
| Native / Alaskan | 12 | 0.8% |
| White / Caucasian | 1,371 | 96.1% |
| Two or more Races | 15 | 1.1% |
| Some other Race | 23 | 1.6% |
| Total | 1,426 | 100.0% |
Ancestry in Atkinson
The most populous ancestries reported in Atkinson are German (631 | 44.3%), Irish (167 | 11.7%), English (96 | 6.7%), American (52 | 3.6%), and Czech (40 | 2.8%), together accounting for 69.2% of all Atkinson residents.
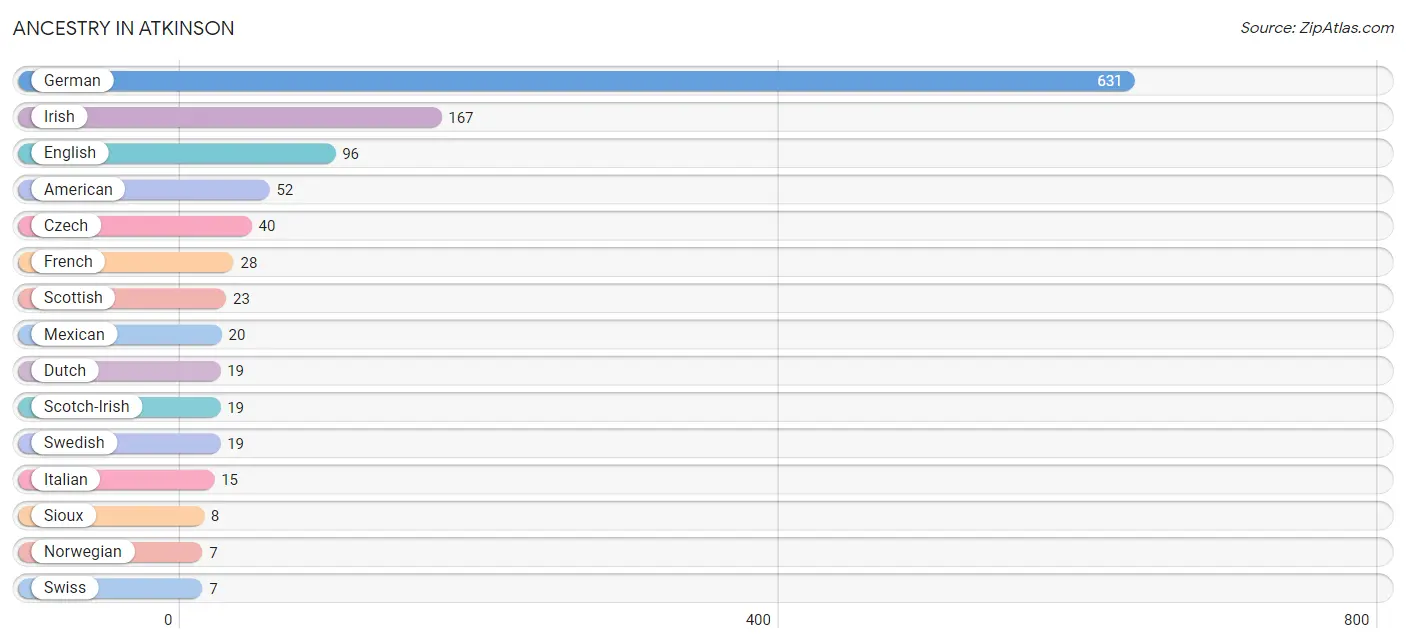
| Ancestry | # Population | % Population |
| American | 52 | 3.6% |
| Creek | 4 | 0.3% |
| Czech | 40 | 2.8% |
| Danish | 2 | 0.1% |
| Dutch | 19 | 1.3% |
| Eastern European | 3 | 0.2% |
| English | 96 | 6.7% |
| European | 5 | 0.4% |
| French | 28 | 2.0% |
| French Canadian | 2 | 0.1% |
| German | 631 | 44.3% |
| Greek | 3 | 0.2% |
| Indian (Asian) | 5 | 0.4% |
| Irish | 167 | 11.7% |
| Italian | 15 | 1.1% |
| Mexican | 20 | 1.4% |
| Norwegian | 7 | 0.5% |
| Polish | 5 | 0.4% |
| Puerto Rican | 3 | 0.2% |
| Scotch-Irish | 19 | 1.3% |
| Scottish | 23 | 1.6% |
| Sioux | 8 | 0.6% |
| Spaniard | 2 | 0.1% |
| Swedish | 19 | 1.3% |
| Swiss | 7 | 0.5% |
| Ukrainian | 3 | 0.2% |
| Welsh | 6 | 0.4% | View All 27 Rows |
Immigrants in Atkinson
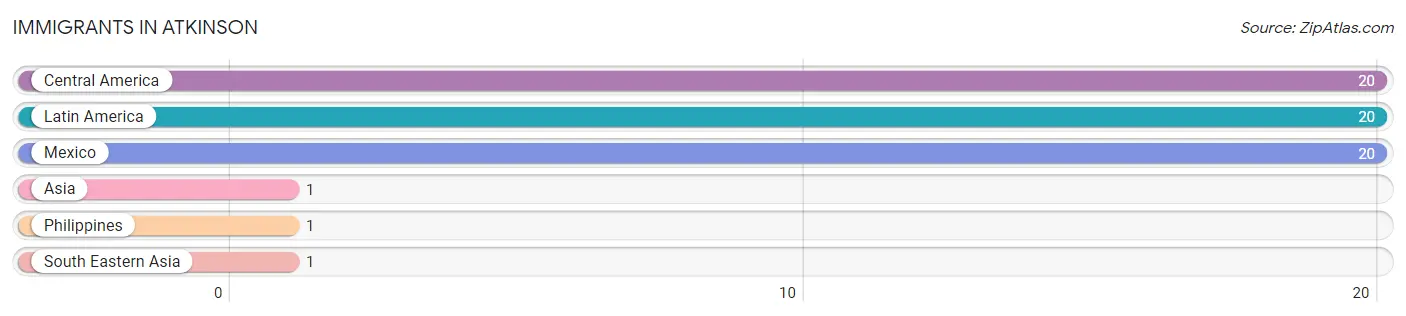
The most numerous immigrant groups reported in Atkinson came from Central America (20 | 1.4%), Latin America (20 | 1.4%), Mexico (20 | 1.4%), Asia (1 | 0.1%), and Philippines (1 | 0.1%), together accounting for 4.3% of all Atkinson residents.
| Immigration Origin | # Population | % Population |
| Asia | 1 | 0.1% |
| Central America | 20 | 1.4% |
| Latin America | 20 | 1.4% |
| Mexico | 20 | 1.4% |
| Philippines | 1 | 0.1% |
| South Eastern Asia | 1 | 0.1% | View All 6 Rows |
Sex and Age in Atkinson
Sex and Age in Atkinson
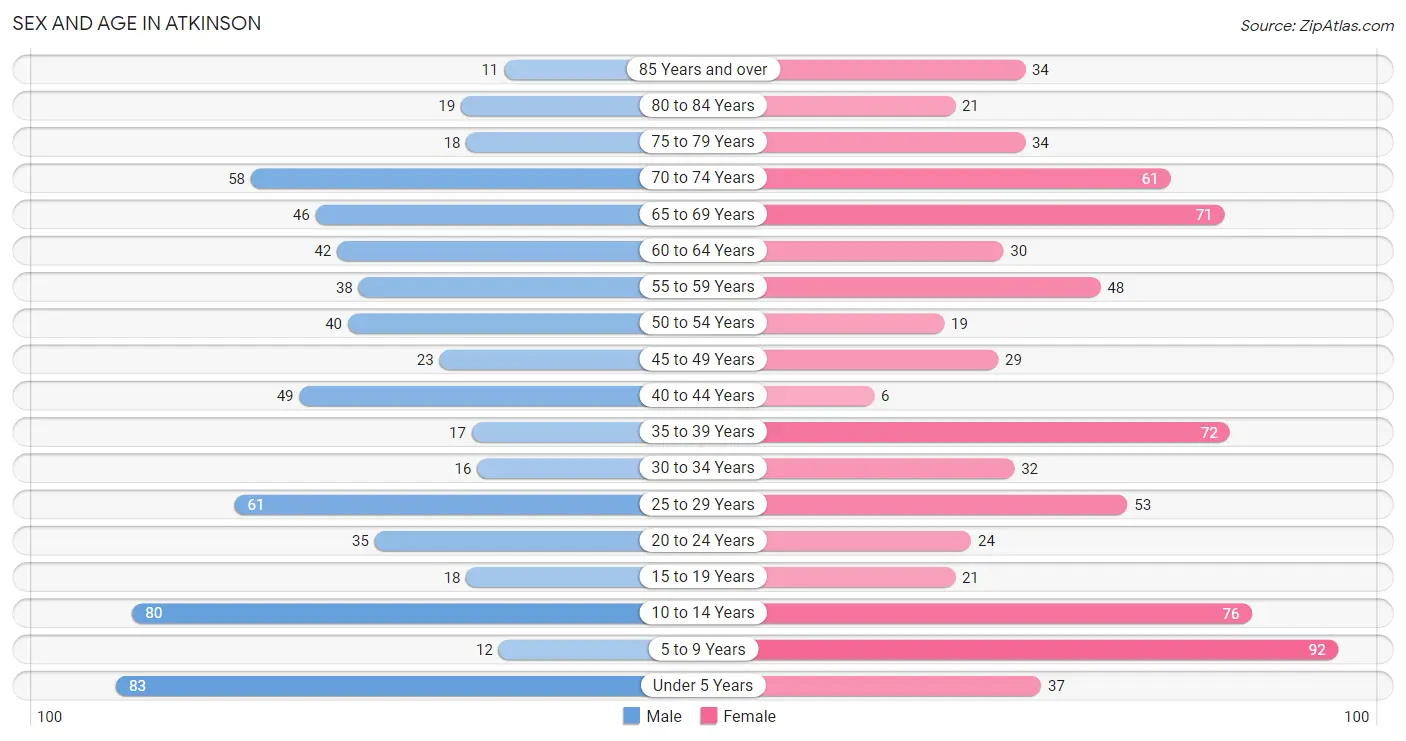
The most populous age groups in Atkinson are Under 5 Years (83 | 12.5%) for men and 5 to 9 Years (92 | 12.1%) for women.
| Age Bracket | Male | Female |
| Under 5 Years | 83 (12.5%) | 37 (4.9%) |
| 5 to 9 Years | 12 (1.8%) | 92 (12.1%) |
| 10 to 14 Years | 80 (12.0%) | 76 (10.0%) |
| 15 to 19 Years | 18 (2.7%) | 21 (2.8%) |
| 20 to 24 Years | 35 (5.3%) | 24 (3.2%) |
| 25 to 29 Years | 61 (9.2%) | 53 (7.0%) |
| 30 to 34 Years | 16 (2.4%) | 32 (4.2%) |
| 35 to 39 Years | 17 (2.5%) | 72 (9.5%) |
| 40 to 44 Years | 49 (7.4%) | 6 (0.8%) |
| 45 to 49 Years | 23 (3.5%) | 29 (3.8%) |
| 50 to 54 Years | 40 (6.0%) | 19 (2.5%) |
| 55 to 59 Years | 38 (5.7%) | 48 (6.3%) |
| 60 to 64 Years | 42 (6.3%) | 30 (4.0%) |
| 65 to 69 Years | 46 (6.9%) | 71 (9.3%) |
| 70 to 74 Years | 58 (8.7%) | 61 (8.0%) |
| 75 to 79 Years | 18 (2.7%) | 34 (4.5%) |
| 80 to 84 Years | 19 (2.9%) | 21 (2.8%) |
| 85 Years and over | 11 (1.7%) | 34 (4.5%) |
| Total | 666 (100.0%) | 760 (100.0%) |
Families and Households in Atkinson
Median Family Size in Atkinson
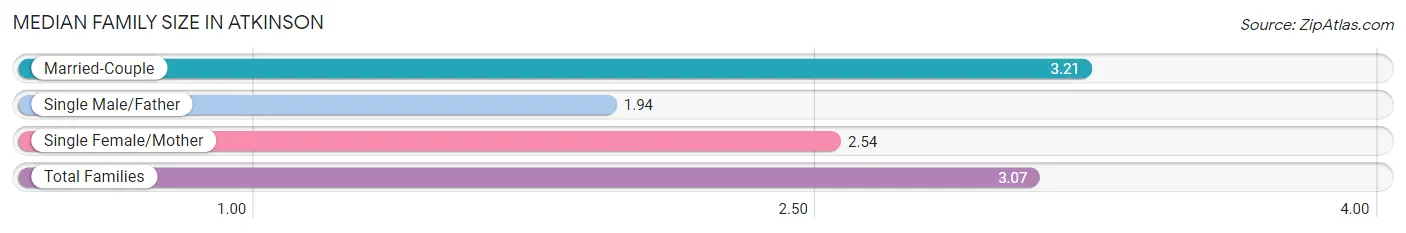
The median family size in Atkinson is 3.07 persons per family, with married-couple families (324 | 83.1%) accounting for the largest median family size of 3.21 persons per family. On the other hand, single male/father families (16 | 4.1%) represent the smallest median family size with 1.94 persons per family.
| Family Type | # Families | Family Size |
| Married-Couple | 324 (83.1%) | 3.21 |
| Single Male/Father | 16 (4.1%) | 1.94 |
| Single Female/Mother | 50 (12.8%) | 2.54 |
| Total Families | 390 (100.0%) | 3.07 |
Median Household Size in Atkinson
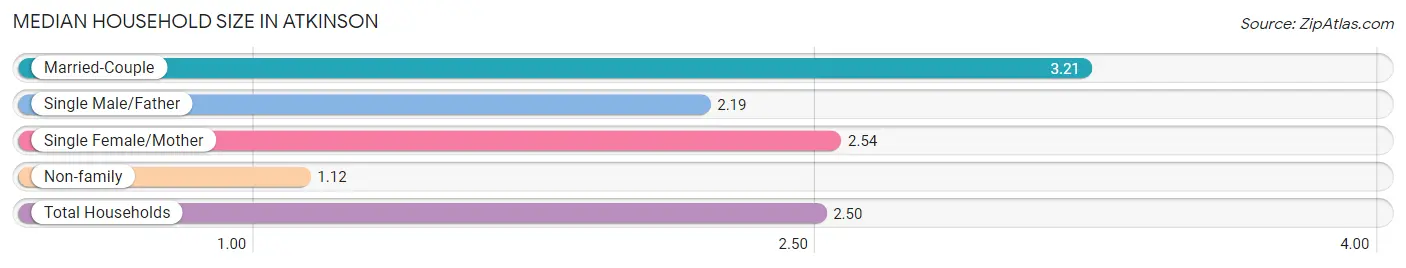
The median household size in Atkinson is 2.50 persons per household, with married-couple households (324 | 58.4%) accounting for the largest median household size of 3.21 persons per household. non-family households (165 | 29.7%) represent the smallest median household size with 1.12 persons per household.
| Household Type | # Households | Household Size |
| Married-Couple | 324 (58.4%) | 3.21 |
| Single Male/Father | 16 (2.9%) | 2.19 |
| Single Female/Mother | 50 (9.0%) | 2.54 |
| Non-family | 165 (29.7%) | 1.12 |
| Total Households | 555 (100.0%) | 2.50 |
Household Size by Marriage Status in Atkinson
Out of a total of 555 households in Atkinson, 390 (70.3%) are family households, while 165 (29.7%) are nonfamily households. The most numerous type of family households are 2-person households, comprising 227, and the most common type of nonfamily households are 1-person households, comprising 142.
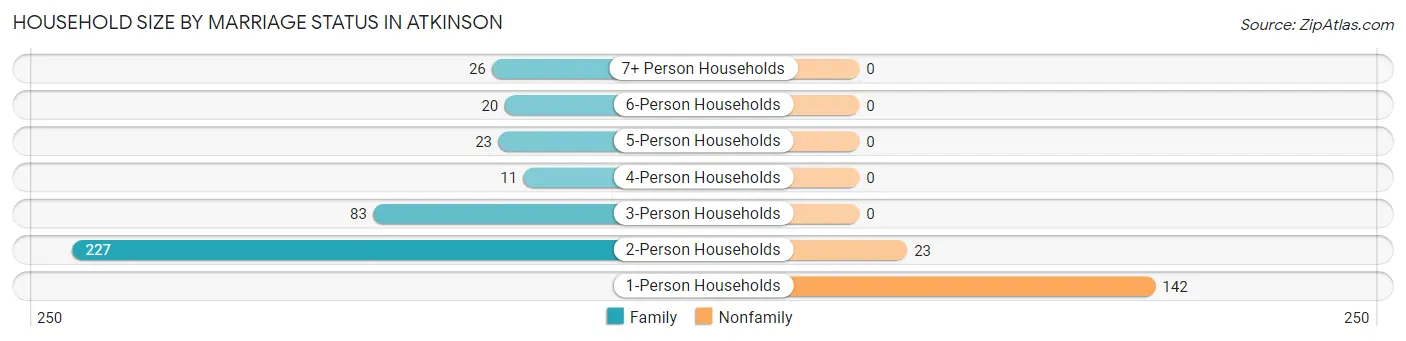
| Household Size | Family Households | Nonfamily Households |
| 1-Person Households | - | 142 (25.6%) |
| 2-Person Households | 227 (40.9%) | 23 (4.1%) |
| 3-Person Households | 83 (14.9%) | 0 (0.0%) |
| 4-Person Households | 11 (2.0%) | 0 (0.0%) |
| 5-Person Households | 23 (4.1%) | 0 (0.0%) |
| 6-Person Households | 20 (3.6%) | 0 (0.0%) |
| 7+ Person Households | 26 (4.7%) | 0 (0.0%) |
| Total | 390 (70.3%) | 165 (29.7%) |
Female Fertility in Atkinson
Fertility by Age in Atkinson
Average fertility rate in Atkinson is 25.0 births per 1,000 women. Women in the age bracket of 20 to 34 years have the highest fertility rate with 55.0 births per 1,000 women. Women in the age bracket of 20 to 34 years acount for 100.0% of all women with births.
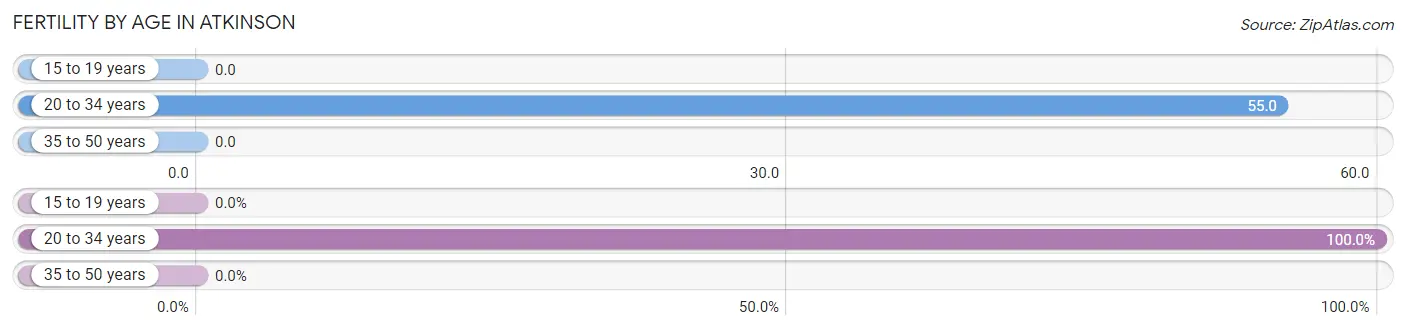
| Age Bracket | Women with Births | Births / 1,000 Women |
| 15 to 19 years | 0 (0.0%) | 0.0 |
| 20 to 34 years | 6 (100.0%) | 55.0 |
| 35 to 50 years | 0 (0.0%) | 0.0 |
| Total | 6 (100.0%) | 25.0 |
Fertility by Age by Marriage Status in Atkinson
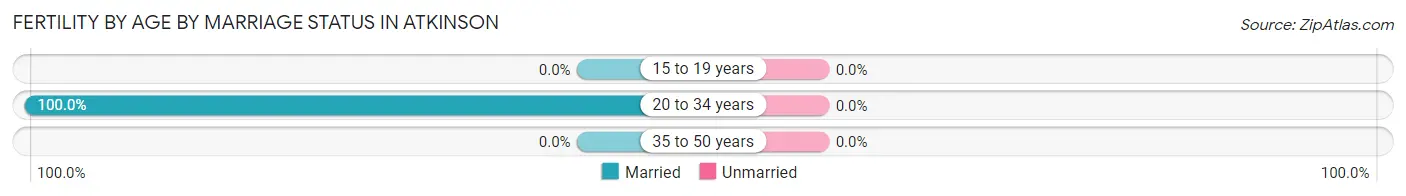
| Age Bracket | Married | Unmarried |
| 15 to 19 years | 0 (0.0%) | 0 (0.0%) |
| 20 to 34 years | 6 (100.0%) | 0 (0.0%) |
| 35 to 50 years | 0 (0.0%) | 0 (0.0%) |
| Total | 6 (100.0%) | 0 (0.0%) |
Fertility by Education in Atkinson
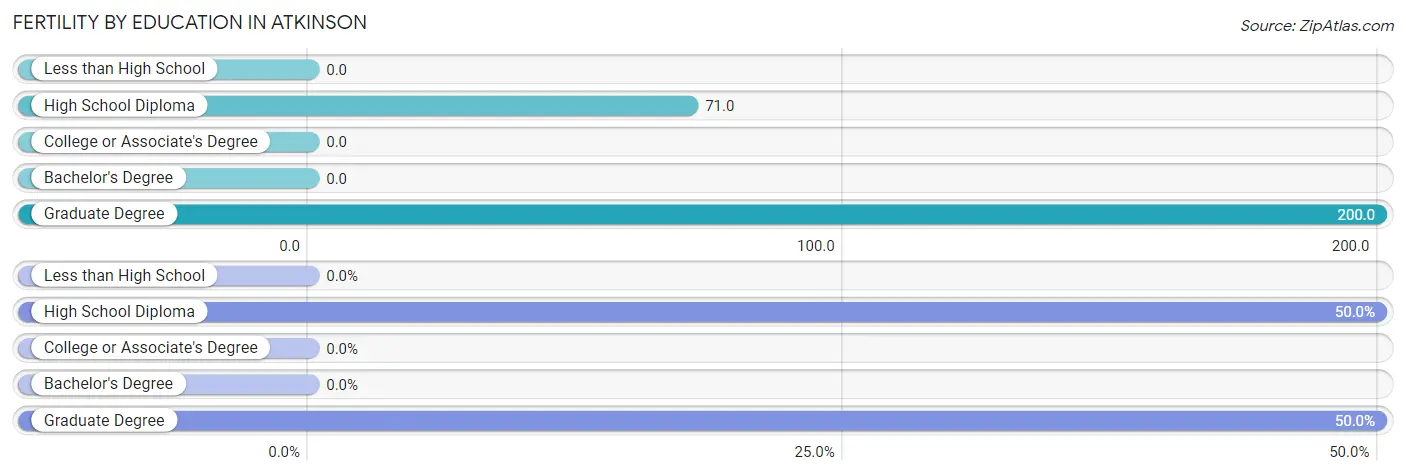
| Educational Attainment | Women with Births | Births / 1,000 Women |
| Less than High School | 0 (0.0%) | 0.0 |
| High School Diploma | 3 (50.0%) | 71.0 |
| College or Associate's Degree | 0 (0.0%) | 0.0 |
| Bachelor's Degree | 0 (0.0%) | 0.0 |
| Graduate Degree | 3 (50.0%) | 200.0 |
| Total | 6 (100.0%) | 25.0 |
Fertility by Education by Marriage Status in Atkinson
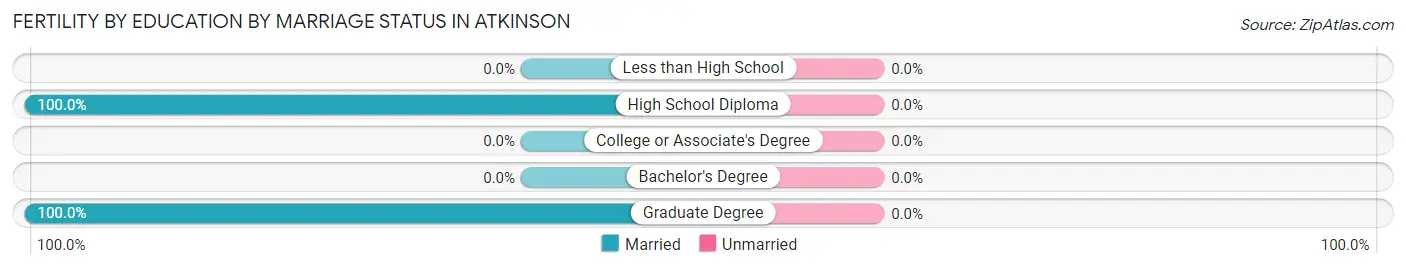
| Educational Attainment | Married | Unmarried |
| Less than High School | 0 (0.0%) | 0 (0.0%) |
| High School Diploma | 3 (100.0%) | 0 (0.0%) |
| College or Associate's Degree | 0 (0.0%) | 0 (0.0%) |
| Bachelor's Degree | 0 (0.0%) | 0 (0.0%) |
| Graduate Degree | 3 (100.0%) | 0 (0.0%) |
| Total | 6 (100.0%) | 0 (0.0%) |
Employment Characteristics in Atkinson
Employment by Class of Employer in Atkinson
Among the 695 employed individuals in Atkinson, private company employees (444 | 63.9%), self-employed (not incorporated) (86 | 12.4%), and local government employees (61 | 8.8%) make up the most common classes of employment.
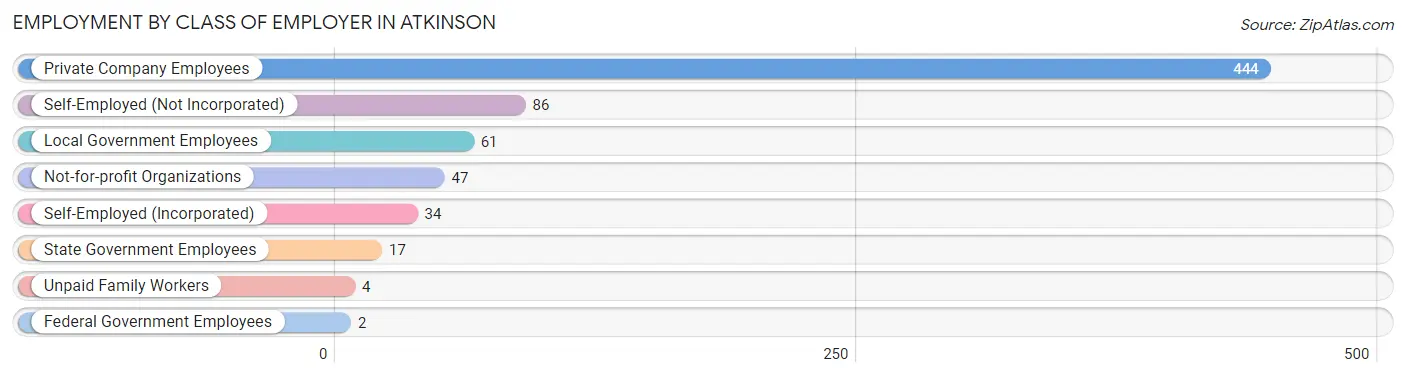
| Employer Class | # Employees | % Employees |
| Private Company Employees | 444 | 63.9% |
| Self-Employed (Incorporated) | 34 | 4.9% |
| Self-Employed (Not Incorporated) | 86 | 12.4% |
| Not-for-profit Organizations | 47 | 6.8% |
| Local Government Employees | 61 | 8.8% |
| State Government Employees | 17 | 2.5% |
| Federal Government Employees | 2 | 0.3% |
| Unpaid Family Workers | 4 | 0.6% |
| Total | 695 | 100.0% |
Employment Status by Age in Atkinson
According to the labor force statistics for Atkinson, out of the total population over 16 years of age (1,040), 69.9% or 727 individuals are in the labor force, with 4.4% or 32 of them unemployed. The age group with the highest labor force participation rate is 20 to 24 years, with 100.0% or 59 individuals in the labor force. Within the labor force, the 16 to 19 years age range has the highest percentage of unemployed individuals, with 35.3% or 6 of them being unemployed.
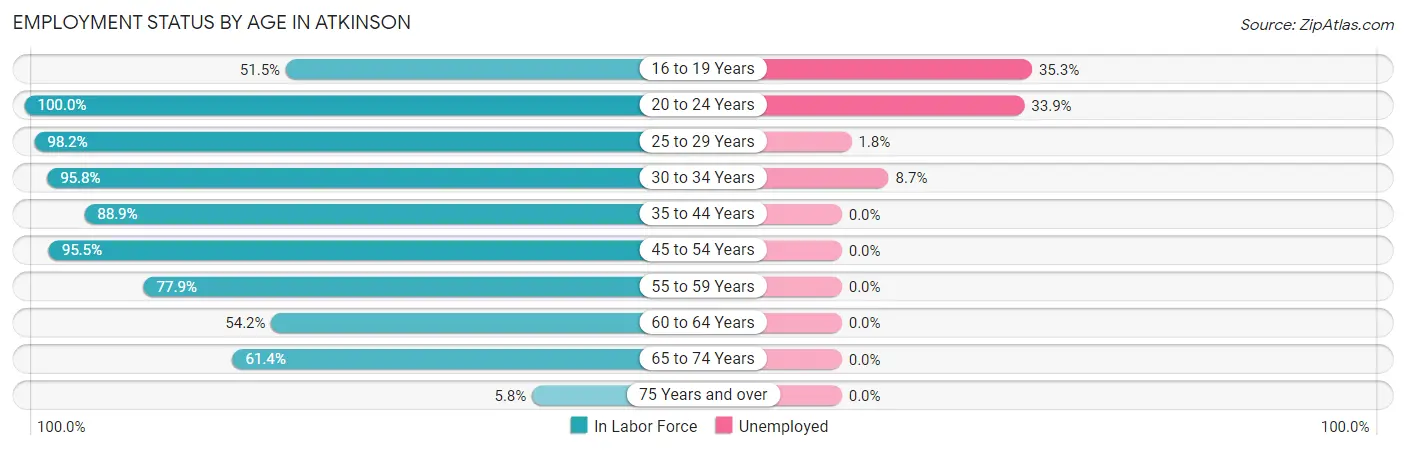
| Age Bracket | In Labor Force | Unemployed |
| 16 to 19 Years | 17 (51.5%) | 6 (35.3%) |
| 20 to 24 Years | 59 (100.0%) | 20 (33.9%) |
| 25 to 29 Years | 112 (98.2%) | 2 (1.8%) |
| 30 to 34 Years | 46 (95.8%) | 4 (8.7%) |
| 35 to 44 Years | 128 (88.9%) | 0 (0.0%) |
| 45 to 54 Years | 106 (95.5%) | 0 (0.0%) |
| 55 to 59 Years | 67 (77.9%) | 0 (0.0%) |
| 60 to 64 Years | 39 (54.2%) | 0 (0.0%) |
| 65 to 74 Years | 145 (61.4%) | 0 (0.0%) |
| 75 Years and over | 8 (5.8%) | 0 (0.0%) |
| Total | 727 (69.9%) | 32 (4.4%) |
Employment Status by Educational Attainment in Atkinson
According to labor force statistics for Atkinson, 86.6% of individuals (498) out of the total population between 25 and 64 years of age (575) are in the labor force, with 1.2% or 6 of them being unemployed. The group with the highest labor force participation rate are those with the educational attainment of less than high school, with 100.0% or 11 individuals in the labor force. Within the labor force, individuals with high school diploma education have the highest percentage of unemployment, with 6.4% or 6 of them being unemployed.
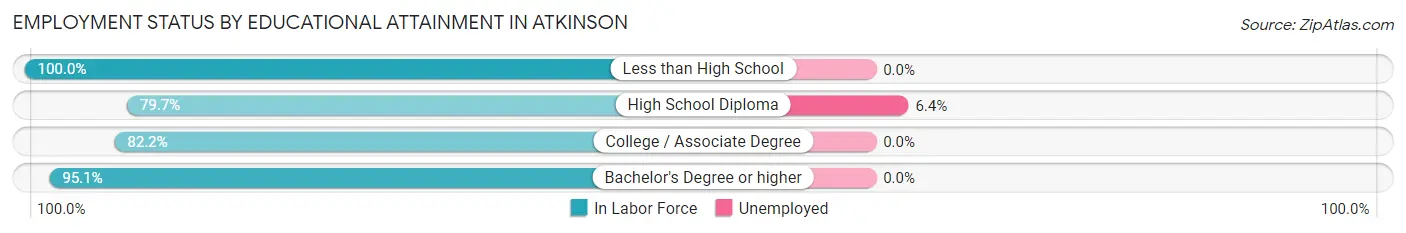
| Educational Attainment | In Labor Force | Unemployed |
| Less than High School | 11 (100.0%) | 0 (0.0%) |
| High School Diploma | 94 (79.7%) | 8 (6.4%) |
| College / Associate Degree | 198 (82.2%) | 0 (0.0%) |
| Bachelor's Degree or higher | 195 (95.1%) | 0 (0.0%) |
| Total | 498 (86.6%) | 7 (1.2%) |
Employment Occupations by Sex in Atkinson
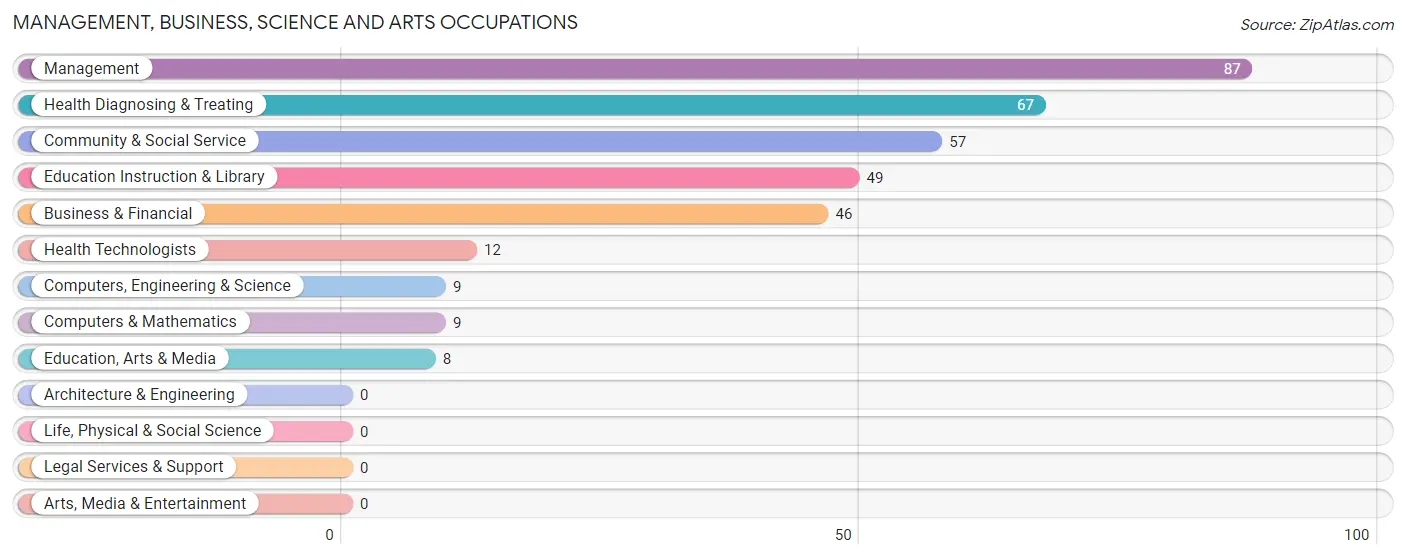
Management, Business, Science and Arts Occupations
The most common Management, Business, Science and Arts occupations in Atkinson are Management (87 | 12.5%), Health Diagnosing & Treating (67 | 9.6%), Community & Social Service (57 | 8.2%), Education Instruction & Library (49 | 7.0%), and Business & Financial (46 | 6.6%).
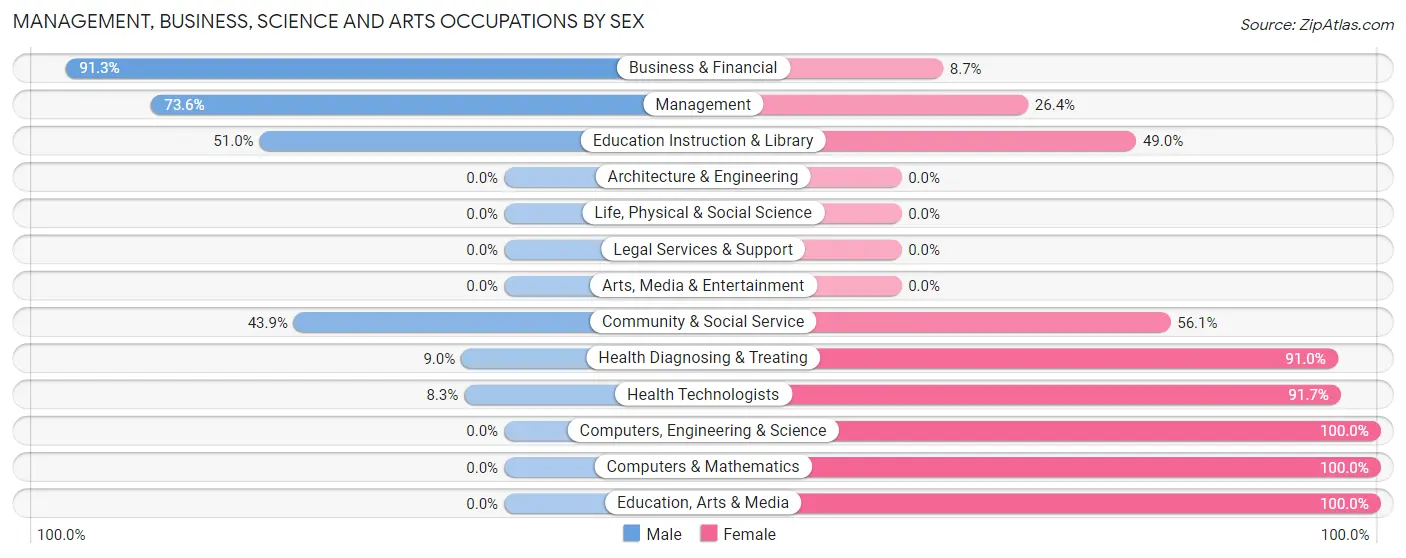
Management, Business, Science and Arts Occupations by Sex
Within the Management, Business, Science and Arts occupations in Atkinson, the most male-oriented occupations are Business & Financial (91.3%), Management (73.6%), and Education Instruction & Library (51.0%), while the most female-oriented occupations are Computers, Engineering & Science (100.0%), Computers & Mathematics (100.0%), and Education, Arts & Media (100.0%).
| Occupation | Male | Female |
| Management | 64 (73.6%) | 23 (26.4%) |
| Business & Financial | 42 (91.3%) | 4 (8.7%) |
| Computers, Engineering & Science | 0 (0.0%) | 9 (100.0%) |
| Computers & Mathematics | 0 (0.0%) | 9 (100.0%) |
| Architecture & Engineering | 0 (0.0%) | 0 (0.0%) |
| Life, Physical & Social Science | 0 (0.0%) | 0 (0.0%) |
| Community & Social Service | 25 (43.9%) | 32 (56.1%) |
| Education, Arts & Media | 0 (0.0%) | 8 (100.0%) |
| Legal Services & Support | 0 (0.0%) | 0 (0.0%) |
| Education Instruction & Library | 25 (51.0%) | 24 (49.0%) |
| Arts, Media & Entertainment | 0 (0.0%) | 0 (0.0%) |
| Health Diagnosing & Treating | 6 (9.0%) | 61 (91.0%) |
| Health Technologists | 1 (8.3%) | 11 (91.7%) |
| Total (Category) | 137 (51.5%) | 129 (48.5%) |
| Total (Overall) | 363 (52.2%) | 332 (47.8%) |
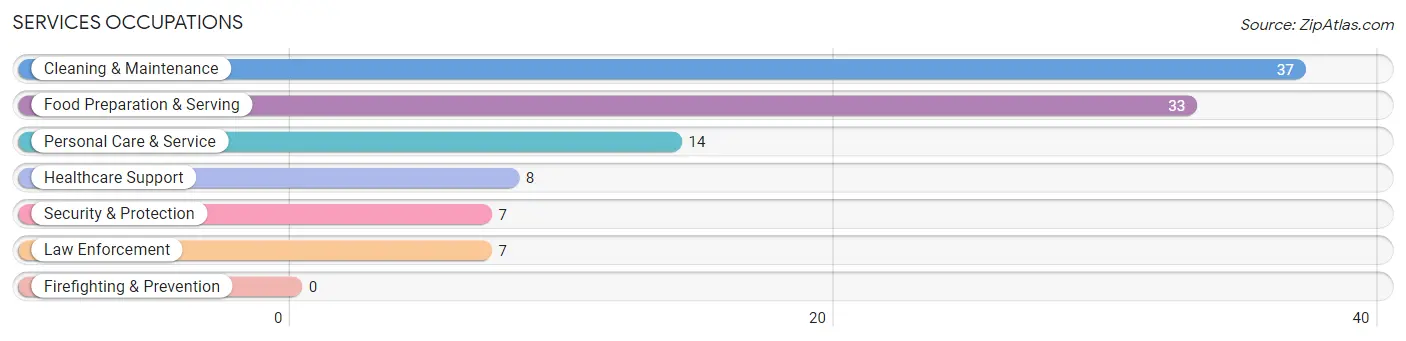
Services Occupations
The most common Services occupations in Atkinson are Cleaning & Maintenance (37 | 5.3%), Food Preparation & Serving (33 | 4.8%), Personal Care & Service (14 | 2.0%), Healthcare Support (8 | 1.1%), and Security & Protection (7 | 1.0%).
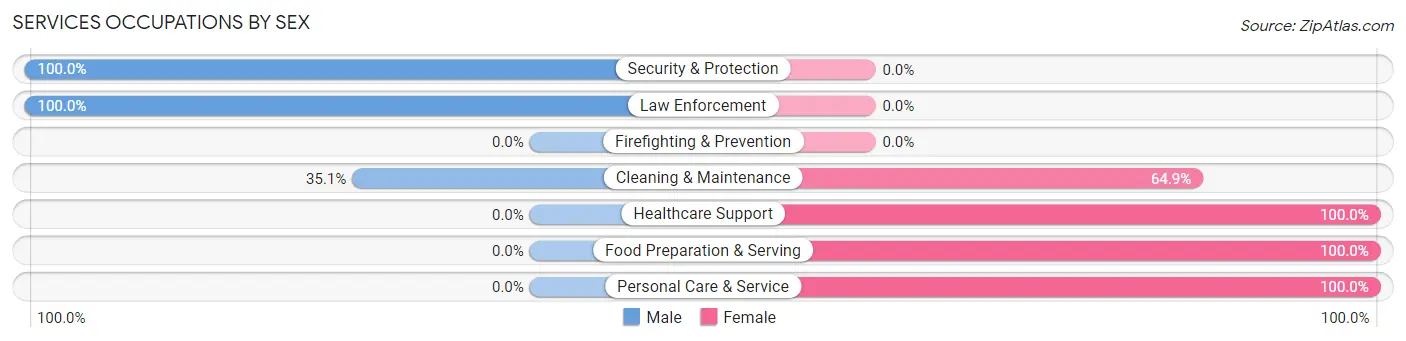
Services Occupations by Sex
Within the Services occupations in Atkinson, the most male-oriented occupations are Security & Protection (100.0%), Law Enforcement (100.0%), and Cleaning & Maintenance (35.1%), while the most female-oriented occupations are Healthcare Support (100.0%), Food Preparation & Serving (100.0%), and Personal Care & Service (100.0%).
| Occupation | Male | Female |
| Healthcare Support | 0 (0.0%) | 8 (100.0%) |
| Security & Protection | 7 (100.0%) | 0 (0.0%) |
| Firefighting & Prevention | 0 (0.0%) | 0 (0.0%) |
| Law Enforcement | 7 (100.0%) | 0 (0.0%) |
| Food Preparation & Serving | 0 (0.0%) | 33 (100.0%) |
| Cleaning & Maintenance | 13 (35.1%) | 24 (64.9%) |
| Personal Care & Service | 0 (0.0%) | 14 (100.0%) |
| Total (Category) | 20 (20.2%) | 79 (79.8%) |
| Total (Overall) | 363 (52.2%) | 332 (47.8%) |
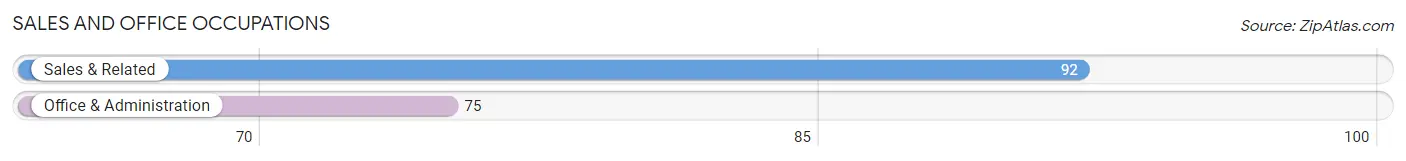
Sales and Office Occupations
The most common Sales and Office occupations in Atkinson are Sales & Related (92 | 13.2%), and Office & Administration (75 | 10.8%).
Sales and Office Occupations by Sex
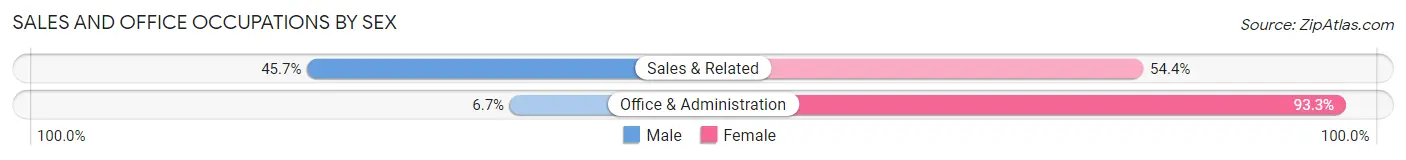
| Occupation | Male | Female |
| Sales & Related | 42 (45.7%) | 50 (54.3%) |
| Office & Administration | 5 (6.7%) | 70 (93.3%) |
| Total (Category) | 47 (28.1%) | 120 (71.9%) |
| Total (Overall) | 363 (52.2%) | 332 (47.8%) |
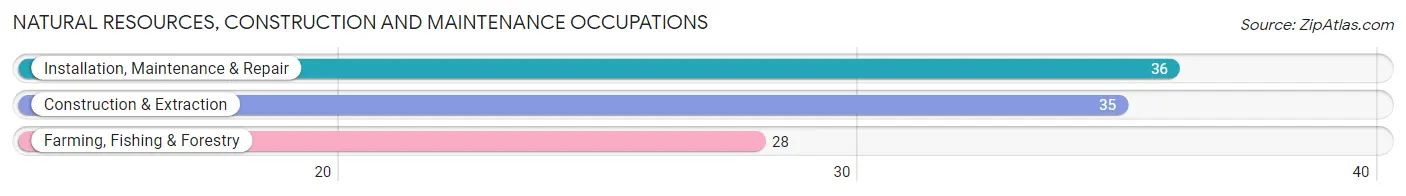
Natural Resources, Construction and Maintenance Occupations
The most common Natural Resources, Construction and Maintenance occupations in Atkinson are Installation, Maintenance & Repair (36 | 5.2%), Construction & Extraction (35 | 5.0%), and Farming, Fishing & Forestry (28 | 4.0%).
Natural Resources, Construction and Maintenance Occupations by Sex
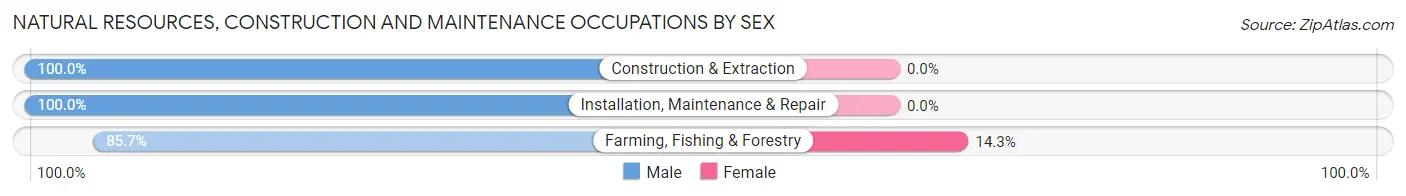
| Occupation | Male | Female |
| Farming, Fishing & Forestry | 24 (85.7%) | 4 (14.3%) |
| Construction & Extraction | 35 (100.0%) | 0 (0.0%) |
| Installation, Maintenance & Repair | 36 (100.0%) | 0 (0.0%) |
| Total (Category) | 95 (96.0%) | 4 (4.0%) |
| Total (Overall) | 363 (52.2%) | 332 (47.8%) |
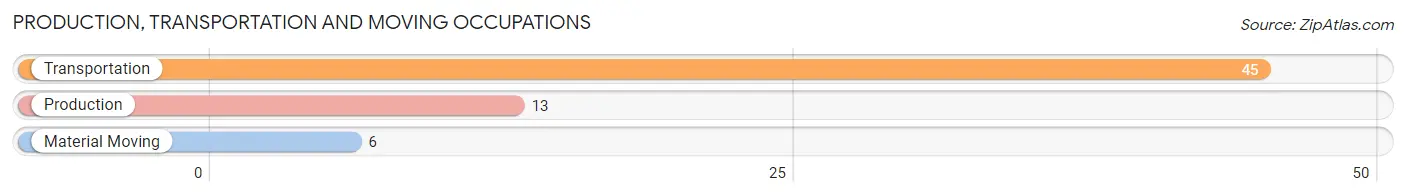
Production, Transportation and Moving Occupations
The most common Production, Transportation and Moving occupations in Atkinson are Transportation (45 | 6.5%), Production (13 | 1.9%), and Material Moving (6 | 0.9%).
Production, Transportation and Moving Occupations by Sex
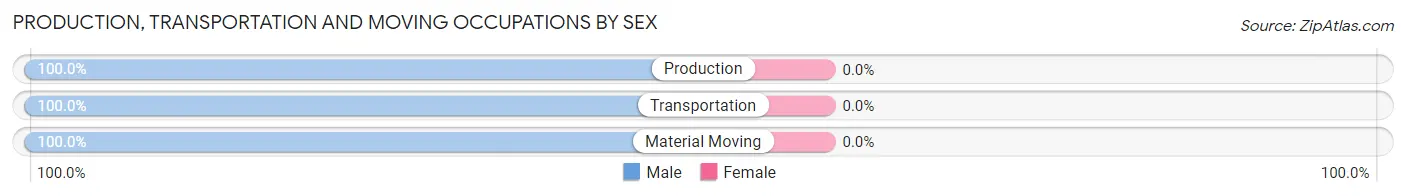
| Occupation | Male | Female |
| Production | 13 (100.0%) | 0 (0.0%) |
| Transportation | 45 (100.0%) | 0 (0.0%) |
| Material Moving | 6 (100.0%) | 0 (0.0%) |
| Total (Category) | 64 (100.0%) | 0 (0.0%) |
| Total (Overall) | 363 (52.2%) | 332 (47.8%) |
Employment Industries by Sex in Atkinson
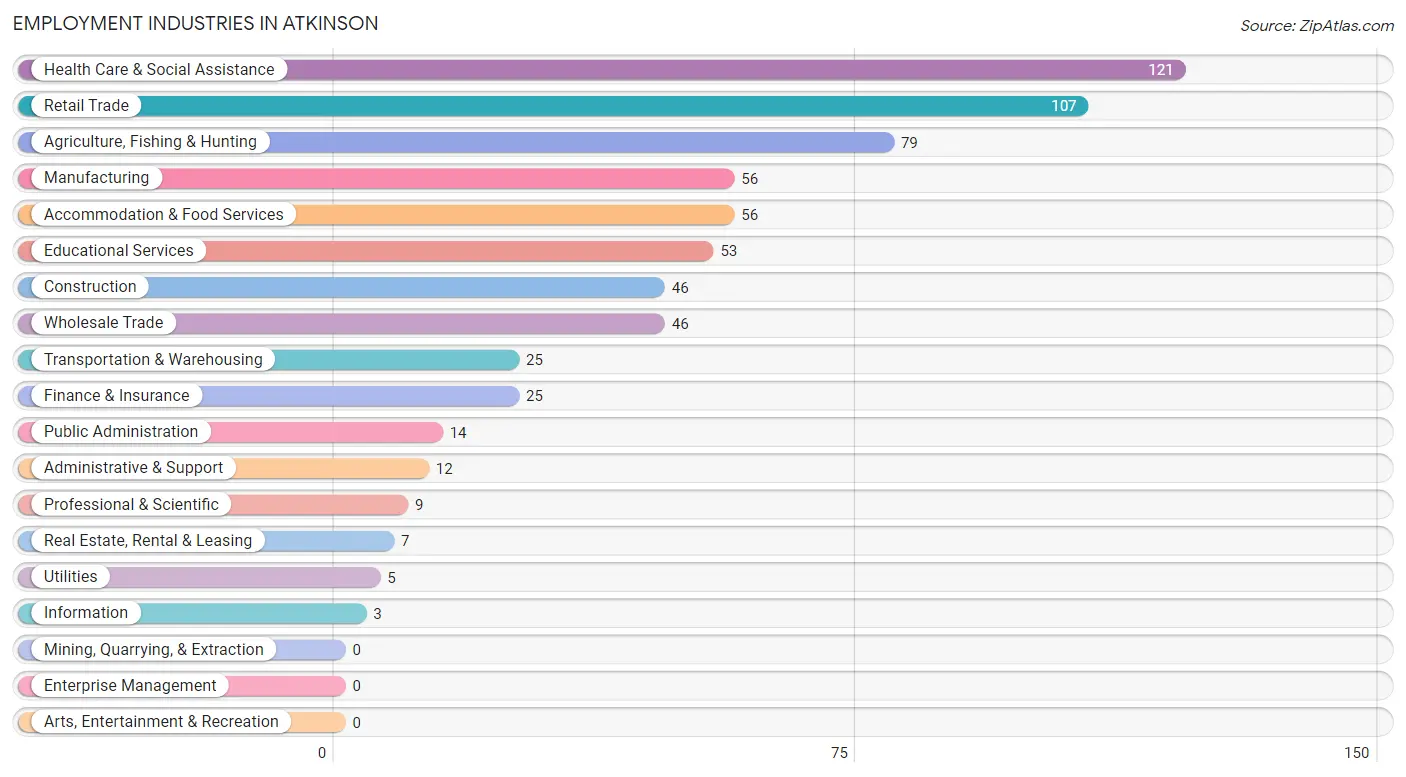
Employment Industries in Atkinson
The major employment industries in Atkinson include Health Care & Social Assistance (121 | 17.4%), Retail Trade (107 | 15.4%), Agriculture, Fishing & Hunting (79 | 11.4%), Manufacturing (56 | 8.1%), and Accommodation & Food Services (56 | 8.1%).
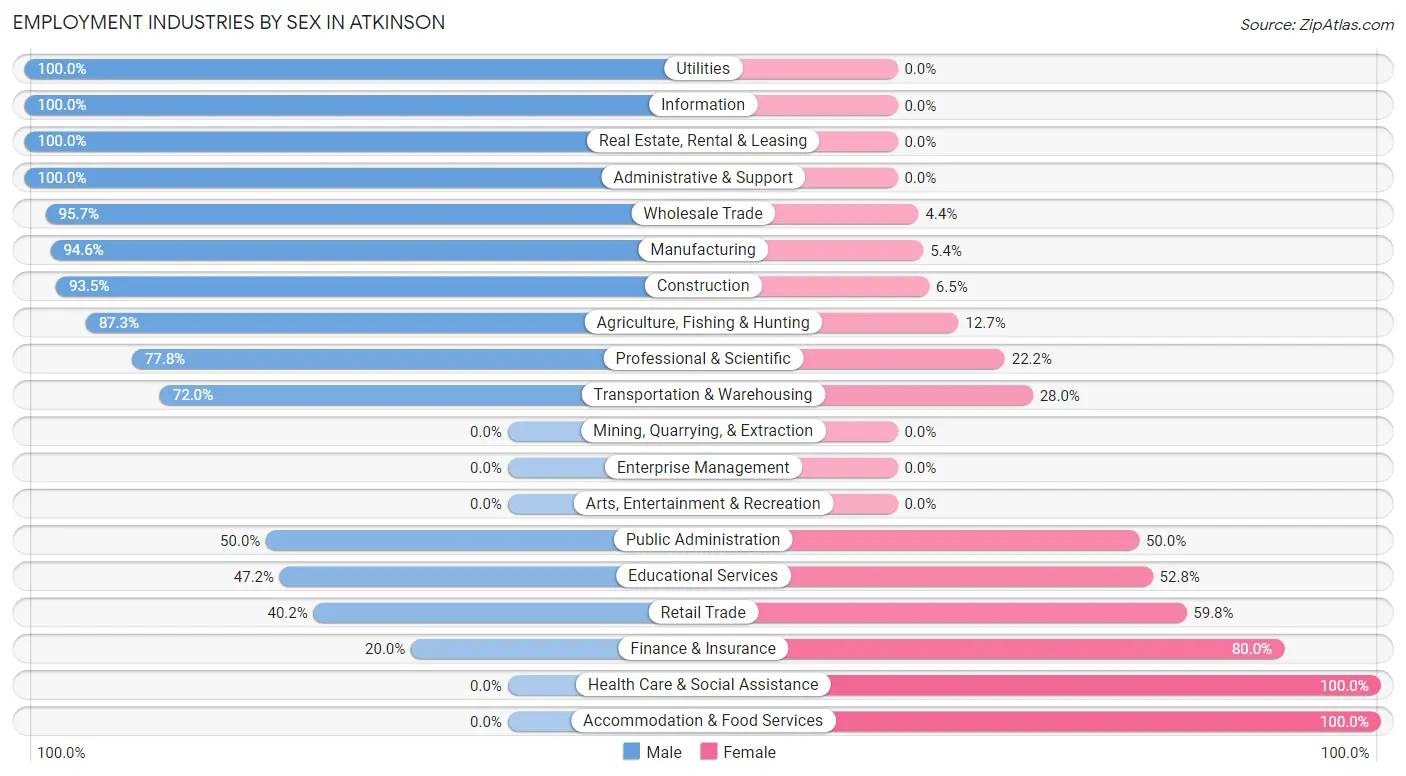
Employment Industries by Sex in Atkinson
The Atkinson industries that see more men than women are Utilities (100.0%), Information (100.0%), and Real Estate, Rental & Leasing (100.0%), whereas the industries that tend to have a higher number of women are Health Care & Social Assistance (100.0%), Accommodation & Food Services (100.0%), and Finance & Insurance (80.0%).
| Industry | Male | Female |
| Agriculture, Fishing & Hunting | 69 (87.3%) | 10 (12.7%) |
| Mining, Quarrying, & Extraction | 0 (0.0%) | 0 (0.0%) |
| Construction | 43 (93.5%) | 3 (6.5%) |
| Manufacturing | 53 (94.6%) | 3 (5.4%) |
| Wholesale Trade | 44 (95.7%) | 2 (4.3%) |
| Retail Trade | 43 (40.2%) | 64 (59.8%) |
| Transportation & Warehousing | 18 (72.0%) | 7 (28.0%) |
| Utilities | 5 (100.0%) | 0 (0.0%) |
| Information | 3 (100.0%) | 0 (0.0%) |
| Finance & Insurance | 5 (20.0%) | 20 (80.0%) |
| Real Estate, Rental & Leasing | 7 (100.0%) | 0 (0.0%) |
| Professional & Scientific | 7 (77.8%) | 2 (22.2%) |
| Enterprise Management | 0 (0.0%) | 0 (0.0%) |
| Administrative & Support | 12 (100.0%) | 0 (0.0%) |
| Educational Services | 25 (47.2%) | 28 (52.8%) |
| Health Care & Social Assistance | 0 (0.0%) | 121 (100.0%) |
| Arts, Entertainment & Recreation | 0 (0.0%) | 0 (0.0%) |
| Accommodation & Food Services | 0 (0.0%) | 56 (100.0%) |
| Public Administration | 7 (50.0%) | 7 (50.0%) |
| Total | 363 (52.2%) | 332 (47.8%) |
Education in Atkinson
School Enrollment in Atkinson
The most common levels of schooling among the 357 students in Atkinson are middle school (134 | 37.5%), elementary school (91 | 25.5%), and high school (50 | 14.0%).
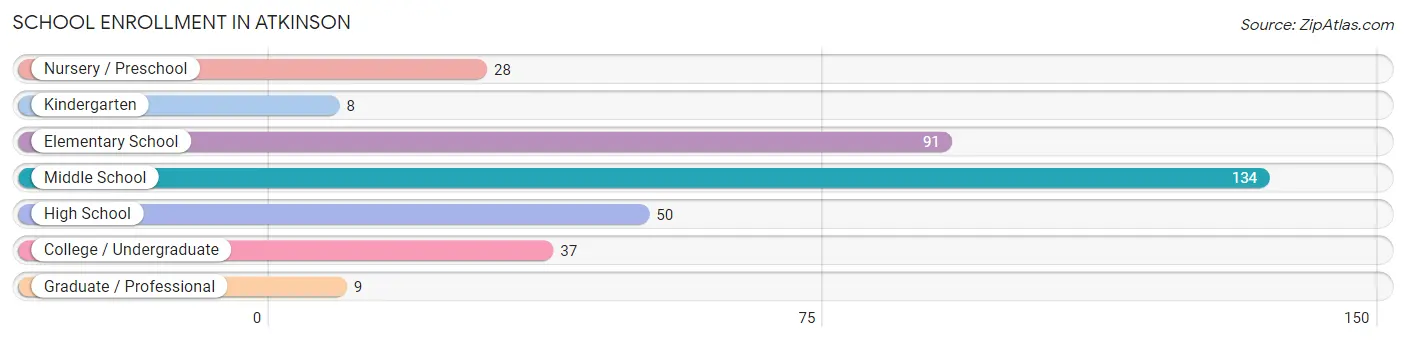
| School Level | # Students | % Students |
| Nursery / Preschool | 28 | 7.8% |
| Kindergarten | 8 | 2.2% |
| Elementary School | 91 | 25.5% |
| Middle School | 134 | 37.5% |
| High School | 50 | 14.0% |
| College / Undergraduate | 37 | 10.4% |
| Graduate / Professional | 9 | 2.5% |
| Total | 357 | 100.0% |
School Enrollment by Age by Funding Source in Atkinson
Out of a total of 357 students who are enrolled in schools in Atkinson, 81 (22.7%) attend a private institution, while the remaining 276 (77.3%) are enrolled in public schools. The age group of 5 to 9 year old has the highest likelihood of being enrolled in private schools, with 65 (65.0% in the age bracket) enrolled. Conversely, the age group of 3 to 4 year olds has the lowest likelihood of being enrolled in a private school, with 23 (100.0% in the age bracket) attending a public institution.
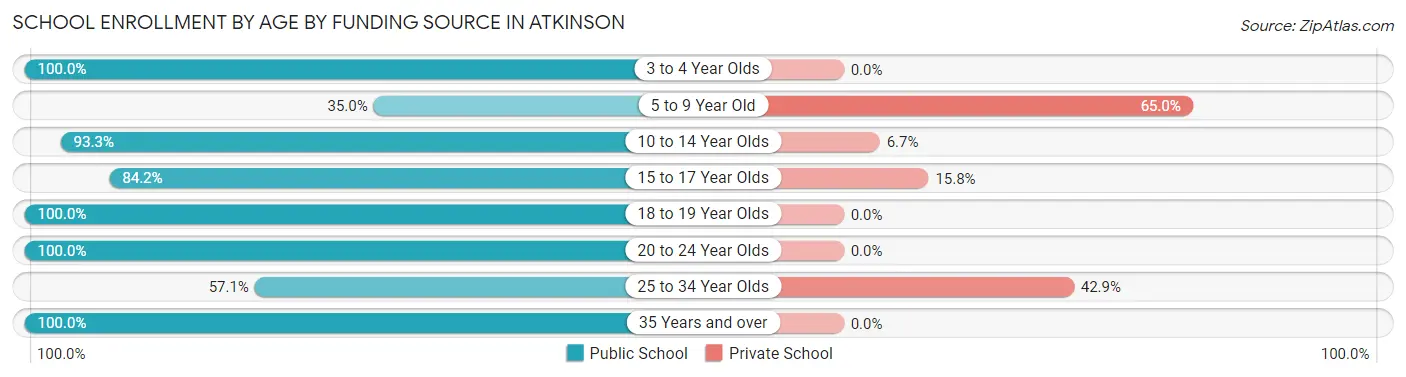
| Age Bracket | Public School | Private School |
| 3 to 4 Year Olds | 23 (100.0%) | 0 (0.0%) |
| 5 to 9 Year Old | 35 (35.0%) | 65 (65.0%) |
| 10 to 14 Year Olds | 139 (93.3%) | 10 (6.7%) |
| 15 to 17 Year Olds | 16 (84.2%) | 3 (15.8%) |
| 18 to 19 Year Olds | 20 (100.0%) | 0 (0.0%) |
| 20 to 24 Year Olds | 23 (100.0%) | 0 (0.0%) |
| 25 to 34 Year Olds | 4 (57.1%) | 3 (42.9%) |
| 35 Years and over | 16 (100.0%) | 0 (0.0%) |
| Total | 276 (77.3%) | 81 (22.7%) |
Educational Attainment by Field of Study in Atkinson
Bio, nature & agricultural (72 | 22.0%), education (63 | 19.2%), science & technology (56 | 17.1%), business (48 | 14.6%), and arts & humanities (24 | 7.3%) are the most common fields of study among 328 individuals in Atkinson who have obtained a bachelor's degree or higher.
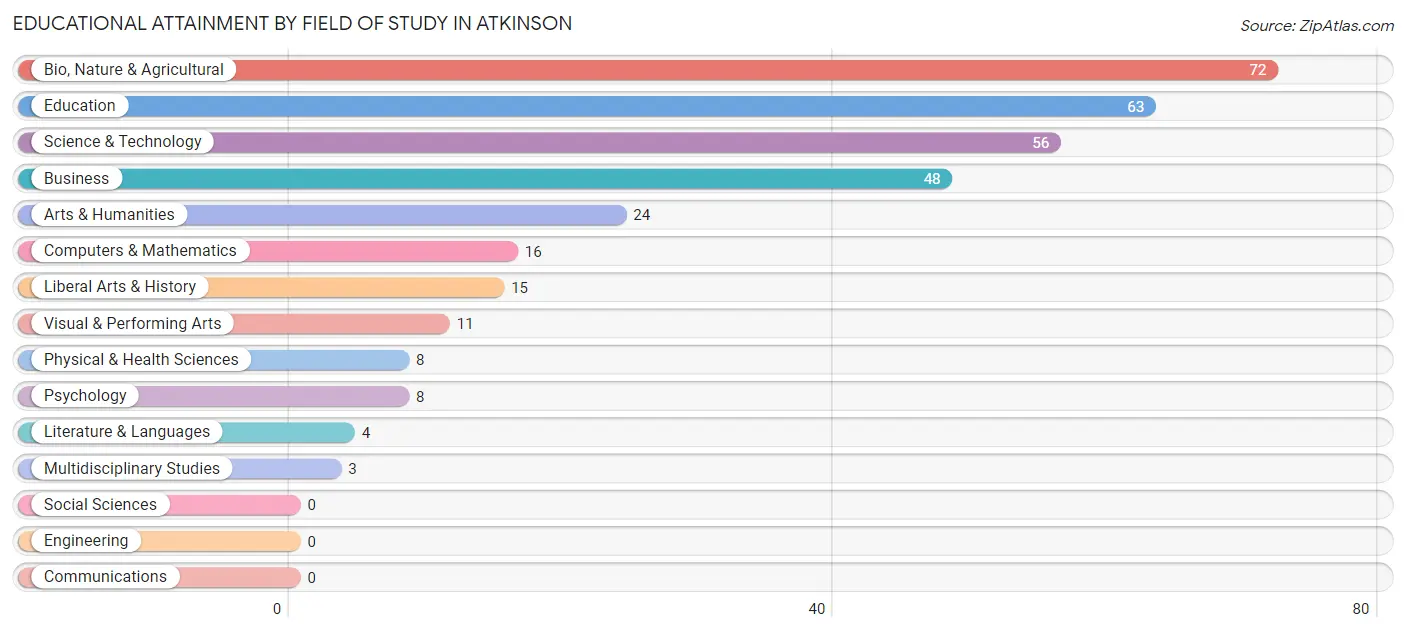
| Field of Study | # Graduates | % Graduates |
| Computers & Mathematics | 16 | 4.9% |
| Bio, Nature & Agricultural | 72 | 22.0% |
| Physical & Health Sciences | 8 | 2.4% |
| Psychology | 8 | 2.4% |
| Social Sciences | 0 | 0.0% |
| Engineering | 0 | 0.0% |
| Multidisciplinary Studies | 3 | 0.9% |
| Science & Technology | 56 | 17.1% |
| Business | 48 | 14.6% |
| Education | 63 | 19.2% |
| Literature & Languages | 4 | 1.2% |
| Liberal Arts & History | 15 | 4.6% |
| Visual & Performing Arts | 11 | 3.4% |
| Communications | 0 | 0.0% |
| Arts & Humanities | 24 | 7.3% |
| Total | 328 | 100.0% |
Transportation & Commute in Atkinson
Vehicle Availability by Sex in Atkinson
The most prevalent vehicle ownership categories in Atkinson are males with 2 vehicles (142, accounting for 39.1%) and females with 2 vehicles (148, making up 42.8%).
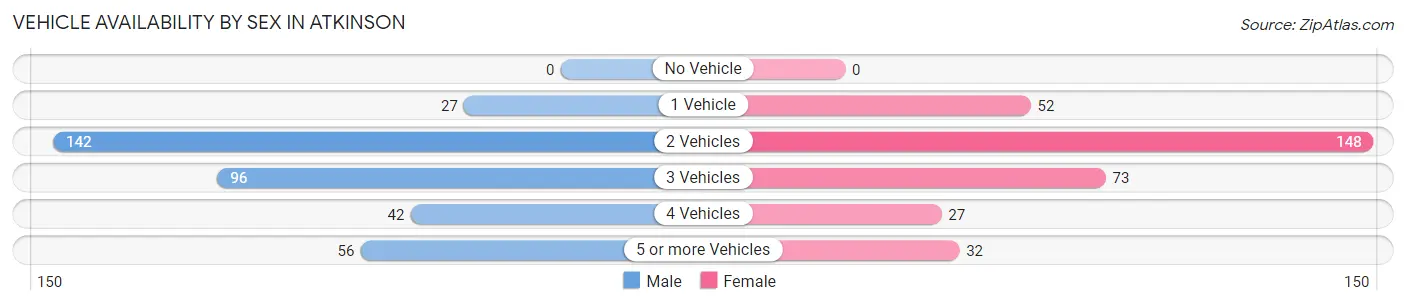
| Vehicles Available | Male | Female |
| No Vehicle | 0 (0.0%) | 0 (0.0%) |
| 1 Vehicle | 27 (7.4%) | 52 (15.7%) |
| 2 Vehicles | 142 (39.1%) | 148 (44.6%) |
| 3 Vehicles | 96 (26.5%) | 73 (22.0%) |
| 4 Vehicles | 42 (11.6%) | 27 (8.1%) |
| 5 or more Vehicles | 56 (15.4%) | 32 (9.6%) |
| Total | 363 (100.0%) | 332 (100.0%) |
Commute Time in Atkinson
The most frequently occuring commute durations in Atkinson are 5 to 9 minutes (201 commuters, 30.0%), less than 5 minutes (141 commuters, 21.0%), and 10 to 14 minutes (127 commuters, 18.9%).
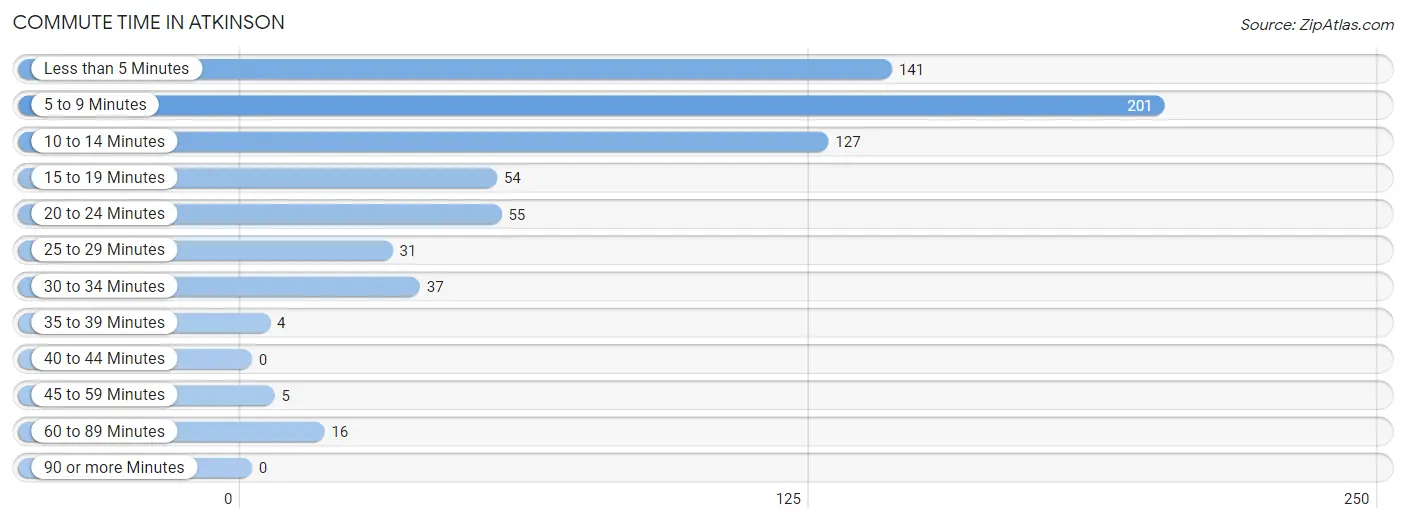
| Commute Time | # Commuters | % Commuters |
| Less than 5 Minutes | 141 | 21.0% |
| 5 to 9 Minutes | 201 | 30.0% |
| 10 to 14 Minutes | 127 | 18.9% |
| 15 to 19 Minutes | 54 | 8.1% |
| 20 to 24 Minutes | 55 | 8.2% |
| 25 to 29 Minutes | 31 | 4.6% |
| 30 to 34 Minutes | 37 | 5.5% |
| 35 to 39 Minutes | 4 | 0.6% |
| 40 to 44 Minutes | 0 | 0.0% |
| 45 to 59 Minutes | 5 | 0.7% |
| 60 to 89 Minutes | 16 | 2.4% |
| 90 or more Minutes | 0 | 0.0% |
Commute Time by Sex in Atkinson
The most common commute times in Atkinson are 5 to 9 minutes (85 commuters, 23.9%) for males and 5 to 9 minutes (116 commuters, 36.7%) for females.
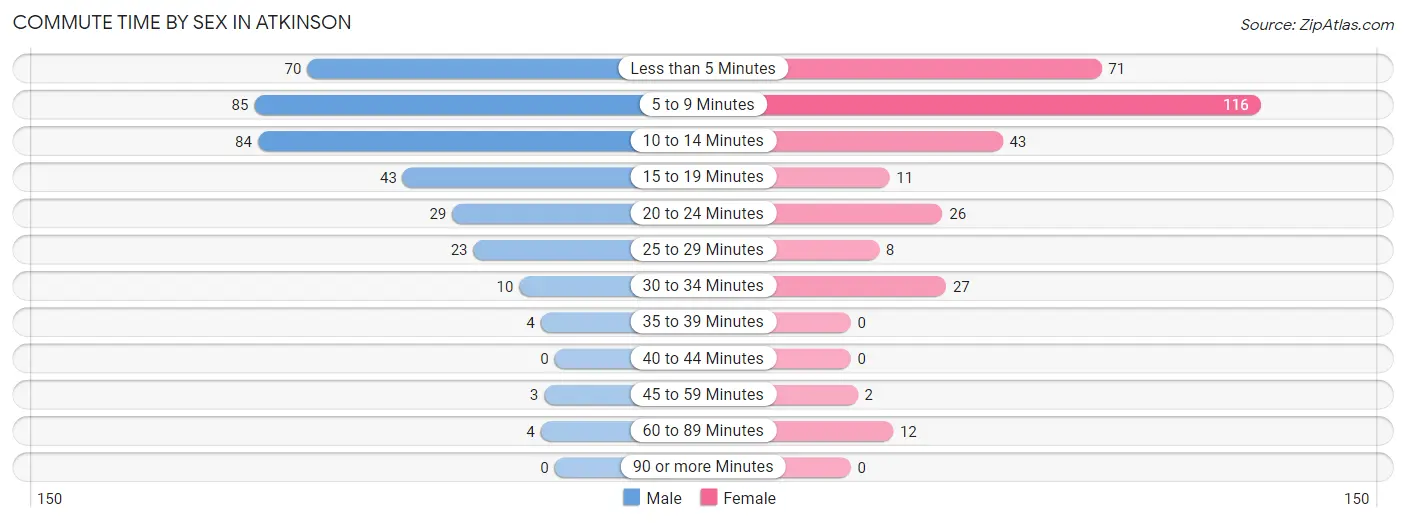
| Commute Time | Male | Female |
| Less than 5 Minutes | 70 (19.7%) | 71 (22.5%) |
| 5 to 9 Minutes | 85 (23.9%) | 116 (36.7%) |
| 10 to 14 Minutes | 84 (23.7%) | 43 (13.6%) |
| 15 to 19 Minutes | 43 (12.1%) | 11 (3.5%) |
| 20 to 24 Minutes | 29 (8.2%) | 26 (8.2%) |
| 25 to 29 Minutes | 23 (6.5%) | 8 (2.5%) |
| 30 to 34 Minutes | 10 (2.8%) | 27 (8.5%) |
| 35 to 39 Minutes | 4 (1.1%) | 0 (0.0%) |
| 40 to 44 Minutes | 0 (0.0%) | 0 (0.0%) |
| 45 to 59 Minutes | 3 (0.9%) | 2 (0.6%) |
| 60 to 89 Minutes | 4 (1.1%) | 12 (3.8%) |
| 90 or more Minutes | 0 (0.0%) | 0 (0.0%) |
Time of Departure to Work by Sex in Atkinson
The most frequent times of departure to work in Atkinson are 7:00 AM to 7:29 AM (101, 28.4%) for males and 7:30 AM to 7:59 AM (105, 33.2%) for females.
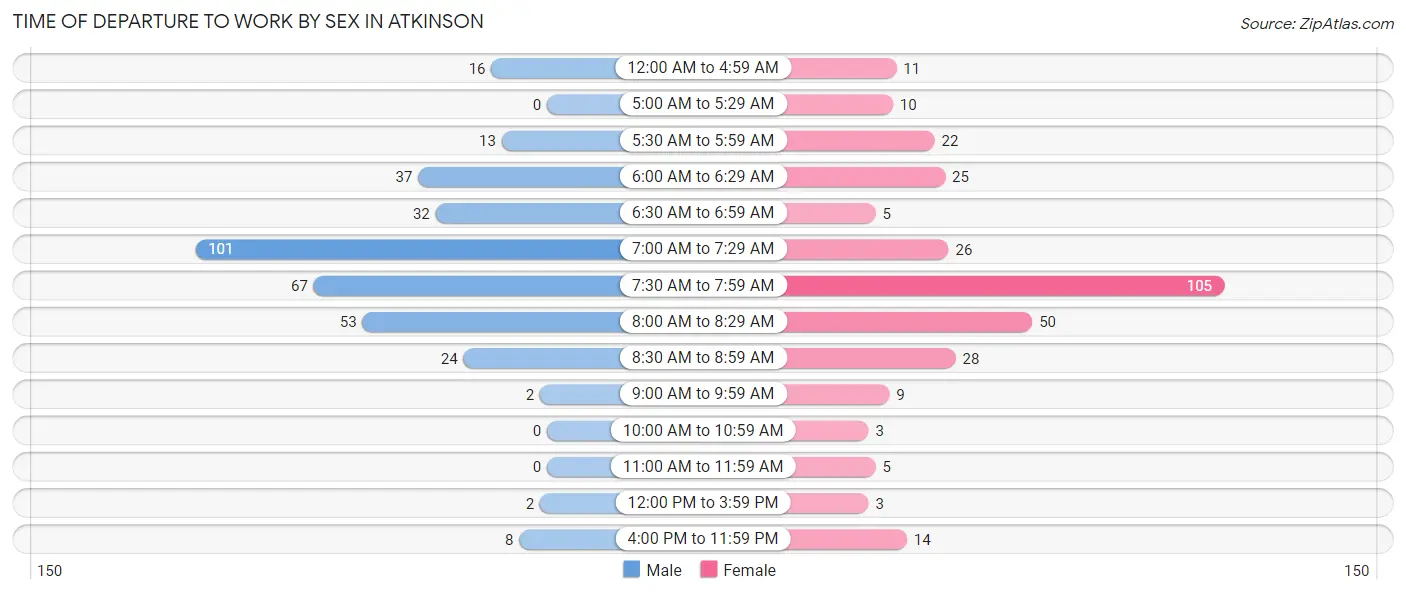
| Time of Departure | Male | Female |
| 12:00 AM to 4:59 AM | 16 (4.5%) | 11 (3.5%) |
| 5:00 AM to 5:29 AM | 0 (0.0%) | 10 (3.2%) |
| 5:30 AM to 5:59 AM | 13 (3.7%) | 22 (7.0%) |
| 6:00 AM to 6:29 AM | 37 (10.4%) | 25 (7.9%) |
| 6:30 AM to 6:59 AM | 32 (9.0%) | 5 (1.6%) |
| 7:00 AM to 7:29 AM | 101 (28.4%) | 26 (8.2%) |
| 7:30 AM to 7:59 AM | 67 (18.9%) | 105 (33.2%) |
| 8:00 AM to 8:29 AM | 53 (14.9%) | 50 (15.8%) |
| 8:30 AM to 8:59 AM | 24 (6.8%) | 28 (8.9%) |
| 9:00 AM to 9:59 AM | 2 (0.6%) | 9 (2.9%) |
| 10:00 AM to 10:59 AM | 0 (0.0%) | 3 (0.9%) |
| 11:00 AM to 11:59 AM | 0 (0.0%) | 5 (1.6%) |
| 12:00 PM to 3:59 PM | 2 (0.6%) | 3 (0.9%) |
| 4:00 PM to 11:59 PM | 8 (2.2%) | 14 (4.4%) |
| Total | 355 (100.0%) | 316 (100.0%) |
Housing Occupancy in Atkinson
Occupancy by Ownership in Atkinson
Of the total 555 dwellings in Atkinson, owner-occupied units account for 434 (78.2%), while renter-occupied units make up 121 (21.8%).
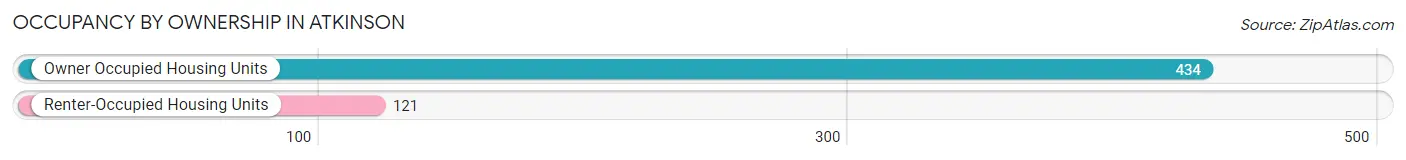
| Occupancy | # Housing Units | % Housing Units |
| Owner Occupied Housing Units | 434 | 78.2% |
| Renter-Occupied Housing Units | 121 | 21.8% |
| Total Occupied Housing Units | 555 | 100.0% |
Occupancy by Household Size in Atkinson
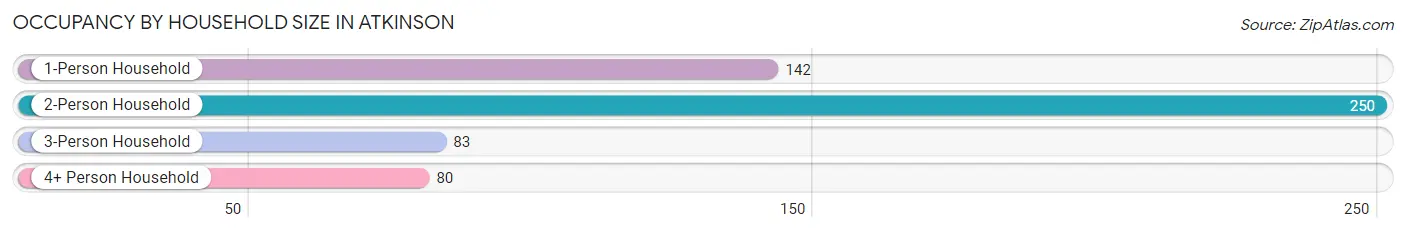
| Household Size | # Housing Units | % Housing Units |
| 1-Person Household | 142 | 25.6% |
| 2-Person Household | 250 | 45.1% |
| 3-Person Household | 83 | 14.9% |
| 4+ Person Household | 80 | 14.4% |
| Total Housing Units | 555 | 100.0% |
Occupancy by Ownership by Household Size in Atkinson
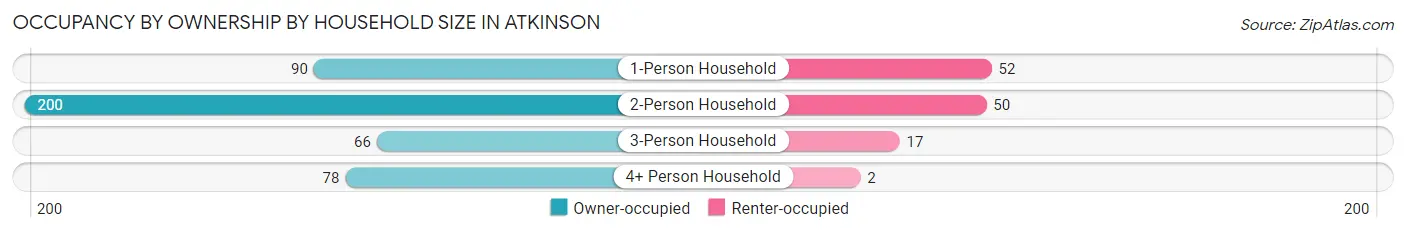
| Household Size | Owner-occupied | Renter-occupied |
| 1-Person Household | 90 (63.4%) | 52 (36.6%) |
| 2-Person Household | 200 (80.0%) | 50 (20.0%) |
| 3-Person Household | 66 (79.5%) | 17 (20.5%) |
| 4+ Person Household | 78 (97.5%) | 2 (2.5%) |
| Total Housing Units | 434 (78.2%) | 121 (21.8%) |
Occupancy by Educational Attainment in Atkinson
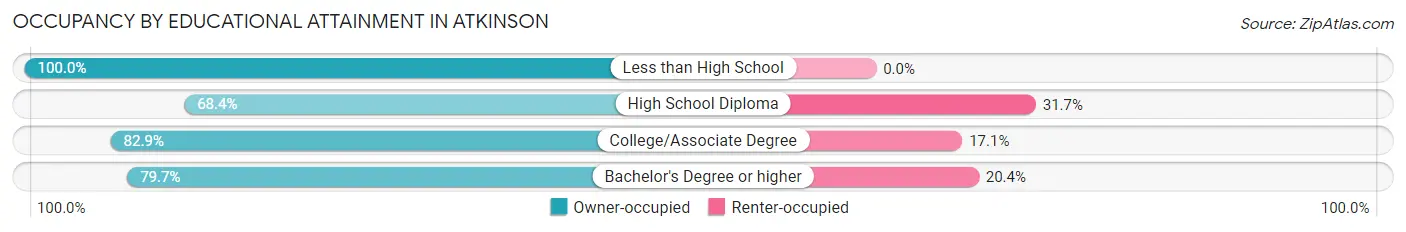
| Household Size | Owner-occupied | Renter-occupied |
| Less than High School | 14 (100.0%) | 0 (0.0%) |
| High School Diploma | 108 (68.3%) | 50 (31.7%) |
| College/Associate Degree | 175 (82.9%) | 36 (17.1%) |
| Bachelor's Degree or higher | 137 (79.6%) | 35 (20.3%) |
Occupancy by Age of Householder in Atkinson
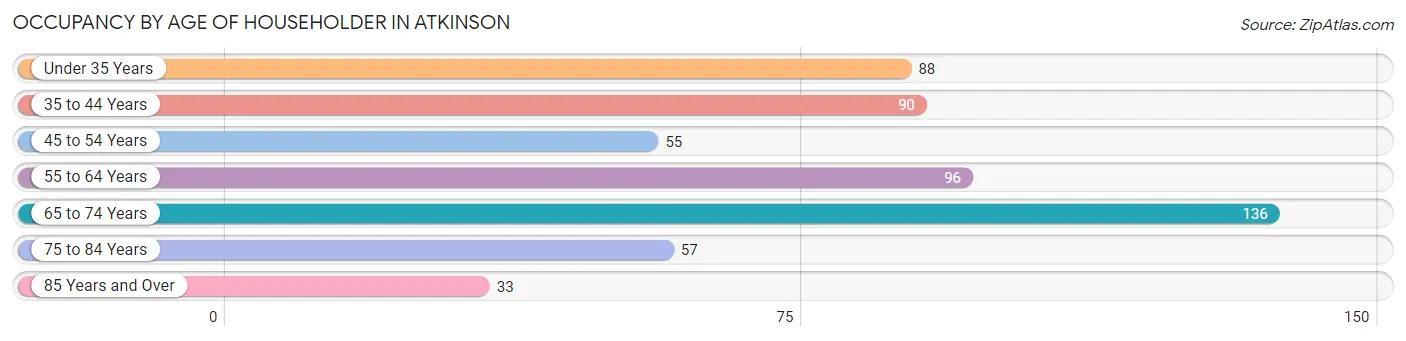
| Age Bracket | # Households | % Households |
| Under 35 Years | 88 | 15.9% |
| 35 to 44 Years | 90 | 16.2% |
| 45 to 54 Years | 55 | 9.9% |
| 55 to 64 Years | 96 | 17.3% |
| 65 to 74 Years | 136 | 24.5% |
| 75 to 84 Years | 57 | 10.3% |
| 85 Years and Over | 33 | 5.9% |
| Total | 555 | 100.0% |
Housing Finances in Atkinson
Median Income by Occupancy in Atkinson
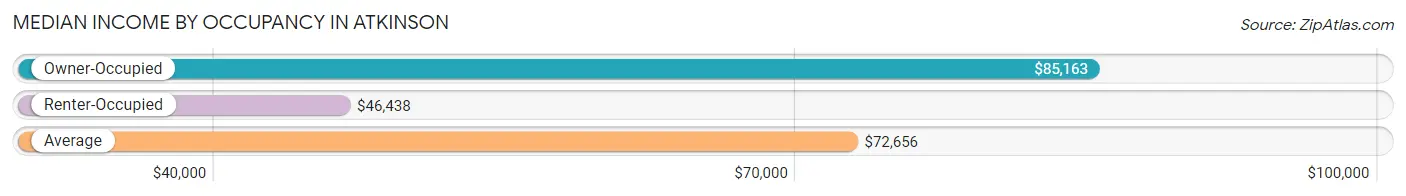
| Occupancy Type | # Households | Median Income |
| Owner-Occupied | 434 (78.2%) | $85,163 |
| Renter-Occupied | 121 (21.8%) | $46,438 |
| Average | 555 (100.0%) | $72,656 |
Occupancy by Householder Income Bracket in Atkinson
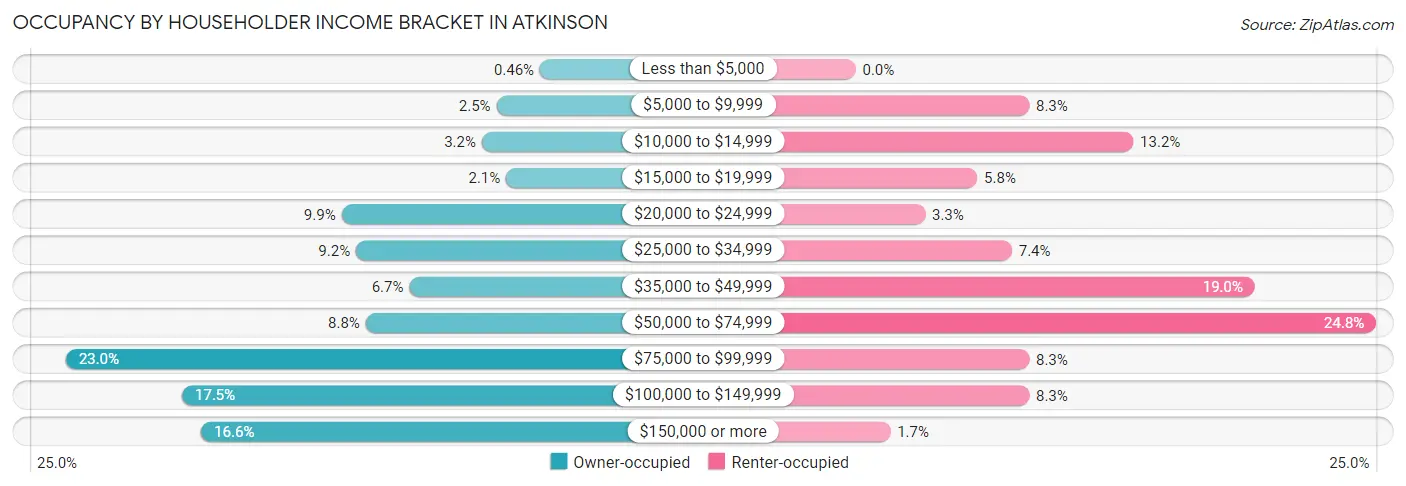
| Income Bracket | Owner-occupied | Renter-occupied |
| Less than $5,000 | 2 (0.5%) | 0 (0.0%) |
| $5,000 to $9,999 | 11 (2.5%) | 10 (8.3%) |
| $10,000 to $14,999 | 14 (3.2%) | 16 (13.2%) |
| $15,000 to $19,999 | 9 (2.1%) | 7 (5.8%) |
| $20,000 to $24,999 | 43 (9.9%) | 4 (3.3%) |
| $25,000 to $34,999 | 40 (9.2%) | 9 (7.4%) |
| $35,000 to $49,999 | 29 (6.7%) | 23 (19.0%) |
| $50,000 to $74,999 | 38 (8.8%) | 30 (24.8%) |
| $75,000 to $99,999 | 100 (23.0%) | 10 (8.3%) |
| $100,000 to $149,999 | 76 (17.5%) | 10 (8.3%) |
| $150,000 or more | 72 (16.6%) | 2 (1.7%) |
| Total | 434 (100.0%) | 121 (100.0%) |
Monthly Housing Cost Tiers in Atkinson
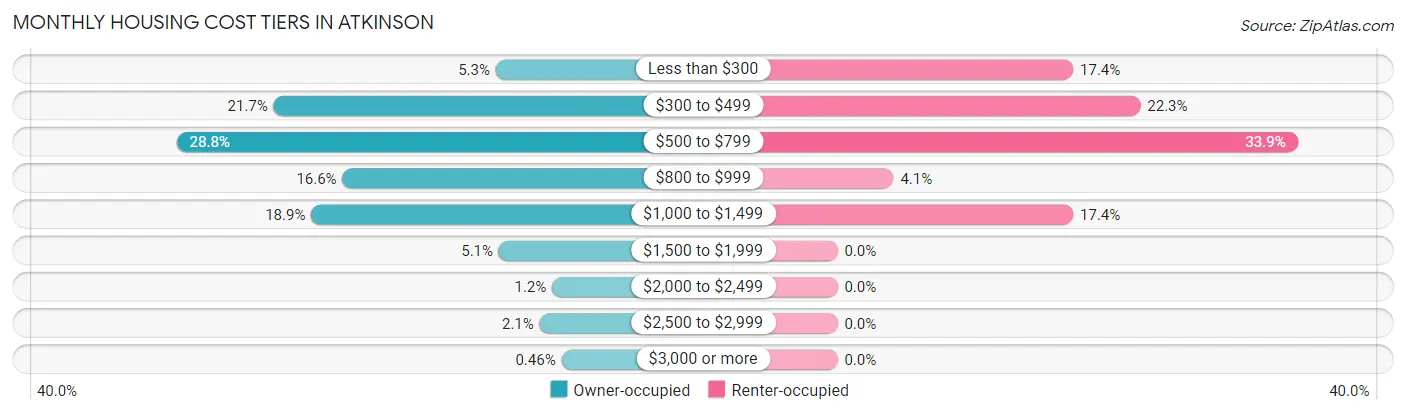
| Monthly Cost | Owner-occupied | Renter-occupied |
| Less than $300 | 23 (5.3%) | 21 (17.4%) |
| $300 to $499 | 94 (21.7%) | 27 (22.3%) |
| $500 to $799 | 125 (28.8%) | 41 (33.9%) |
| $800 to $999 | 72 (16.6%) | 5 (4.1%) |
| $1,000 to $1,499 | 82 (18.9%) | 21 (17.4%) |
| $1,500 to $1,999 | 22 (5.1%) | 0 (0.0%) |
| $2,000 to $2,499 | 5 (1.1%) | 0 (0.0%) |
| $2,500 to $2,999 | 9 (2.1%) | 0 (0.0%) |
| $3,000 or more | 2 (0.5%) | 0 (0.0%) |
| Total | 434 (100.0%) | 121 (100.0%) |
Physical Housing Characteristics in Atkinson
Housing Structures in Atkinson
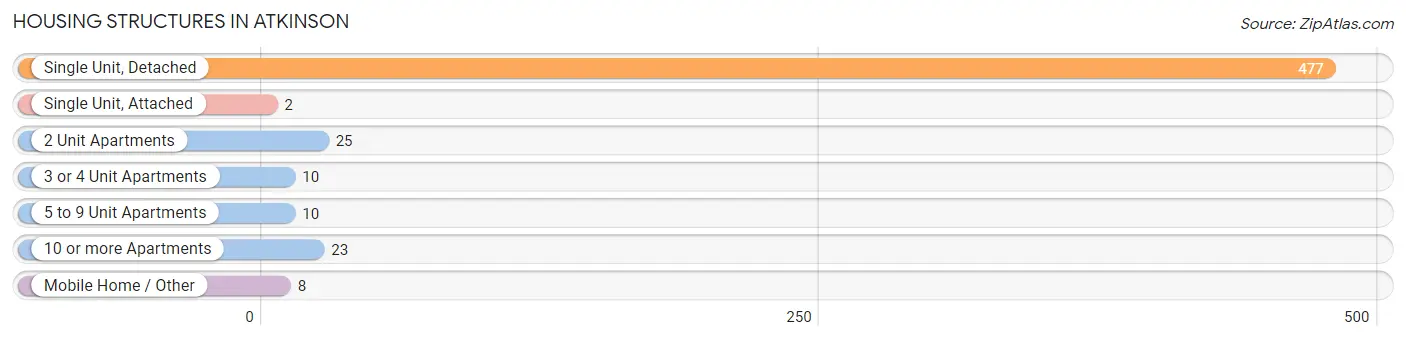
| Structure Type | # Housing Units | % Housing Units |
| Single Unit, Detached | 477 | 86.0% |
| Single Unit, Attached | 2 | 0.4% |
| 2 Unit Apartments | 25 | 4.5% |
| 3 or 4 Unit Apartments | 10 | 1.8% |
| 5 to 9 Unit Apartments | 10 | 1.8% |
| 10 or more Apartments | 23 | 4.1% |
| Mobile Home / Other | 8 | 1.4% |
| Total | 555 | 100.0% |
Housing Structures by Occupancy in Atkinson
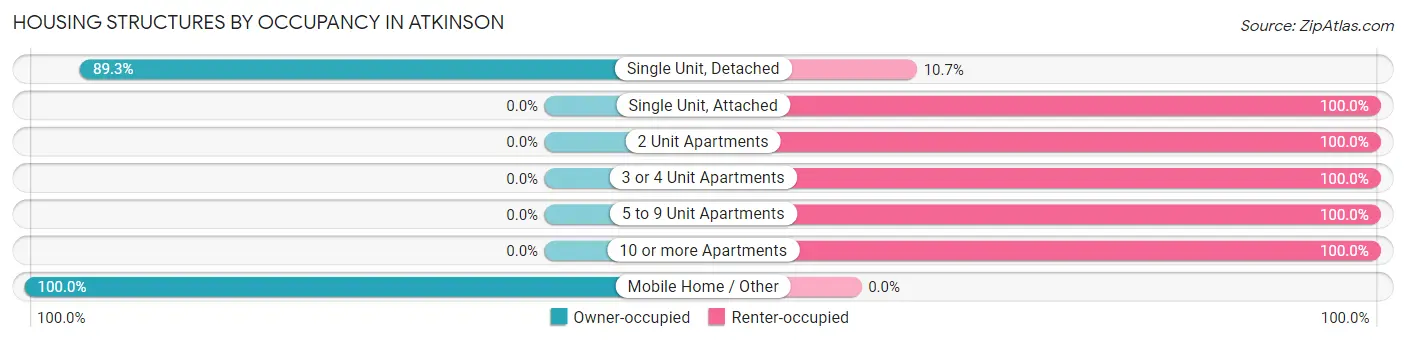
| Structure Type | Owner-occupied | Renter-occupied |
| Single Unit, Detached | 426 (89.3%) | 51 (10.7%) |
| Single Unit, Attached | 0 (0.0%) | 2 (100.0%) |
| 2 Unit Apartments | 0 (0.0%) | 25 (100.0%) |
| 3 or 4 Unit Apartments | 0 (0.0%) | 10 (100.0%) |
| 5 to 9 Unit Apartments | 0 (0.0%) | 10 (100.0%) |
| 10 or more Apartments | 0 (0.0%) | 23 (100.0%) |
| Mobile Home / Other | 8 (100.0%) | 0 (0.0%) |
| Total | 434 (78.2%) | 121 (21.8%) |
Housing Structures by Number of Rooms in Atkinson
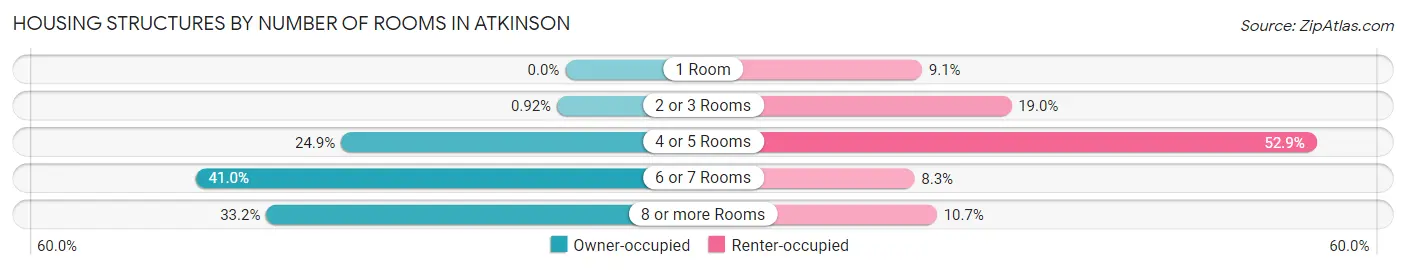
| Number of Rooms | Owner-occupied | Renter-occupied |
| 1 Room | 0 (0.0%) | 11 (9.1%) |
| 2 or 3 Rooms | 4 (0.9%) | 23 (19.0%) |
| 4 or 5 Rooms | 108 (24.9%) | 64 (52.9%) |
| 6 or 7 Rooms | 178 (41.0%) | 10 (8.3%) |
| 8 or more Rooms | 144 (33.2%) | 13 (10.7%) |
| Total | 434 (100.0%) | 121 (100.0%) |
Housing Structure by Heating Type in Atkinson
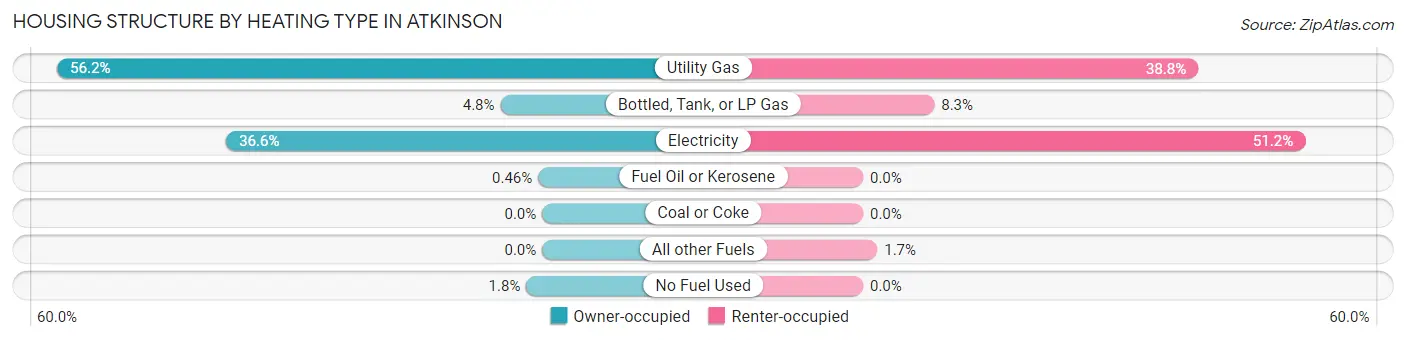
| Heating Type | Owner-occupied | Renter-occupied |
| Utility Gas | 244 (56.2%) | 47 (38.8%) |
| Bottled, Tank, or LP Gas | 21 (4.8%) | 10 (8.3%) |
| Electricity | 159 (36.6%) | 62 (51.2%) |
| Fuel Oil or Kerosene | 2 (0.5%) | 0 (0.0%) |
| Coal or Coke | 0 (0.0%) | 0 (0.0%) |
| All other Fuels | 0 (0.0%) | 2 (1.7%) |
| No Fuel Used | 8 (1.8%) | 0 (0.0%) |
| Total | 434 (100.0%) | 121 (100.0%) |
Household Vehicle Usage in Atkinson
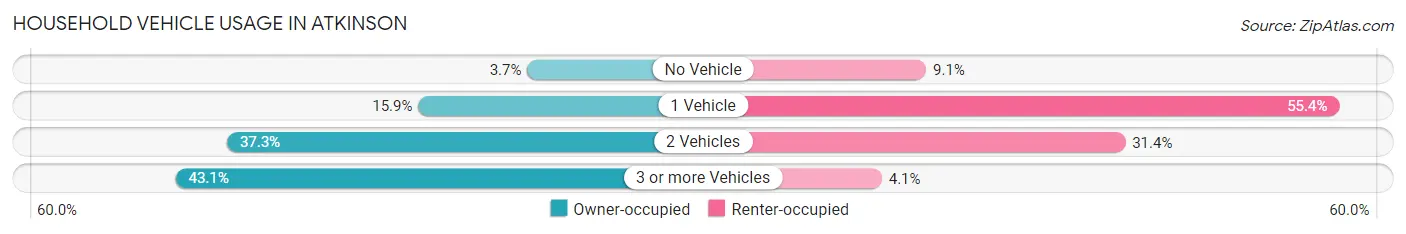
| Vehicles per Household | Owner-occupied | Renter-occupied |
| No Vehicle | 16 (3.7%) | 11 (9.1%) |
| 1 Vehicle | 69 (15.9%) | 67 (55.4%) |
| 2 Vehicles | 162 (37.3%) | 38 (31.4%) |
| 3 or more Vehicles | 187 (43.1%) | 5 (4.1%) |
| Total | 434 (100.0%) | 121 (100.0%) |
Real Estate & Mortgages in Atkinson
Real Estate and Mortgage Overview in Atkinson
| Characteristic | Without Mortgage | With Mortgage |
| Housing Units | 246 | 188 |
| Median Property Value | $124,200 | $170,200 |
| Median Household Income | $81,667 | $18 |
| Monthly Housing Costs | $513 | $2 |
| Real Estate Taxes | $1,395 | $4 |
Property Value by Mortgage Status in Atkinson
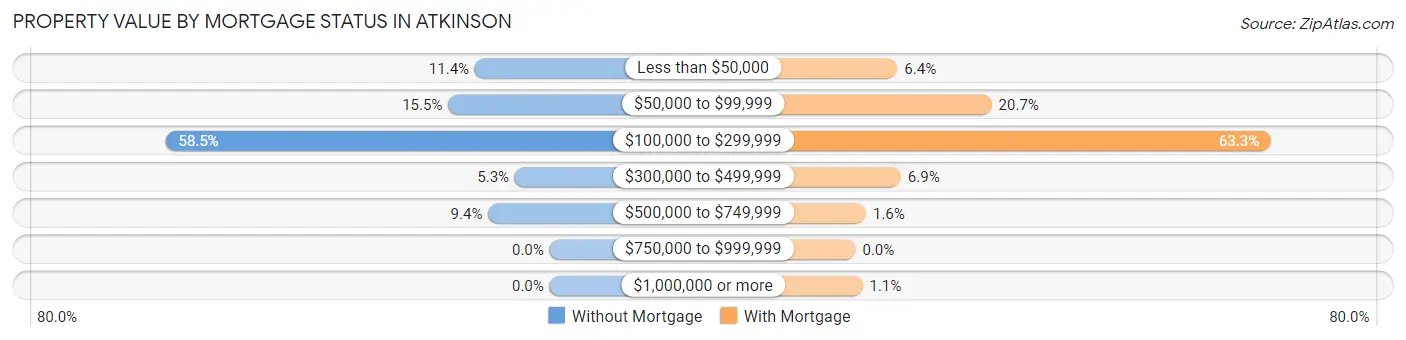
| Property Value | Without Mortgage | With Mortgage |
| Less than $50,000 | 28 (11.4%) | 12 (6.4%) |
| $50,000 to $99,999 | 38 (15.4%) | 39 (20.7%) |
| $100,000 to $299,999 | 144 (58.5%) | 119 (63.3%) |
| $300,000 to $499,999 | 13 (5.3%) | 13 (6.9%) |
| $500,000 to $749,999 | 23 (9.3%) | 3 (1.6%) |
| $750,000 to $999,999 | 0 (0.0%) | 0 (0.0%) |
| $1,000,000 or more | 0 (0.0%) | 2 (1.1%) |
| Total | 246 (100.0%) | 188 (100.0%) |
Household Income by Mortgage Status in Atkinson
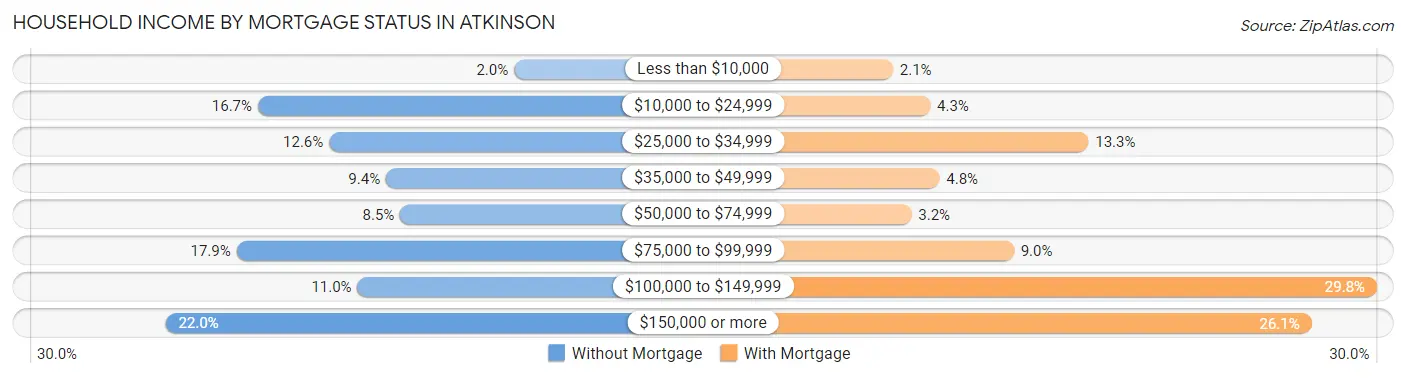
| Household Income | Without Mortgage | With Mortgage |
| Less than $10,000 | 5 (2.0%) | 4 (2.1%) |
| $10,000 to $24,999 | 41 (16.7%) | 8 (4.3%) |
| $25,000 to $34,999 | 31 (12.6%) | 25 (13.3%) |
| $35,000 to $49,999 | 23 (9.3%) | 9 (4.8%) |
| $50,000 to $74,999 | 21 (8.5%) | 6 (3.2%) |
| $75,000 to $99,999 | 44 (17.9%) | 17 (9.0%) |
| $100,000 to $149,999 | 27 (11.0%) | 56 (29.8%) |
| $150,000 or more | 54 (22.0%) | 49 (26.1%) |
| Total | 246 (100.0%) | 188 (100.0%) |
Property Value to Household Income Ratio in Atkinson
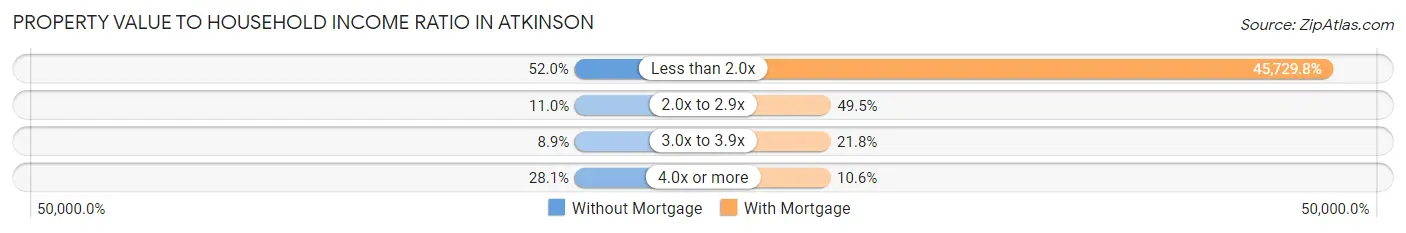
| Value-to-Income Ratio | Without Mortgage | With Mortgage |
| Less than 2.0x | 128 (52.0%) | 85,972 (45,729.8%) |
| 2.0x to 2.9x | 27 (11.0%) | 93 (49.5%) |
| 3.0x to 3.9x | 22 (8.9%) | 41 (21.8%) |
| 4.0x or more | 69 (28.1%) | 20 (10.6%) |
| Total | 246 (100.0%) | 188 (100.0%) |
Real Estate Taxes by Mortgage Status in Atkinson
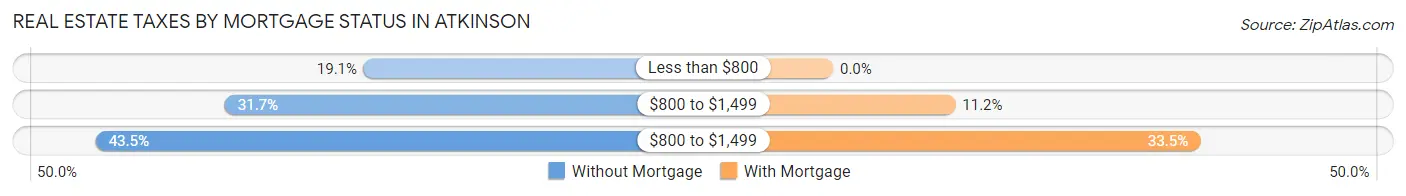
| Property Taxes | Without Mortgage | With Mortgage |
| Less than $800 | 47 (19.1%) | 0 (0.0%) |
| $800 to $1,499 | 78 (31.7%) | 21 (11.2%) |
| $800 to $1,499 | 107 (43.5%) | 63 (33.5%) |
| Total | 246 (100.0%) | 188 (100.0%) |
Health & Disability in Atkinson
Health Insurance Coverage by Age in Atkinson
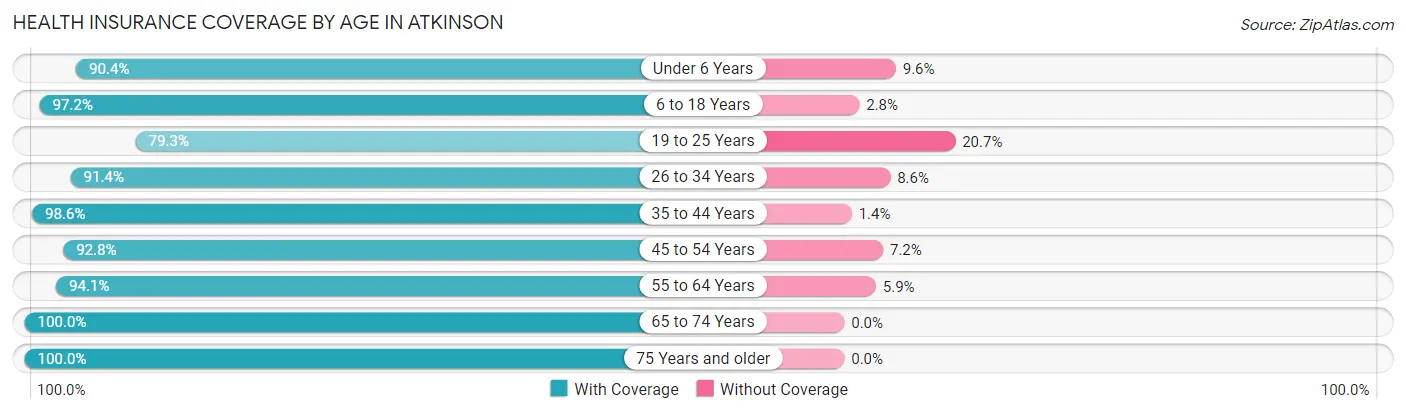
| Age Bracket | With Coverage | Without Coverage |
| Under 6 Years | 113 (90.4%) | 12 (9.6%) |
| 6 to 18 Years | 280 (97.2%) | 8 (2.8%) |
| 19 to 25 Years | 69 (79.3%) | 18 (20.7%) |
| 26 to 34 Years | 128 (91.4%) | 12 (8.6%) |
| 35 to 44 Years | 142 (98.6%) | 2 (1.4%) |
| 45 to 54 Years | 103 (92.8%) | 8 (7.2%) |
| 55 to 64 Years | 144 (94.1%) | 9 (5.9%) |
| 65 to 74 Years | 232 (100.0%) | 0 (0.0%) |
| 75 Years and older | 106 (100.0%) | 0 (0.0%) |
| Total | 1,317 (95.0%) | 69 (5.0%) |
Health Insurance Coverage by Citizenship Status in Atkinson
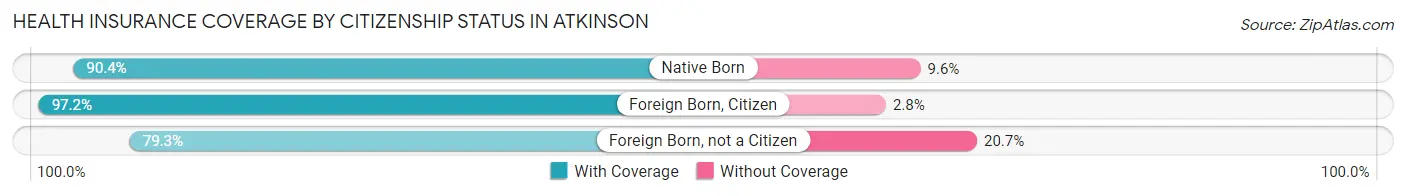
| Citizenship Status | With Coverage | Without Coverage |
| Native Born | 113 (90.4%) | 12 (9.6%) |
| Foreign Born, Citizen | 280 (97.2%) | 8 (2.8%) |
| Foreign Born, not a Citizen | 69 (79.3%) | 18 (20.7%) |
Health Insurance Coverage by Household Income in Atkinson
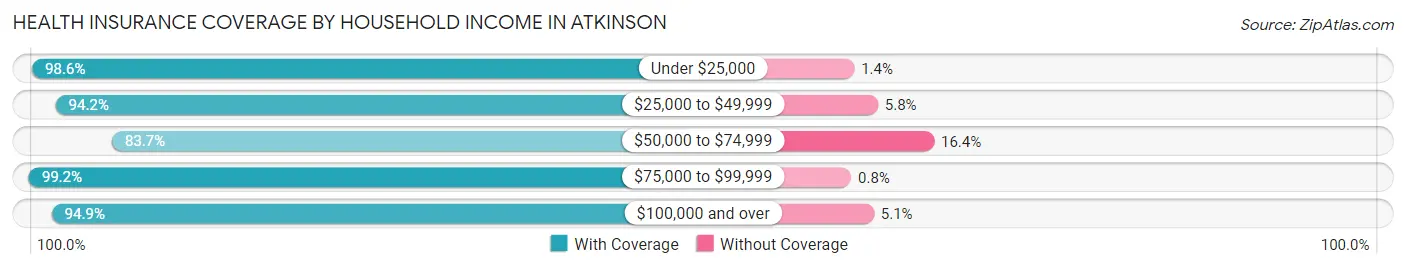
| Household Income | With Coverage | Without Coverage |
| Under $25,000 | 142 (98.6%) | 2 (1.4%) |
| $25,000 to $49,999 | 259 (94.2%) | 16 (5.8%) |
| $50,000 to $74,999 | 133 (83.7%) | 26 (16.4%) |
| $75,000 to $99,999 | 371 (99.2%) | 3 (0.8%) |
| $100,000 and over | 412 (94.9%) | 22 (5.1%) |
Public vs Private Health Insurance Coverage by Age in Atkinson
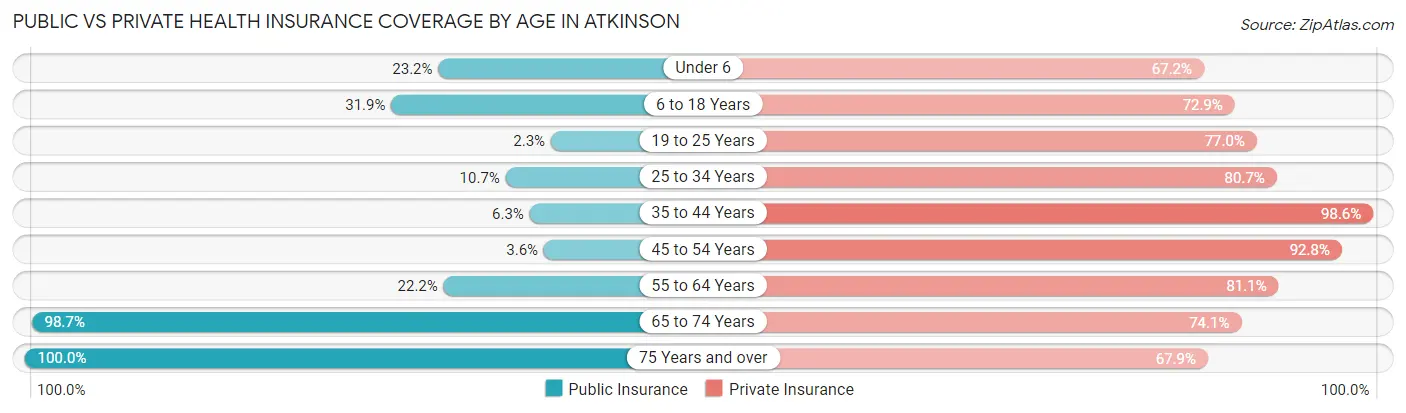
| Age Bracket | Public Insurance | Private Insurance |
| Under 6 | 29 (23.2%) | 84 (67.2%) |
| 6 to 18 Years | 92 (31.9%) | 210 (72.9%) |
| 19 to 25 Years | 2 (2.3%) | 67 (77.0%) |
| 25 to 34 Years | 15 (10.7%) | 113 (80.7%) |
| 35 to 44 Years | 9 (6.2%) | 142 (98.6%) |
| 45 to 54 Years | 4 (3.6%) | 103 (92.8%) |
| 55 to 64 Years | 34 (22.2%) | 124 (81.0%) |
| 65 to 74 Years | 229 (98.7%) | 172 (74.1%) |
| 75 Years and over | 106 (100.0%) | 72 (67.9%) |
| Total | 520 (37.5%) | 1,087 (78.4%) |
Disability Status by Sex by Age in Atkinson
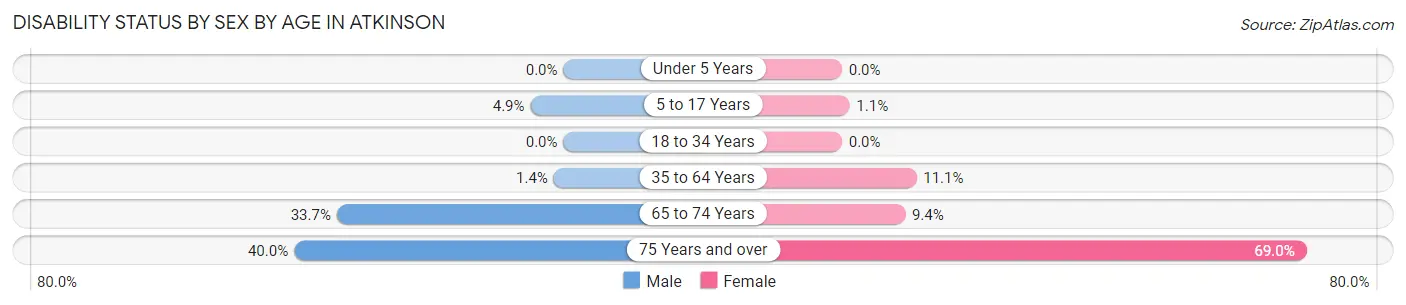
| Age Bracket | Male | Female |
| Under 5 Years | 0 (0.0%) | 0 (0.0%) |
| 5 to 17 Years | 5 (4.9%) | 2 (1.1%) |
| 18 to 34 Years | 0 (0.0%) | 0 (0.0%) |
| 35 to 64 Years | 3 (1.4%) | 22 (11.1%) |
| 65 to 74 Years | 35 (33.7%) | 12 (9.4%) |
| 75 Years and over | 14 (40.0%) | 49 (69.0%) |
Disability Class by Sex by Age in Atkinson
Disability Class: Hearing Difficulty
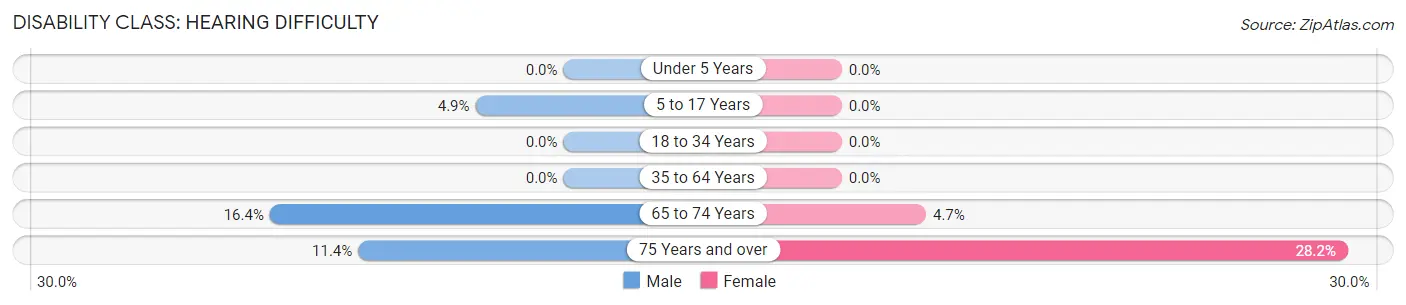
| Age Bracket | Male | Female |
| Under 5 Years | 0 (0.0%) | 0 (0.0%) |
| 5 to 17 Years | 5 (4.9%) | 0 (0.0%) |
| 18 to 34 Years | 0 (0.0%) | 0 (0.0%) |
| 35 to 64 Years | 0 (0.0%) | 0 (0.0%) |
| 65 to 74 Years | 17 (16.4%) | 6 (4.7%) |
| 75 Years and over | 4 (11.4%) | 20 (28.2%) |
Disability Class: Vision Difficulty
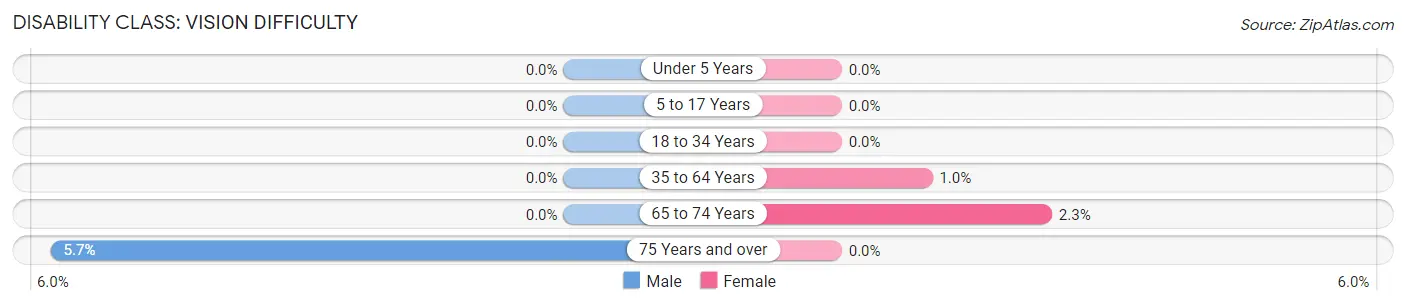
| Age Bracket | Male | Female |
| Under 5 Years | 0 (0.0%) | 0 (0.0%) |
| 5 to 17 Years | 0 (0.0%) | 0 (0.0%) |
| 18 to 34 Years | 0 (0.0%) | 0 (0.0%) |
| 35 to 64 Years | 0 (0.0%) | 2 (1.0%) |
| 65 to 74 Years | 0 (0.0%) | 3 (2.3%) |
| 75 Years and over | 2 (5.7%) | 0 (0.0%) |
Disability Class: Cognitive Difficulty
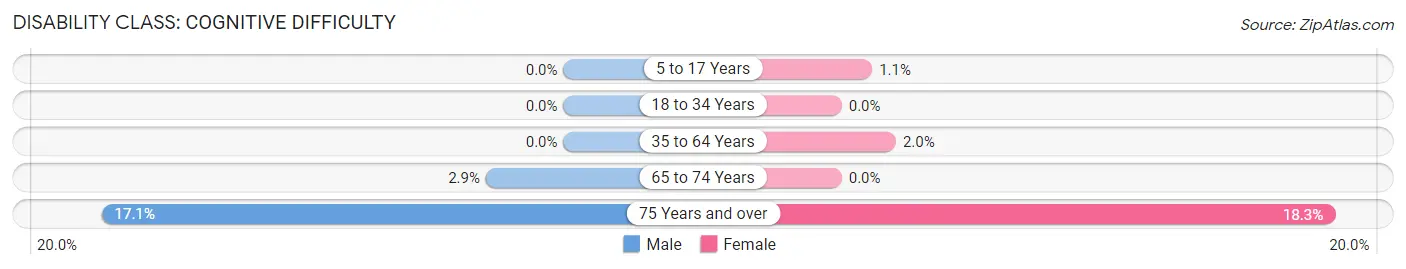
| Age Bracket | Male | Female |
| 5 to 17 Years | 0 (0.0%) | 2 (1.1%) |
| 18 to 34 Years | 0 (0.0%) | 0 (0.0%) |
| 35 to 64 Years | 0 (0.0%) | 4 (2.0%) |
| 65 to 74 Years | 3 (2.9%) | 0 (0.0%) |
| 75 Years and over | 6 (17.1%) | 13 (18.3%) |
Disability Class: Ambulatory Difficulty
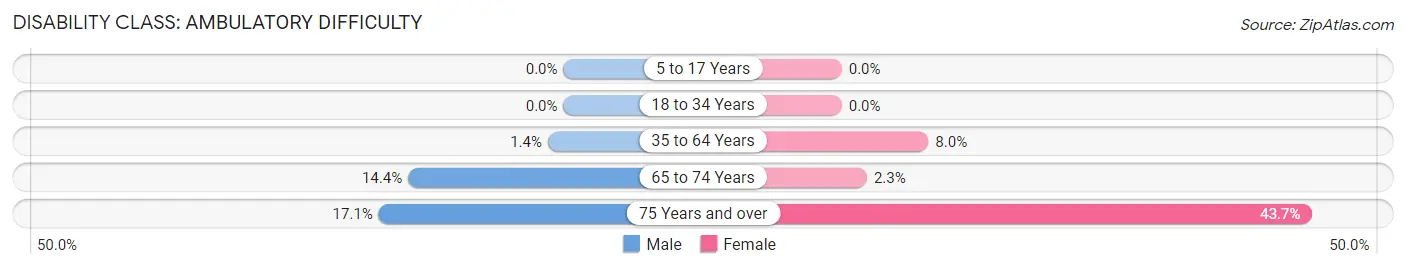
| Age Bracket | Male | Female |
| 5 to 17 Years | 0 (0.0%) | 0 (0.0%) |
| 18 to 34 Years | 0 (0.0%) | 0 (0.0%) |
| 35 to 64 Years | 3 (1.4%) | 16 (8.0%) |
| 65 to 74 Years | 15 (14.4%) | 3 (2.3%) |
| 75 Years and over | 6 (17.1%) | 31 (43.7%) |
Disability Class: Self-Care Difficulty
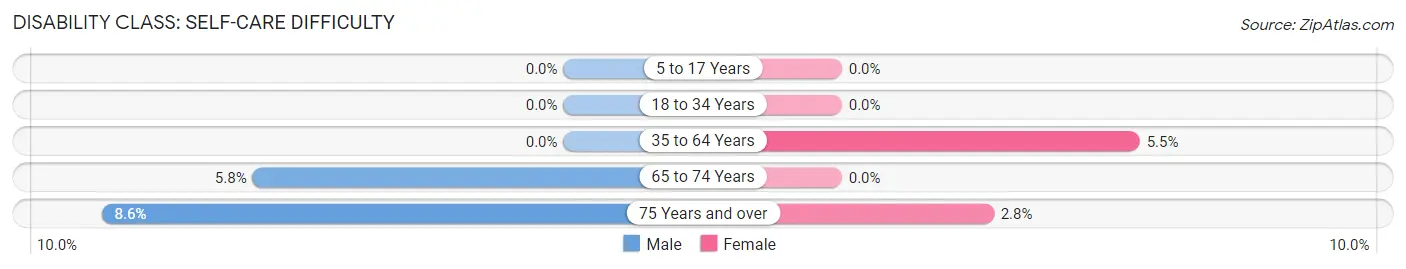
| Age Bracket | Male | Female |
| 5 to 17 Years | 0 (0.0%) | 0 (0.0%) |
| 18 to 34 Years | 0 (0.0%) | 0 (0.0%) |
| 35 to 64 Years | 0 (0.0%) | 11 (5.5%) |
| 65 to 74 Years | 6 (5.8%) | 0 (0.0%) |
| 75 Years and over | 3 (8.6%) | 2 (2.8%) |
Technology Access in Atkinson
Computing Device Access in Atkinson
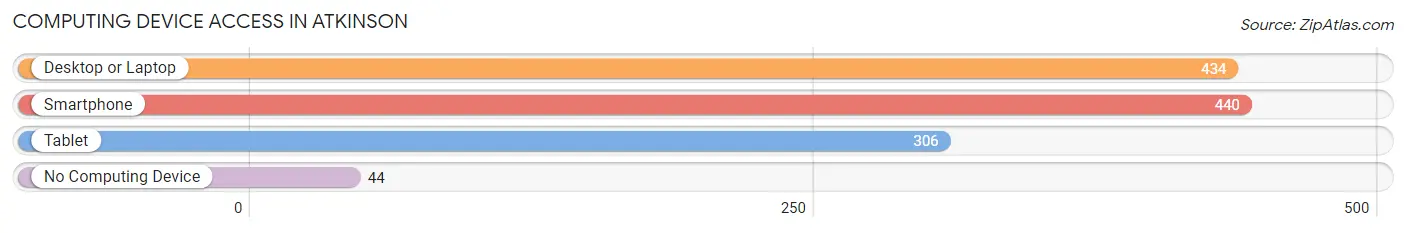
| Device Type | # Households | % Households |
| Desktop or Laptop | 434 | 78.2% |
| Smartphone | 440 | 79.3% |
| Tablet | 306 | 55.1% |
| No Computing Device | 44 | 7.9% |
| Total | 555 | 100.0% |
Internet Access in Atkinson
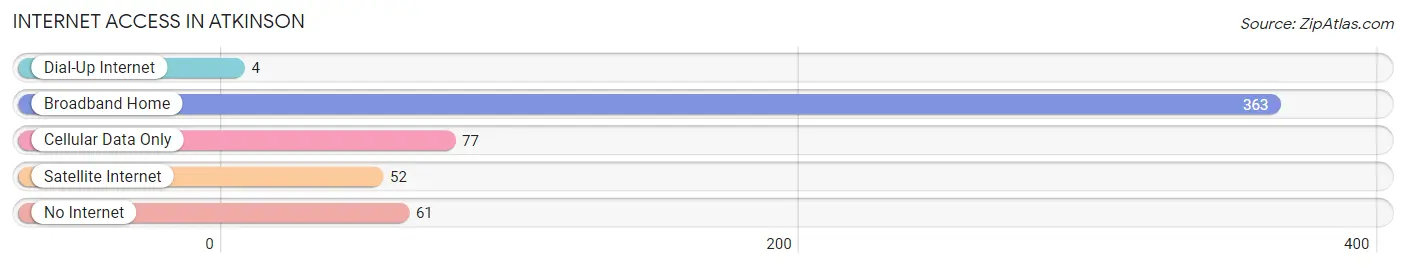
| Internet Type | # Households | % Households |
| Dial-Up Internet | 4 | 0.7% |
| Broadband Home | 363 | 65.4% |
| Cellular Data Only | 77 | 13.9% |
| Satellite Internet | 52 | 9.4% |
| No Internet | 61 | 11.0% |
| Total | 555 | 100.0% |
Atkinson Summary
Atkinson is a small city located in Holt County, Nebraska. It is situated on the banks of the Missouri River, and is the county seat of Holt County. The city has a population of 1,845 people, according to the 2010 census.
History
Atkinson was founded in 1871 by a group of settlers from Iowa. The city was named after the first settler, William Atkinson. The city was incorporated in 1887.
Atkinson was a major stop on the Union Pacific Railroad, and the city grew rapidly in the late 19th century. The city was a major center for the cattle industry, and the railroad allowed for the transportation of cattle to other parts of the country.
Atkinson was also a major center for the lumber industry. The city was home to several sawmills, and the lumber industry provided jobs for many of the city's residents.
Atkinson was also a major center for the agricultural industry. The city was home to several grain elevators, and the agricultural industry provided jobs for many of the city's residents.
Geography
Atkinson is located in Holt County, Nebraska. The city is situated on the banks of the Missouri River. The city has an area of 1.3 square miles, and a population of 1,845 people, according to the 2010 census.
The city is located in the Central Plains region of the United States. The climate is characterized by hot summers and cold winters. The average annual temperature is 54 degrees Fahrenheit.
Economy
Atkinson is a small city, and the economy is largely based on agriculture and tourism. The city is home to several grain elevators, and the agricultural industry provides jobs for many of the city's residents.
The city is also home to several tourist attractions, including the Atkinson Museum, the Atkinson Historical Society, and the Atkinson State Park. These attractions provide jobs for many of the city's residents.
Demographics
Atkinson has a population of 1,845 people, according to the 2010 census. The city has a median household income of $41,944, and a median family income of $50,944. The city has a poverty rate of 16.3%, and a unemployment rate of 4.2%.
The city is predominantly white, with a population that is 94.3% white, 1.2% African American, 0.7% Native American, 0.7% Asian, and 2.1% other. The city is also home to a large Hispanic population, with a population that is 11.2% Hispanic or Latino.
Conclusion
Atkinson is a small city located in Holt County, Nebraska. The city has a population of 1,845 people, according to the 2010 census. The city is situated on the banks of the Missouri River, and is the county seat of Holt County. The economy of the city is largely based on agriculture and tourism. The city is predominantly white, with a population that is 94.3% white, 1.2% African American, 0.7% Native American, 0.7% Asian, and 2.1% other. The city is also home to a large Hispanic population, with a population that is 11.2% Hispanic or Latino.
Common Questions
What is Per Capita Income in Atkinson?
Per Capita income in Atkinson is $30,704.
What is the Median Family Income in Atkinson?
Median Family Income in Atkinson is $86,395.
What is the Median Household income in Atkinson?
Median Household Income in Atkinson is $72,656.
What is Income or Wage Gap in Atkinson?
Income or Wage Gap in Atkinson is 41.7%.
Women in Atkinson earn 58.3 cents for every dollar earned by a man.
What is Family Income Deficit in Atkinson?
Family Income Deficit in Atkinson is $5,617.
Families that are below poverty line in Atkinson earn $5,617 less on average than the poverty threshold level.
What is Inequality or Gini Index in Atkinson?
Inequality or Gini Index in Atkinson is 0.39.
What is the Total Population of Atkinson?
Total Population of Atkinson is 1,426.
What is the Total Male Population of Atkinson?
Total Male Population of Atkinson is 666.
What is the Total Female Population of Atkinson?
Total Female Population of Atkinson is 760.
What is the Ratio of Males per 100 Females in Atkinson?
There are 87.63 Males per 100 Females in Atkinson.
What is the Ratio of Females per 100 Males in Atkinson?
There are 114.11 Females per 100 Males in Atkinson.
What is the Median Population Age in Atkinson?
Median Population Age in Atkinson is 39.1 Years.
What is the Average Family Size in Atkinson
Average Family Size in Atkinson is 3.1 People.
What is the Average Household Size in Atkinson
Average Household Size in Atkinson is 2.5 People.
How Large is the Labor Force in Atkinson?
There are 727 People in the Labor Forcein in Atkinson.
What is the Percentage of People in the Labor Force in Atkinson?
69.9% of People are in the Labor Force in Atkinson.
What is the Unemployment Rate in Atkinson?
Unemployment Rate in Atkinson is 4.4%.