Zip Codes with the Highest Percentage of Population Employed in Accommodation & Food Services in Nebraska
RELATED REPORTS & OPTIONS
Accommodation & Food Services
Nebraska
Compare Zip Codes
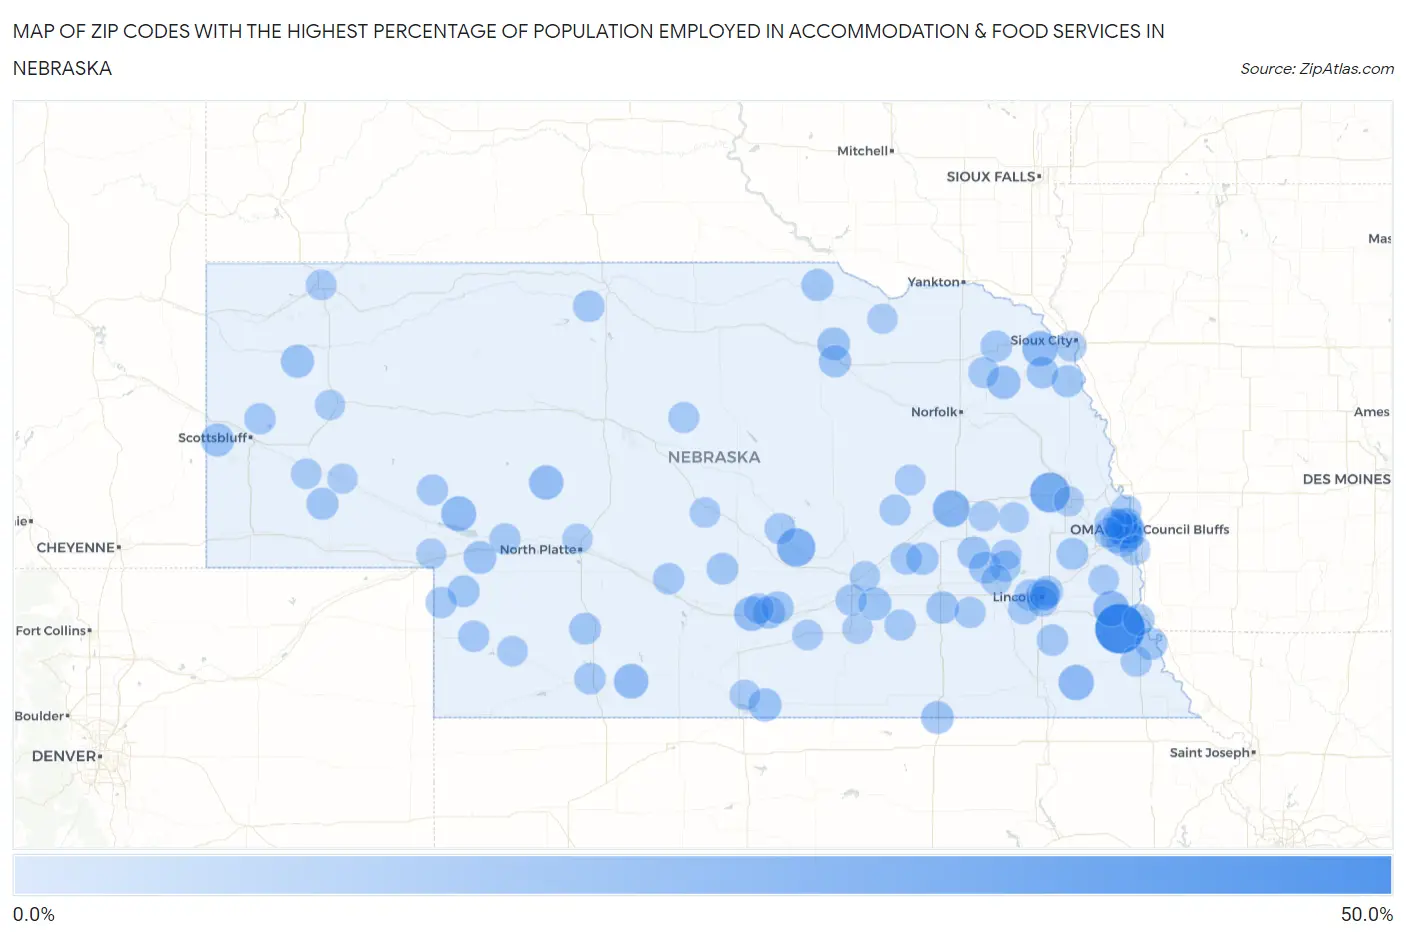
Map of Zip Codes with the Highest Percentage of Population Employed in Accommodation & Food Services in Nebraska
0.0%
50.0%
Zip Codes with the Highest Percentage of Population Employed in Accommodation & Food Services in Nebraska
| Zip Code | % Employed | vs State | vs National | |
| 1. | 68382 | 50.0% | 5.7%(+44.3)#1 | 6.9%(+43.1)#99 |
| 2. | 68621 | 27.9% | 5.7%(+22.2)#2 | 6.9%(+21.0)#388 |
| 3. | 68871 | 24.1% | 5.7%(+18.4)#3 | 6.9%(+17.2)#552 |
| 4. | 68634 | 21.0% | 5.7%(+15.3)#4 | 6.9%(+14.2)#742 |
| 5. | 68417 | 18.5% | 5.7%(+12.8)#5 | 6.9%(+11.6)#1,015 |
| 6. | 68785 | 17.8% | 5.7%(+12.1)#6 | 6.9%(+10.9)#1,120 |
| 7. | 68380 | 17.6% | 5.7%(+12.0)#7 | 6.9%(+10.8)#1,157 |
| 8. | 69146 | 17.0% | 5.7%(+11.3)#8 | 6.9%(+10.1)#1,264 |
| 9. | 69020 | 16.0% | 5.7%(+10.4)#9 | 6.9%(+9.16)#1,448 |
| 10. | 68861 | 16.0% | 5.7%(+10.3)#10 | 6.9%(+9.12)#1,454 |
| 11. | 69167 | 15.5% | 5.7%(+9.81)#11 | 6.9%(+8.62)#1,554 |
| 12. | 68787 | 13.3% | 5.7%(+7.61)#12 | 6.9%(+6.42)#2,225 |
| 13. | 69348 | 13.1% | 5.7%(+7.41)#13 | 6.9%(+6.22)#2,306 |
| 14. | 68960 | 13.0% | 5.7%(+7.36)#14 | 6.9%(+6.16)#2,328 |
| 15. | 69352 | 12.9% | 5.7%(+7.20)#15 | 6.9%(+6.01)#2,390 |
| 16. | 68841 | 12.5% | 5.7%(+6.81)#16 | 6.9%(+5.62)#2,589 |
| 17. | 69153 | 12.3% | 5.7%(+6.60)#17 | 6.9%(+5.41)#2,671 |
| 18. | 68667 | 12.1% | 5.7%(+6.43)#18 | 6.9%(+5.24)#2,763 |
| 19. | 68763 | 12.1% | 5.7%(+6.43)#19 | 6.9%(+5.24)#2,764 |
| 20. | 68327 | 11.9% | 5.7%(+6.22)#20 | 6.9%(+5.02)#2,901 |
| 21. | 68849 | 11.6% | 5.7%(+5.96)#21 | 6.9%(+4.76)#3,059 |
| 22. | 68401 | 11.5% | 5.7%(+5.79)#22 | 6.9%(+4.60)#3,174 |
| 23. | 68508 | 11.3% | 5.7%(+5.61)#23 | 6.9%(+4.41)#3,325 |
| 24. | 68654 | 11.1% | 5.7%(+5.42)#24 | 6.9%(+4.23)#3,462 |
| 25. | 68847 | 11.1% | 5.7%(+5.40)#25 | 6.9%(+4.20)#3,490 |
| 26. | 68439 | 11.1% | 5.7%(+5.39)#26 | 6.9%(+4.20)#3,493 |
| 27. | 68742 | 11.0% | 5.7%(+5.28)#27 | 6.9%(+4.09)#3,578 |
| 28. | 68421 | 10.8% | 5.7%(+5.16)#28 | 6.9%(+3.97)#3,679 |
| 29. | 68777 | 10.7% | 5.7%(+5.00)#29 | 6.9%(+3.80)#3,811 |
| 30. | 69131 | 10.3% | 5.7%(+4.64)#30 | 6.9%(+3.44)#4,174 |
| 31. | 68108 | 10.3% | 5.7%(+4.63)#31 | 6.9%(+3.43)#4,185 |
| 32. | 69140 | 10.2% | 5.7%(+4.53)#32 | 6.9%(+3.33)#4,285 |
| 33. | 68042 | 10.2% | 5.7%(+4.52)#33 | 6.9%(+3.32)#4,300 |
| 34. | 69038 | 10.2% | 5.7%(+4.51)#34 | 6.9%(+3.31)#4,311 |
| 35. | 68071 | 10.1% | 5.7%(+4.42)#35 | 6.9%(+3.22)#4,406 |
| 36. | 68410 | 10.1% | 5.7%(+4.37)#36 | 6.9%(+3.17)#4,462 |
| 37. | 68132 | 10.0% | 5.7%(+4.35)#37 | 6.9%(+3.16)#4,475 |
| 38. | 68733 | 10.0% | 5.7%(+4.30)#38 | 6.9%(+3.10)#4,569 |
| 39. | 68111 | 9.9% | 5.7%(+4.21)#39 | 6.9%(+3.02)#4,666 |
| 40. | 68182 | 9.8% | 5.7%(+4.15)#40 | 6.9%(+2.96)#4,732 |
| 41. | 68878 | 9.8% | 5.7%(+4.12)#41 | 6.9%(+2.93)#4,781 |
| 42. | 68846 | 9.7% | 5.7%(+4.03)#42 | 6.9%(+2.83)#4,911 |
| 43. | 68358 | 9.6% | 5.7%(+3.91)#43 | 6.9%(+2.72)#5,061 |
| 44. | 68745 | 9.5% | 5.7%(+3.81)#44 | 6.9%(+2.62)#5,214 |
| 45. | 69201 | 9.5% | 5.7%(+3.79)#45 | 6.9%(+2.60)#5,244 |
| 46. | 68131 | 9.5% | 5.7%(+3.78)#46 | 6.9%(+2.58)#5,258 |
| 47. | 69130 | 9.3% | 5.7%(+3.58)#47 | 6.9%(+2.39)#5,553 |
| 48. | 69001 | 9.2% | 5.7%(+3.54)#48 | 6.9%(+2.35)#5,614 |
| 49. | 68832 | 9.2% | 5.7%(+3.51)#49 | 6.9%(+2.32)#5,658 |
| 50. | 68105 | 9.2% | 5.7%(+3.50)#50 | 6.9%(+2.30)#5,675 |
| 51. | 69361 | 9.0% | 5.7%(+3.34)#51 | 6.9%(+2.14)#5,918 |
| 52. | 69033 | 9.0% | 5.7%(+3.32)#52 | 6.9%(+2.13)#5,933 |
| 53. | 68528 | 8.9% | 5.7%(+3.26)#53 | 6.9%(+2.06)#6,049 |
| 54. | 68107 | 8.9% | 5.7%(+3.25)#54 | 6.9%(+2.05)#6,069 |
| 55. | 68339 | 8.9% | 5.7%(+3.18)#55 | 6.9%(+1.99)#6,168 |
| 56. | 69168 | 8.8% | 5.7%(+3.10)#56 | 6.9%(+1.91)#6,296 |
| 57. | 68314 | 8.8% | 5.7%(+3.09)#57 | 6.9%(+1.90)#6,318 |
| 58. | 68853 | 8.7% | 5.7%(+3.01)#58 | 6.9%(+1.81)#6,472 |
| 59. | 68330 | 8.7% | 5.7%(+3.01)#59 | 6.9%(+1.81)#6,482 |
| 60. | 68975 | 8.6% | 5.7%(+2.93)#60 | 6.9%(+1.74)#6,604 |
| 61. | 68157 | 8.6% | 5.7%(+2.93)#61 | 6.9%(+1.73)#6,610 |
| 62. | 69147 | 8.6% | 5.7%(+2.87)#62 | 6.9%(+1.67)#6,728 |
| 63. | 68127 | 8.5% | 5.7%(+2.85)#63 | 6.9%(+1.65)#6,755 |
| 64. | 68305 | 8.4% | 5.7%(+2.71)#64 | 6.9%(+1.52)#7,001 |
| 65. | 68723 | 8.4% | 5.7%(+2.67)#65 | 6.9%(+1.48)#7,080 |
| 66. | 69155 | 8.3% | 5.7%(+2.65)#66 | 6.9%(+1.45)#7,134 |
| 67. | 68821 | 8.3% | 5.7%(+2.65)#67 | 6.9%(+1.45)#7,148 |
| 68. | 68504 | 8.2% | 5.7%(+2.50)#68 | 6.9%(+1.30)#7,459 |
| 69. | 68502 | 8.2% | 5.7%(+2.49)#69 | 6.9%(+1.30)#7,467 |
| 70. | 68178 | 8.1% | 5.7%(+2.45)#70 | 6.9%(+1.26)#7,556 |
| 71. | 68638 | 8.1% | 5.7%(+2.40)#71 | 6.9%(+1.20)#7,651 |
| 72. | 68104 | 8.0% | 5.7%(+2.31)#72 | 6.9%(+1.12)#7,822 |
| 73. | 68845 | 7.9% | 5.7%(+2.22)#73 | 6.9%(+1.02)#8,020 |
| 74. | 69337 | 7.9% | 5.7%(+2.17)#74 | 6.9%(+0.980)#8,124 |
| 75. | 68660 | 7.8% | 5.7%(+2.15)#75 | 6.9%(+0.958)#8,175 |
| 76. | 68635 | 7.8% | 5.7%(+2.11)#76 | 6.9%(+0.911)#8,276 |
| 77. | 68945 | 7.7% | 5.7%(+2.01)#77 | 6.9%(+0.811)#8,534 |
| 78. | 69045 | 7.5% | 5.7%(+1.79)#78 | 6.9%(+0.596)#9,041 |
| 79. | 68776 | 7.5% | 5.7%(+1.79)#79 | 6.9%(+0.592)#9,049 |
| 80. | 68822 | 7.3% | 5.7%(+1.64)#80 | 6.9%(+0.448)#9,439 |
| 81. | 68503 | 7.3% | 5.7%(+1.57)#81 | 6.9%(+0.381)#9,644 |
| 82. | 68920 | 7.3% | 5.7%(+1.56)#82 | 6.9%(+0.370)#9,676 |
| 83. | 69336 | 7.2% | 5.7%(+1.52)#83 | 6.9%(+0.328)#9,787 |
| 84. | 68164 | 7.2% | 5.7%(+1.51)#84 | 6.9%(+0.316)#9,813 |
| 85. | 68403 | 7.1% | 5.7%(+1.46)#85 | 6.9%(+0.262)#9,947 |
| 86. | 68001 | 7.1% | 5.7%(+1.46)#86 | 6.9%(+0.262)#9,951 |
| 87. | 68005 | 7.1% | 5.7%(+1.45)#87 | 6.9%(+0.254)#9,967 |
| 88. | 68901 | 7.1% | 5.7%(+1.42)#88 | 6.9%(+0.222)#10,043 |
| 89. | 68434 | 7.0% | 5.7%(+1.32)#89 | 6.9%(+0.126)#10,278 |
| 90. | 69101 | 6.9% | 5.7%(+1.18)#90 | 6.9%(-0.019)#10,681 |
| 91. | 68112 | 6.9% | 5.7%(+1.17)#91 | 6.9%(-0.022)#10,691 |
| 92. | 68144 | 6.8% | 5.7%(+1.16)#92 | 6.9%(-0.035)#10,737 |
| 93. | 68624 | 6.8% | 5.7%(+1.09)#93 | 6.9%(-0.108)#10,975 |
| 94. | 69301 | 6.8% | 5.7%(+1.07)#94 | 6.9%(-0.128)#11,042 |
| 95. | 68783 | 6.7% | 5.7%(+1.06)#95 | 6.9%(-0.137)#11,059 |
| 96. | 68134 | 6.7% | 5.7%(+1.05)#96 | 6.9%(-0.148)#11,103 |
| 97. | 68025 | 6.7% | 5.7%(+1.04)#97 | 6.9%(-0.152)#11,116 |
| 98. | 68801 | 6.7% | 5.7%(+1.04)#98 | 6.9%(-0.158)#11,132 |
| 99. | 69125 | 6.7% | 5.7%(+1.02)#99 | 6.9%(-0.170)#11,173 |
| 100. | 69122 | 6.7% | 5.7%(+1.02)#100 | 6.9%(-0.177)#11,195 |
Common Questions
What are the Top 10 Zip Codes with the Highest Percentage of Population Employed in Accommodation & Food Services in Nebraska?
Top 10 Zip Codes with the Highest Percentage of Population Employed in Accommodation & Food Services in Nebraska are:
What zip code has the Highest Percentage of Population Employed in Accommodation & Food Services in Nebraska?
68382 has the Highest Percentage of Population Employed in Accommodation & Food Services in Nebraska with 50.0%.
What is the Percentage of Population Employed in Accommodation & Food Services in the State of Nebraska?
Percentage of Population Employed in Accommodation & Food Services in Nebraska is 5.7%.
What is the Percentage of Population Employed in Accommodation & Food Services in the United States?
Percentage of Population Employed in Accommodation & Food Services in the United States is 6.9%.