Zip Codes with the Highest Percentage of Population Employed in Community & Social Service in Kentucky
RELATED REPORTS & OPTIONS
Community & Social Service
Kentucky
Compare Zip Codes
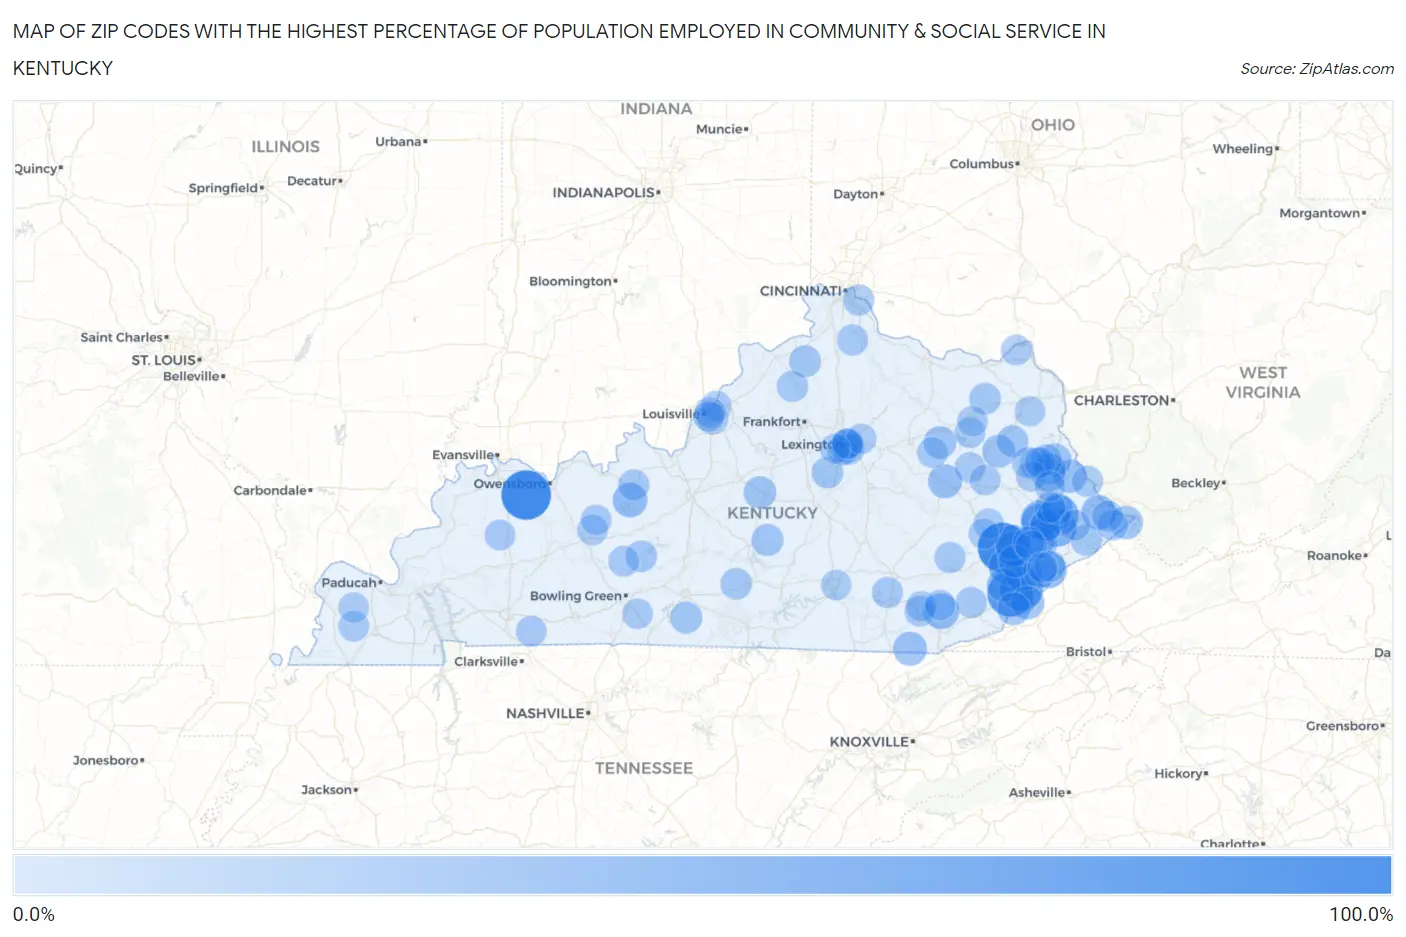
Map of Zip Codes with the Highest Percentage of Population Employed in Community & Social Service in Kentucky
0.0%
100.0%
Zip Codes with the Highest Percentage of Population Employed in Community & Social Service in Kentucky
| Zip Code | % Employed | vs State | vs National | |
| 1. | 42356 | 100.0% | 10.3%(+89.7)#1 | 11.2%(+88.8)#2 |
| 2. | 41739 | 100.0% | 10.3%(+89.7)#2 | 11.2%(+88.8)#22 |
| 3. | 41819 | 81.6% | 10.3%(+71.2)#3 | 11.2%(+70.4)#40 |
| 4. | 41833 | 73.3% | 10.3%(+63.0)#4 | 11.2%(+62.1)#51 |
| 5. | 41605 | 57.0% | 10.3%(+46.7)#5 | 11.2%(+45.8)#101 |
| 6. | 41631 | 50.6% | 10.3%(+40.3)#6 | 11.2%(+39.4)#152 |
| 7. | 41645 | 50.2% | 10.3%(+39.8)#7 | 11.2%(+39.0)#155 |
| 8. | 41760 | 47.0% | 10.3%(+36.7)#8 | 11.2%(+35.8)#195 |
| 9. | 41832 | 44.0% | 10.3%(+33.6)#9 | 11.2%(+32.7)#234 |
| 10. | 41849 | 40.5% | 10.3%(+30.1)#10 | 11.2%(+29.3)#278 |
| 11. | 41861 | 40.0% | 10.3%(+29.7)#11 | 11.2%(+28.8)#285 |
| 12. | 41725 | 39.6% | 10.3%(+29.3)#12 | 11.2%(+28.4)#294 |
| 13. | 40997 | 38.6% | 10.3%(+28.3)#13 | 11.2%(+27.4)#310 |
| 14. | 41740 | 37.3% | 10.3%(+27.0)#14 | 11.2%(+26.1)#344 |
| 15. | 41622 | 34.8% | 10.3%(+24.5)#15 | 11.2%(+23.6)#398 |
| 16. | 40178 | 34.5% | 10.3%(+24.2)#16 | 11.2%(+23.3)#404 |
| 17. | 41567 | 34.4% | 10.3%(+24.0)#17 | 11.2%(+23.2)#410 |
| 18. | 41360 | 31.6% | 10.3%(+21.3)#18 | 11.2%(+20.4)#507 |
| 19. | 40940 | 31.6% | 10.3%(+21.2)#19 | 11.2%(+20.4)#509 |
| 20. | 41815 | 31.1% | 10.3%(+20.8)#20 | 11.2%(+19.9)#529 |
| 21. | 41763 | 30.2% | 10.3%(+19.9)#21 | 11.2%(+19.0)#577 |
| 22. | 41615 | 30.0% | 10.3%(+19.7)#22 | 11.2%(+18.8)#584 |
| 23. | 40855 | 29.8% | 10.3%(+19.5)#23 | 11.2%(+18.6)#598 |
| 24. | 41271 | 29.8% | 10.3%(+19.4)#24 | 11.2%(+18.5)#600 |
| 25. | 41224 | 28.8% | 10.3%(+18.4)#25 | 11.2%(+17.5)#648 |
| 26. | 41568 | 28.7% | 10.3%(+18.4)#26 | 11.2%(+17.5)#652 |
| 27. | 41264 | 27.7% | 10.3%(+17.4)#27 | 11.2%(+16.5)#715 |
| 28. | 40927 | 27.2% | 10.3%(+16.8)#28 | 11.2%(+16.0)#752 |
| 29. | 41421 | 26.9% | 10.3%(+16.6)#29 | 11.2%(+15.7)#789 |
| 30. | 41759 | 26.6% | 10.3%(+16.3)#30 | 11.2%(+15.4)#811 |
| 31. | 40358 | 26.1% | 10.3%(+15.8)#31 | 11.2%(+14.9)#855 |
| 32. | 40061 | 25.9% | 10.3%(+15.6)#32 | 11.2%(+14.7)#881 |
| 33. | 41862 | 25.6% | 10.3%(+15.3)#33 | 11.2%(+14.4)#907 |
| 34. | 40526 | 24.4% | 10.3%(+14.1)#34 | 11.2%(+13.2)#1,049 |
| 35. | 41651 | 23.5% | 10.3%(+13.2)#35 | 11.2%(+12.3)#1,187 |
| 36. | 42758 | 23.5% | 10.3%(+13.2)#36 | 11.2%(+12.3)#1,190 |
| 37. | 42131 | 23.3% | 10.3%(+13.0)#37 | 11.2%(+12.1)#1,225 |
| 38. | 40355 | 22.7% | 10.3%(+12.4)#38 | 11.2%(+11.5)#1,325 |
| 39. | 41254 | 22.5% | 10.3%(+12.2)#39 | 11.2%(+11.3)#1,359 |
| 40. | 41619 | 22.3% | 10.3%(+12.0)#40 | 11.2%(+11.1)#1,397 |
| 41. | 41255 | 22.2% | 10.3%(+11.9)#41 | 11.2%(+11.0)#1,420 |
| 42. | 41149 | 22.2% | 10.3%(+11.9)#42 | 11.2%(+11.0)#1,422 |
| 43. | 40502 | 21.9% | 10.3%(+11.6)#43 | 11.2%(+10.7)#1,488 |
| 44. | 40390 | 21.9% | 10.3%(+11.6)#44 | 11.2%(+10.7)#1,494 |
| 45. | 41817 | 21.9% | 10.3%(+11.5)#45 | 11.2%(+10.6)#1,503 |
| 46. | 41135 | 21.5% | 10.3%(+11.2)#46 | 11.2%(+10.3)#1,597 |
| 47. | 42285 | 21.4% | 10.3%(+11.1)#47 | 11.2%(+10.2)#1,616 |
| 48. | 42742 | 21.2% | 10.3%(+10.8)#48 | 11.2%(+9.96)#1,669 |
| 49. | 41844 | 21.2% | 10.3%(+10.8)#49 | 11.2%(+9.96)#1,670 |
| 50. | 41559 | 20.8% | 10.3%(+10.5)#50 | 11.2%(+9.62)#1,767 |
| 51. | 41232 | 20.4% | 10.3%(+10.0)#51 | 11.2%(+9.16)#1,917 |
| 52. | 40036 | 20.0% | 10.3%(+9.67)#52 | 11.2%(+8.79)#2,019 |
| 53. | 41840 | 19.9% | 10.3%(+9.58)#53 | 11.2%(+8.70)#2,049 |
| 54. | 41642 | 19.9% | 10.3%(+9.57)#54 | 11.2%(+8.69)#2,051 |
| 55. | 40205 | 19.7% | 10.3%(+9.38)#55 | 11.2%(+8.50)#2,123 |
| 56. | 41231 | 19.6% | 10.3%(+9.26)#56 | 11.2%(+8.38)#2,165 |
| 57. | 40144 | 19.5% | 10.3%(+9.16)#57 | 11.2%(+8.27)#2,202 |
| 58. | 41033 | 19.4% | 10.3%(+9.06)#58 | 11.2%(+8.18)#2,238 |
| 59. | 41553 | 19.3% | 10.3%(+8.95)#59 | 11.2%(+8.07)#2,278 |
| 60. | 41085 | 19.3% | 10.3%(+8.93)#60 | 11.2%(+8.05)#2,285 |
| 61. | 41558 | 19.2% | 10.3%(+8.82)#61 | 11.2%(+7.94)#2,329 |
| 62. | 40972 | 19.1% | 10.3%(+8.78)#62 | 11.2%(+7.90)#2,347 |
| 63. | 41601 | 19.1% | 10.3%(+8.74)#63 | 11.2%(+7.86)#2,364 |
| 64. | 41219 | 18.9% | 10.3%(+8.58)#64 | 11.2%(+7.70)#2,429 |
| 65. | 40840 | 18.8% | 10.3%(+8.49)#65 | 11.2%(+7.61)#2,458 |
| 66. | 40737 | 18.6% | 10.3%(+8.27)#66 | 11.2%(+7.38)#2,555 |
| 67. | 40346 | 18.3% | 10.3%(+7.96)#67 | 11.2%(+7.08)#2,674 |
| 68. | 42436 | 18.1% | 10.3%(+7.81)#68 | 11.2%(+6.92)#2,753 |
| 69. | 42275 | 18.1% | 10.3%(+7.81)#69 | 11.2%(+6.92)#2,754 |
| 70. | 40503 | 18.1% | 10.3%(+7.79)#70 | 11.2%(+6.91)#2,760 |
| 71. | 40906 | 18.1% | 10.3%(+7.75)#71 | 11.2%(+6.86)#2,779 |
| 72. | 40313 | 18.1% | 10.3%(+7.73)#72 | 11.2%(+6.84)#2,785 |
| 73. | 40025 | 18.0% | 10.3%(+7.65)#73 | 11.2%(+6.76)#2,825 |
| 74. | 41256 | 18.0% | 10.3%(+7.64)#74 | 11.2%(+6.75)#2,831 |
| 75. | 40507 | 17.9% | 10.3%(+7.55)#75 | 11.2%(+6.67)#2,884 |
| 76. | 42286 | 17.6% | 10.3%(+7.28)#76 | 11.2%(+6.40)#3,016 |
| 77. | 40206 | 17.6% | 10.3%(+7.27)#77 | 11.2%(+6.38)#3,020 |
| 78. | 40204 | 17.3% | 10.3%(+6.95)#78 | 11.2%(+6.07)#3,195 |
| 79. | 40508 | 17.2% | 10.3%(+6.91)#79 | 11.2%(+6.02)#3,224 |
| 80. | 42122 | 17.2% | 10.3%(+6.86)#80 | 11.2%(+5.98)#3,253 |
| 81. | 41257 | 17.2% | 10.3%(+6.86)#81 | 11.2%(+5.97)#3,258 |
| 82. | 41425 | 17.2% | 10.3%(+6.83)#82 | 11.2%(+5.95)#3,272 |
| 83. | 42039 | 17.1% | 10.3%(+6.81)#83 | 11.2%(+5.92)#3,296 |
| 84. | 42370 | 17.0% | 10.3%(+6.69)#84 | 11.2%(+5.81)#3,368 |
| 85. | 41501 | 17.0% | 10.3%(+6.63)#85 | 11.2%(+5.74)#3,406 |
| 86. | 40923 | 16.9% | 10.3%(+6.56)#86 | 11.2%(+5.68)#3,454 |
| 87. | 41408 | 16.9% | 10.3%(+6.56)#87 | 11.2%(+5.68)#3,455 |
| 88. | 42361 | 16.9% | 10.3%(+6.53)#88 | 11.2%(+5.65)#3,470 |
| 89. | 41339 | 16.9% | 10.3%(+6.52)#89 | 11.2%(+5.64)#3,475 |
| 90. | 41174 | 16.8% | 10.3%(+6.50)#90 | 11.2%(+5.62)#3,490 |
| 91. | 41265 | 16.7% | 10.3%(+6.42)#91 | 11.2%(+5.53)#3,542 |
| 92. | 40351 | 16.7% | 10.3%(+6.40)#92 | 11.2%(+5.52)#3,550 |
| 93. | 42035 | 16.7% | 10.3%(+6.39)#93 | 11.2%(+5.50)#3,556 |
| 94. | 40982 | 16.7% | 10.3%(+6.34)#94 | 11.2%(+5.45)#3,594 |
| 95. | 42533 | 16.6% | 10.3%(+6.28)#95 | 11.2%(+5.40)#3,635 |
| 96. | 40516 | 16.5% | 10.3%(+6.18)#96 | 11.2%(+5.30)#3,686 |
| 97. | 41348 | 16.3% | 10.3%(+5.93)#97 | 11.2%(+5.04)#3,867 |
| 98. | 41855 | 16.1% | 10.3%(+5.78)#98 | 11.2%(+4.90)#3,986 |
| 99. | 41146 | 16.1% | 10.3%(+5.75)#99 | 11.2%(+4.87)#4,012 |
| 100. | 40513 | 16.0% | 10.3%(+5.62)#100 | 11.2%(+4.74)#4,104 |
Common Questions
What are the Top 10 Zip Codes with the Highest Percentage of Population Employed in Community & Social Service in Kentucky?
Top 10 Zip Codes with the Highest Percentage of Population Employed in Community & Social Service in Kentucky are:
What zip code has the Highest Percentage of Population Employed in Community & Social Service in Kentucky?
42356 has the Highest Percentage of Population Employed in Community & Social Service in Kentucky with 100.0%.
What is the Percentage of Population Employed in Community & Social Service in the State of Kentucky?
Percentage of Population Employed in Community & Social Service in Kentucky is 10.3%.
What is the Percentage of Population Employed in Community & Social Service in the United States?
Percentage of Population Employed in Community & Social Service in the United States is 11.2%.