Zip Codes with the Highest Percentage of Households with Income Above $100,000 in Kentucky
RELATED REPORTS & OPTIONS
Household Income | $100k+
Kentucky
Compare Zip Codes
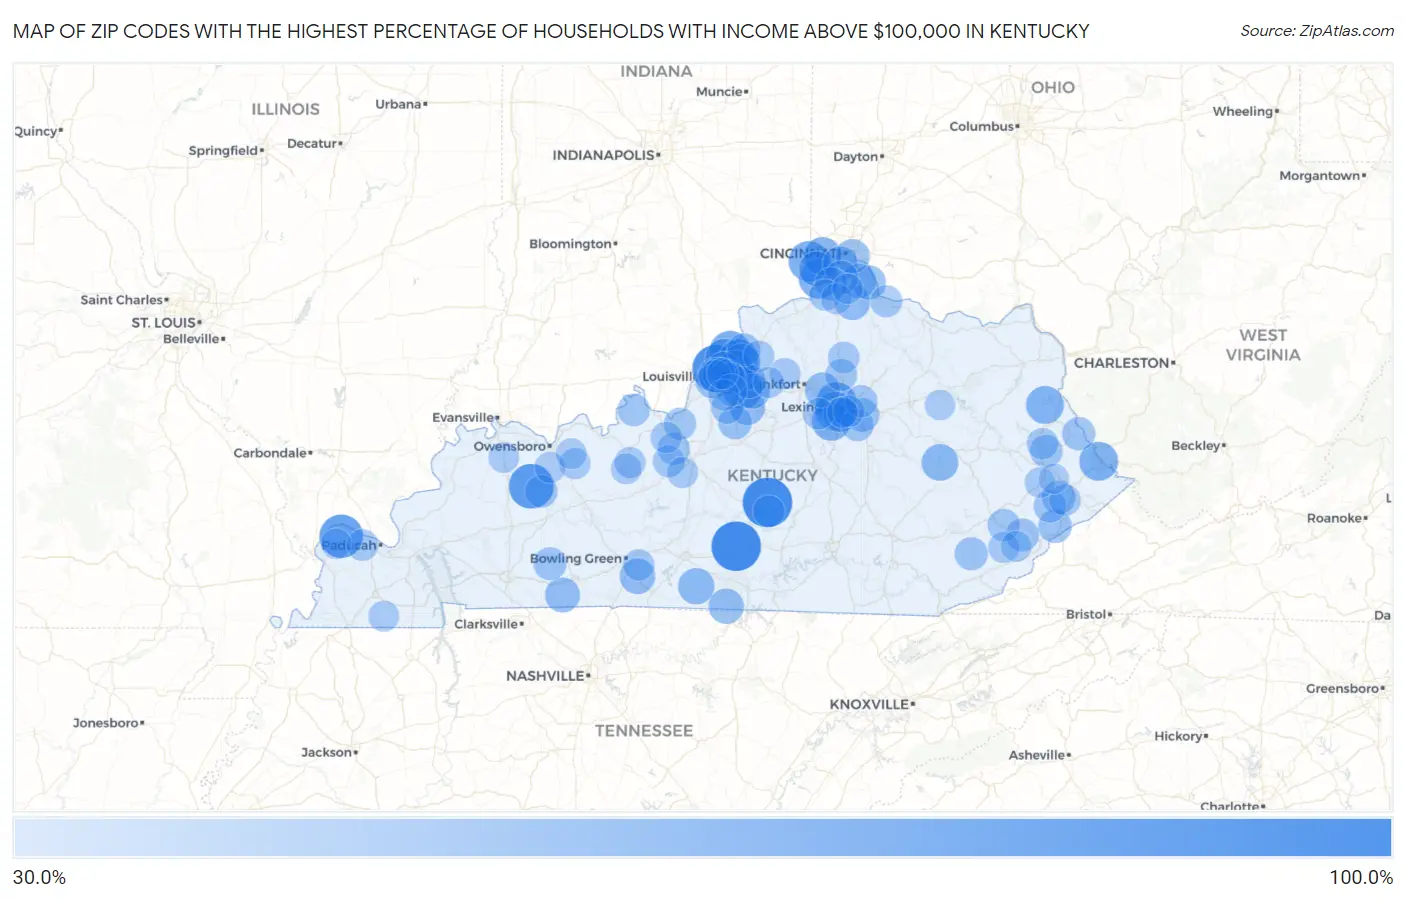
Map of Zip Codes with the Highest Percentage of Households with Income Above $100,000 in Kentucky
30.0%
100.0%
Zip Codes with the Highest Percentage of Households with Income Above $100,000 in Kentucky
| Zip Code | Households with Income > $100k | vs State | vs National | |
| 1. | 42742 | 100.0% | 27.5%(+72.5)#1 | 37.3%(+62.7)#56 |
| 2. | 42758 | 100.0% | 27.5%(+72.5)#2 | 37.3%(+62.7)#76 |
| 3. | 40025 | 93.7% | 27.5%(+66.2)#3 | 37.3%(+56.4)#157 |
| 4. | 42371 | 83.3% | 27.5%(+55.8)#4 | 37.3%(+46.0)#259 |
| 5. | 42022 | 79.4% | 27.5%(+51.9)#5 | 37.3%(+42.1)#366 |
| 6. | 40026 | 69.7% | 27.5%(+42.2)#6 | 37.3%(+32.4)#999 |
| 7. | 40510 | 68.8% | 27.5%(+41.3)#7 | 37.3%(+31.5)#1,079 |
| 8. | 41080 | 68.1% | 27.5%(+40.6)#8 | 37.3%(+30.8)#1,157 |
| 9. | 40059 | 67.0% | 27.5%(+39.5)#9 | 37.3%(+29.7)#1,258 |
| 10. | 41091 | 66.4% | 27.5%(+38.9)#10 | 37.3%(+29.1)#1,353 |
| 11. | 40023 | 66.0% | 27.5%(+38.5)#11 | 37.3%(+28.7)#1,405 |
| 12. | 40010 | 64.5% | 27.5%(+37.0)#12 | 37.3%(+27.2)#1,619 |
| 13. | 40513 | 63.4% | 27.5%(+35.9)#13 | 37.3%(+26.1)#1,779 |
| 14. | 40339 | 63.4% | 27.5%(+35.9)#14 | 37.3%(+26.1)#1,784 |
| 15. | 41503 | 63.2% | 27.5%(+35.7)#15 | 37.3%(+25.9)#1,815 |
| 16. | 41048 | 60.4% | 27.5%(+32.9)#16 | 37.3%(+23.1)#2,289 |
| 17. | 41201 | 60.0% | 27.5%(+32.5)#17 | 37.3%(+22.7)#2,372 |
| 18. | 40014 | 59.6% | 27.5%(+32.1)#18 | 37.3%(+22.3)#2,449 |
| 19. | 40245 | 58.3% | 27.5%(+30.8)#19 | 37.3%(+21.0)#2,701 |
| 20. | 40056 | 57.2% | 27.5%(+29.7)#20 | 37.3%(+19.9)#2,932 |
| 21. | 41397 | 55.6% | 27.5%(+28.1)#21 | 37.3%(+18.3)#3,308 |
| 22. | 42157 | 54.6% | 27.5%(+27.1)#22 | 37.3%(+17.3)#3,564 |
| 23. | 42122 | 52.0% | 27.5%(+24.5)#23 | 37.3%(+14.7)#4,252 |
| 24. | 42151 | 51.1% | 27.5%(+23.6)#24 | 37.3%(+13.8)#4,526 |
| 25. | 41033 | 50.7% | 27.5%(+23.2)#25 | 37.3%(+13.4)#4,640 |
| 26. | 40347 | 50.6% | 27.5%(+23.1)#26 | 37.3%(+13.3)#4,670 |
| 27. | 40071 | 50.5% | 27.5%(+23.0)#27 | 37.3%(+13.2)#4,690 |
| 28. | 40022 | 50.2% | 27.5%(+22.7)#28 | 37.3%(+12.9)#4,790 |
| 29. | 42265 | 50.0% | 27.5%(+22.5)#29 | 37.3%(+12.7)#4,834 |
| 30. | 41005 | 49.8% | 27.5%(+22.3)#30 | 37.3%(+12.5)#4,915 |
| 31. | 41017 | 49.1% | 27.5%(+21.6)#31 | 37.3%(+11.8)#5,130 |
| 32. | 41001 | 49.0% | 27.5%(+21.5)#32 | 37.3%(+11.7)#5,170 |
| 33. | 40207 | 48.6% | 27.5%(+21.1)#33 | 37.3%(+11.3)#5,287 |
| 34. | 41007 | 48.2% | 27.5%(+20.7)#34 | 37.3%(+10.9)#5,430 |
| 35. | 41075 | 47.9% | 27.5%(+20.4)#35 | 37.3%(+10.6)#5,540 |
| 36. | 40514 | 47.9% | 27.5%(+20.4)#36 | 37.3%(+10.6)#5,541 |
| 37. | 40241 | 47.3% | 27.5%(+19.8)#37 | 37.3%(+10.00)#5,733 |
| 38. | 40067 | 46.8% | 27.5%(+19.3)#38 | 37.3%(+9.50)#5,914 |
| 39. | 41051 | 46.7% | 27.5%(+19.2)#39 | 37.3%(+9.40)#5,936 |
| 40. | 40205 | 46.3% | 27.5%(+18.8)#40 | 37.3%(+9.00)#6,088 |
| 41. | 40223 | 46.2% | 27.5%(+18.7)#41 | 37.3%(+8.90)#6,124 |
| 42. | 40509 | 45.6% | 27.5%(+18.1)#42 | 37.3%(+8.30)#6,362 |
| 43. | 40013 | 45.6% | 27.5%(+18.1)#43 | 37.3%(+8.30)#6,376 |
| 44. | 41835 | 45.6% | 27.5%(+18.1)#44 | 37.3%(+8.30)#6,382 |
| 45. | 40031 | 44.6% | 27.5%(+17.1)#45 | 37.3%(+7.30)#6,775 |
| 46. | 41203 | 44.4% | 27.5%(+16.9)#46 | 37.3%(+7.10)#6,876 |
| 47. | 41660 | 44.1% | 27.5%(+16.6)#47 | 37.3%(+6.80)#6,992 |
| 48. | 40858 | 44.1% | 27.5%(+16.6)#48 | 37.3%(+6.80)#6,995 |
| 49. | 41094 | 44.0% | 27.5%(+16.5)#49 | 37.3%(+6.70)#7,009 |
| 50. | 41832 | 43.7% | 27.5%(+16.2)#50 | 37.3%(+6.40)#7,152 |
| 51. | 42280 | 43.6% | 27.5%(+16.1)#51 | 37.3%(+6.30)#7,190 |
| 52. | 40243 | 42.8% | 27.5%(+15.3)#52 | 37.3%(+5.50)#7,527 |
| 53. | 40047 | 42.6% | 27.5%(+15.1)#53 | 37.3%(+5.30)#7,615 |
| 54. | 40222 | 42.5% | 27.5%(+15.0)#54 | 37.3%(+5.20)#7,672 |
| 55. | 41602 | 42.5% | 27.5%(+15.0)#55 | 37.3%(+5.20)#7,703 |
| 56. | 41612 | 42.2% | 27.5%(+14.7)#56 | 37.3%(+4.90)#7,837 |
| 57. | 42350 | 42.1% | 27.5%(+14.6)#57 | 37.3%(+4.80)#7,871 |
| 58. | 40515 | 41.9% | 27.5%(+14.4)#58 | 37.3%(+4.60)#7,921 |
| 59. | 40162 | 41.8% | 27.5%(+14.3)#59 | 37.3%(+4.50)#7,998 |
| 60. | 40516 | 41.8% | 27.5%(+14.3)#60 | 37.3%(+4.50)#8,004 |
| 61. | 40041 | 41.7% | 27.5%(+14.2)#61 | 37.3%(+4.40)#8,058 |
| 62. | 40157 | 41.6% | 27.5%(+14.1)#62 | 37.3%(+4.30)#8,096 |
| 63. | 41751 | 41.4% | 27.5%(+13.9)#63 | 37.3%(+4.10)#8,209 |
| 64. | 40121 | 40.9% | 27.5%(+13.4)#64 | 37.3%(+3.60)#8,456 |
| 65. | 40299 | 40.3% | 27.5%(+12.8)#65 | 37.3%(+3.00)#8,745 |
| 66. | 41043 | 39.9% | 27.5%(+12.4)#66 | 37.3%(+2.60)#8,988 |
| 67. | 40324 | 39.8% | 27.5%(+12.3)#67 | 37.3%(+2.50)#9,001 |
| 68. | 42724 | 39.8% | 27.5%(+12.3)#68 | 37.3%(+2.50)#9,030 |
| 69. | 42733 | 39.7% | 27.5%(+12.2)#69 | 37.3%(+2.40)#9,096 |
| 70. | 40370 | 39.2% | 27.5%(+11.7)#70 | 37.3%(+1.90)#9,340 |
| 71. | 42086 | 39.0% | 27.5%(+11.5)#71 | 37.3%(+1.70)#9,435 |
| 72. | 40175 | 38.7% | 27.5%(+11.2)#72 | 37.3%(+1.40)#9,586 |
| 73. | 40383 | 38.6% | 27.5%(+11.1)#73 | 37.3%(+1.30)#9,628 |
| 74. | 41268 | 38.6% | 27.5%(+11.1)#74 | 37.3%(+1.30)#9,660 |
| 75. | 40502 | 38.4% | 27.5%(+10.9)#75 | 37.3%(+1.10)#9,751 |
| 76. | 41092 | 38.4% | 27.5%(+10.9)#76 | 37.3%(+1.10)#9,770 |
| 77. | 41560 | 38.3% | 27.5%(+10.8)#77 | 37.3%(+1.000)#9,852 |
| 78. | 42103 | 38.2% | 27.5%(+10.7)#78 | 37.3%(+0.900)#9,867 |
| 79. | 40068 | 38.0% | 27.5%(+10.5)#79 | 37.3%(+0.700)#10,009 |
| 80. | 40003 | 37.9% | 27.5%(+10.4)#80 | 37.3%(+0.600)#10,071 |
| 81. | 40291 | 37.8% | 27.5%(+10.3)#81 | 37.3%(+0.500)#10,095 |
| 82. | 40242 | 37.7% | 27.5%(+10.2)#82 | 37.3%(+0.400)#10,148 |
| 83. | 41763 | 37.5% | 27.5%(+10.00)#83 | 37.3%(+0.200)#10,294 |
| 84. | 42740 | 37.1% | 27.5%(+9.60)#84 | 37.3%(-0.200)#10,510 |
| 85. | 40065 | 37.0% | 27.5%(+9.50)#85 | 37.3%(-0.300)#10,538 |
| 86. | 42378 | 37.0% | 27.5%(+9.50)#86 | 37.3%(-0.300)#10,569 |
| 87. | 40178 | 36.9% | 27.5%(+9.40)#87 | 37.3%(-0.400)#10,665 |
| 88. | 42376 | 36.8% | 27.5%(+9.30)#88 | 37.3%(-0.500)#10,697 |
| 89. | 41030 | 36.8% | 27.5%(+9.30)#89 | 37.3%(-0.500)#10,698 |
| 90. | 42366 | 36.7% | 27.5%(+9.20)#90 | 37.3%(-0.600)#10,763 |
| 91. | 40503 | 36.6% | 27.5%(+9.10)#91 | 37.3%(-0.700)#10,811 |
| 92. | 41821 | 36.6% | 27.5%(+9.10)#92 | 37.3%(-0.700)#10,857 |
| 93. | 42079 | 36.5% | 27.5%(+9.00)#93 | 37.3%(-0.800)#10,889 |
| 94. | 40152 | 36.4% | 27.5%(+8.90)#94 | 37.3%(-0.900)#10,951 |
| 95. | 41063 | 35.6% | 27.5%(+8.10)#95 | 37.3%(-1.70)#11,393 |
| 96. | 42452 | 35.6% | 27.5%(+8.10)#96 | 37.3%(-1.70)#11,397 |
| 97. | 41645 | 35.6% | 27.5%(+8.10)#97 | 37.3%(-1.70)#11,409 |
| 98. | 42056 | 35.4% | 27.5%(+7.90)#98 | 37.3%(-1.90)#11,554 |
| 99. | 40358 | 34.9% | 27.5%(+7.40)#99 | 37.3%(-2.40)#11,863 |
| 100. | 41615 | 34.9% | 27.5%(+7.40)#100 | 37.3%(-2.40)#11,869 |
Common Questions
What are the Top 10 Zip Codes with the Highest Percentage of Households with Income Above $100,000 in Kentucky?
Top 10 Zip Codes with the Highest Percentage of Households with Income Above $100,000 in Kentucky are:
What zip code has the Highest Percentage of Households with Income Above $100,000 in Kentucky?
42742 has the Highest Percentage of Households with Income Above $100,000 in Kentucky with 100.0%.
What is the Percentage of Households with Income Above $100,000 in the State of Kentucky?
Percentage of Households with Income Above $100,000 in Kentucky is 27.5%.
What is the Percentage of Households with Income Above $100,000 in the United States?
Percentage of Households with Income Above $100,000 in the United States is 37.3%.