Zip Codes with the Highest Percentage of Population Employed in Transportation & Warehousing in Kentucky
RELATED REPORTS & OPTIONS
Transportation & Warehousing
Kentucky
Compare Zip Codes
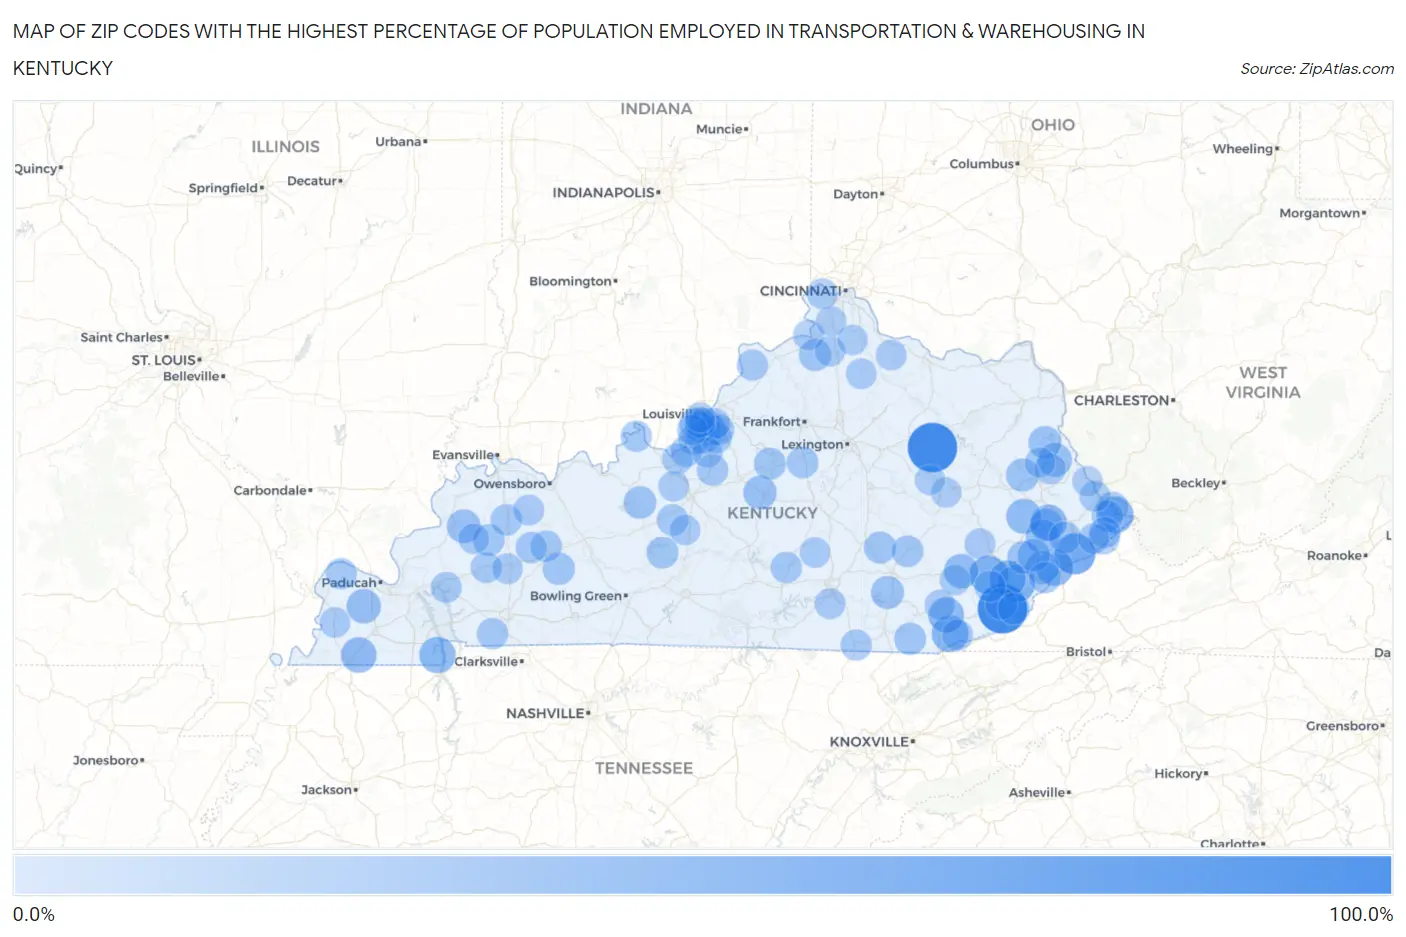
Map of Zip Codes with the Highest Percentage of Population Employed in Transportation & Warehousing in Kentucky
0.0%
100.0%
Zip Codes with the Highest Percentage of Population Employed in Transportation & Warehousing in Kentucky
| Zip Code | % Employed | vs State | vs National | |
| 1. | 40334 | 100.0% | 5.7%(+94.3)#1 | 4.9%(+95.1)#9 |
| 2. | 40849 | 100.0% | 5.7%(+94.3)#2 | 4.9%(+95.1)#22 |
| 3. | 41534 | 59.3% | 5.7%(+53.5)#3 | 4.9%(+54.3)#53 |
| 4. | 41764 | 47.7% | 5.7%(+42.0)#4 | 4.9%(+42.8)#90 |
| 5. | 41821 | 43.8% | 5.7%(+38.0)#5 | 4.9%(+38.8)#109 |
| 6. | 41528 | 40.8% | 5.7%(+35.0)#6 | 4.9%(+35.8)#125 |
| 7. | 40813 | 39.1% | 5.7%(+33.4)#7 | 4.9%(+34.2)#133 |
| 8. | 41810 | 39.0% | 5.7%(+33.2)#8 | 4.9%(+34.0)#136 |
| 9. | 41731 | 38.6% | 5.7%(+32.9)#9 | 4.9%(+33.7)#140 |
| 10. | 42076 | 37.2% | 5.7%(+31.5)#10 | 4.9%(+32.3)#153 |
| 11. | 41655 | 34.8% | 5.7%(+29.1)#11 | 4.9%(+29.9)#168 |
| 12. | 40902 | 33.8% | 5.7%(+28.0)#12 | 4.9%(+28.8)#179 |
| 13. | 42085 | 33.7% | 5.7%(+27.9)#13 | 4.9%(+28.7)#180 |
| 14. | 41632 | 30.9% | 5.7%(+25.2)#14 | 4.9%(+26.0)#211 |
| 15. | 41714 | 29.0% | 5.7%(+23.3)#15 | 4.9%(+24.1)#249 |
| 16. | 42069 | 28.6% | 5.7%(+22.9)#16 | 4.9%(+23.7)#254 |
| 17. | 41264 | 26.2% | 5.7%(+20.4)#17 | 4.9%(+21.2)#308 |
| 18. | 41859 | 25.9% | 5.7%(+20.2)#18 | 4.9%(+21.0)#313 |
| 19. | 42463 | 25.5% | 5.7%(+19.7)#19 | 4.9%(+20.5)#323 |
| 20. | 40061 | 24.7% | 5.7%(+19.0)#20 | 4.9%(+19.8)#342 |
| 21. | 41619 | 23.1% | 5.7%(+17.3)#21 | 4.9%(+18.1)#391 |
| 22. | 41238 | 22.5% | 5.7%(+16.8)#22 | 4.9%(+17.6)#407 |
| 23. | 41855 | 22.3% | 5.7%(+16.5)#23 | 4.9%(+17.3)#419 |
| 24. | 40737 | 22.3% | 5.7%(+16.5)#24 | 4.9%(+17.3)#420 |
| 25. | 41201 | 22.1% | 5.7%(+16.3)#25 | 4.9%(+17.1)#437 |
| 26. | 41834 | 21.8% | 5.7%(+16.0)#26 | 4.9%(+16.8)#445 |
| 27. | 40145 | 20.7% | 5.7%(+14.9)#27 | 4.9%(+15.7)#497 |
| 28. | 41843 | 20.6% | 5.7%(+14.9)#28 | 4.9%(+15.7)#499 |
| 29. | 42323 | 19.2% | 5.7%(+13.5)#29 | 4.9%(+14.3)#582 |
| 30. | 41052 | 18.8% | 5.7%(+13.0)#30 | 4.9%(+13.8)#618 |
| 31. | 40763 | 18.2% | 5.7%(+12.4)#31 | 4.9%(+13.2)#663 |
| 32. | 40118 | 18.1% | 5.7%(+12.4)#32 | 4.9%(+13.2)#675 |
| 33. | 40870 | 18.1% | 5.7%(+12.3)#33 | 4.9%(+13.1)#676 |
| 34. | 40445 | 17.9% | 5.7%(+12.2)#34 | 4.9%(+13.0)#686 |
| 35. | 41560 | 17.9% | 5.7%(+12.1)#35 | 4.9%(+12.9)#694 |
| 36. | 40012 | 17.4% | 5.7%(+11.6)#36 | 4.9%(+12.4)#735 |
| 37. | 40402 | 17.1% | 5.7%(+11.4)#37 | 4.9%(+12.2)#761 |
| 38. | 42729 | 16.9% | 5.7%(+11.2)#38 | 4.9%(+12.0)#782 |
| 39. | 42441 | 16.7% | 5.7%(+10.9)#39 | 4.9%(+11.7)#812 |
| 40. | 40927 | 16.1% | 5.7%(+10.4)#40 | 4.9%(+11.2)#886 |
| 41. | 40372 | 16.0% | 5.7%(+10.3)#41 | 4.9%(+11.1)#907 |
| 42. | 41544 | 16.0% | 5.7%(+10.2)#42 | 4.9%(+11.0)#915 |
| 43. | 40150 | 15.4% | 5.7%(+9.70)#43 | 4.9%(+10.5)#982 |
| 44. | 42788 | 15.3% | 5.7%(+9.57)#44 | 4.9%(+10.4)#1,005 |
| 45. | 41837 | 15.1% | 5.7%(+9.37)#45 | 4.9%(+10.2)#1,037 |
| 46. | 42456 | 15.0% | 5.7%(+9.28)#46 | 4.9%(+10.1)#1,059 |
| 47. | 42236 | 14.9% | 5.7%(+9.16)#47 | 4.9%(+9.95)#1,086 |
| 48. | 42374 | 14.7% | 5.7%(+8.96)#48 | 4.9%(+9.76)#1,123 |
| 49. | 42325 | 14.7% | 5.7%(+8.94)#49 | 4.9%(+9.74)#1,125 |
| 50. | 41558 | 14.7% | 5.7%(+8.93)#50 | 4.9%(+9.73)#1,127 |
| 51. | 40177 | 14.6% | 5.7%(+8.81)#51 | 4.9%(+9.61)#1,152 |
| 52. | 40209 | 14.5% | 5.7%(+8.79)#52 | 4.9%(+9.59)#1,158 |
| 53. | 42528 | 14.5% | 5.7%(+8.72)#53 | 4.9%(+9.52)#1,174 |
| 54. | 41254 | 14.1% | 5.7%(+8.34)#54 | 4.9%(+9.14)#1,264 |
| 55. | 41548 | 14.0% | 5.7%(+8.30)#55 | 4.9%(+9.10)#1,273 |
| 56. | 40219 | 13.9% | 5.7%(+8.11)#56 | 4.9%(+8.91)#1,311 |
| 57. | 41777 | 13.8% | 5.7%(+8.10)#57 | 4.9%(+8.90)#1,315 |
| 58. | 40229 | 13.7% | 5.7%(+7.97)#58 | 4.9%(+8.77)#1,340 |
| 59. | 42022 | 13.7% | 5.7%(+7.95)#59 | 4.9%(+8.75)#1,347 |
| 60. | 40006 | 13.5% | 5.7%(+7.80)#60 | 4.9%(+8.60)#1,382 |
| 61. | 42649 | 13.5% | 5.7%(+7.79)#61 | 4.9%(+8.59)#1,383 |
| 62. | 40104 | 13.4% | 5.7%(+7.69)#62 | 4.9%(+8.49)#1,411 |
| 63. | 41524 | 13.4% | 5.7%(+7.67)#63 | 4.9%(+8.47)#1,422 |
| 64. | 40216 | 13.2% | 5.7%(+7.44)#64 | 4.9%(+8.24)#1,490 |
| 65. | 42408 | 12.9% | 5.7%(+7.19)#65 | 4.9%(+7.99)#1,550 |
| 66. | 40272 | 12.8% | 5.7%(+7.10)#66 | 4.9%(+7.90)#1,577 |
| 67. | 40856 | 12.8% | 5.7%(+7.10)#67 | 4.9%(+7.89)#1,578 |
| 68. | 40228 | 12.8% | 5.7%(+7.02)#68 | 4.9%(+7.82)#1,605 |
| 69. | 42038 | 12.6% | 5.7%(+6.90)#69 | 4.9%(+7.70)#1,639 |
| 70. | 41514 | 12.6% | 5.7%(+6.81)#70 | 4.9%(+7.61)#1,663 |
| 71. | 40214 | 12.5% | 5.7%(+6.71)#71 | 4.9%(+7.51)#1,700 |
| 72. | 40155 | 12.3% | 5.7%(+6.51)#72 | 4.9%(+7.31)#1,762 |
| 73. | 41048 | 12.1% | 5.7%(+6.34)#73 | 4.9%(+7.14)#1,817 |
| 74. | 42327 | 12.1% | 5.7%(+6.33)#74 | 4.9%(+7.13)#1,823 |
| 75. | 42518 | 11.9% | 5.7%(+6.20)#75 | 4.9%(+7.00)#1,887 |
| 76. | 41095 | 11.9% | 5.7%(+6.18)#76 | 4.9%(+6.98)#1,897 |
| 77. | 42442 | 11.9% | 5.7%(+6.16)#77 | 4.9%(+6.95)#1,904 |
| 78. | 41727 | 11.8% | 5.7%(+6.09)#78 | 4.9%(+6.89)#1,928 |
| 79. | 41004 | 11.8% | 5.7%(+6.05)#79 | 4.9%(+6.85)#1,945 |
| 80. | 41003 | 11.6% | 5.7%(+5.82)#80 | 4.9%(+6.62)#2,043 |
| 81. | 41540 | 11.4% | 5.7%(+5.65)#81 | 4.9%(+6.45)#2,128 |
| 82. | 42450 | 11.1% | 5.7%(+5.39)#82 | 4.9%(+6.19)#2,254 |
| 83. | 41035 | 11.0% | 5.7%(+5.26)#83 | 4.9%(+6.06)#2,320 |
| 84. | 40218 | 11.0% | 5.7%(+5.21)#84 | 4.9%(+6.01)#2,341 |
| 85. | 42566 | 10.9% | 5.7%(+5.11)#85 | 4.9%(+5.91)#2,394 |
| 86. | 40215 | 10.8% | 5.7%(+5.09)#86 | 4.9%(+5.89)#2,401 |
| 87. | 42784 | 10.8% | 5.7%(+5.04)#87 | 4.9%(+5.84)#2,432 |
| 88. | 40982 | 10.8% | 5.7%(+5.04)#88 | 4.9%(+5.84)#2,435 |
| 89. | 42021 | 10.8% | 5.7%(+5.01)#89 | 4.9%(+5.81)#2,446 |
| 90. | 40162 | 10.7% | 5.7%(+4.97)#90 | 4.9%(+5.77)#2,467 |
| 91. | 41033 | 10.7% | 5.7%(+4.91)#91 | 4.9%(+5.70)#2,499 |
| 92. | 41231 | 10.5% | 5.7%(+4.73)#92 | 4.9%(+5.53)#2,598 |
| 93. | 40165 | 10.4% | 5.7%(+4.65)#93 | 4.9%(+5.45)#2,645 |
| 94. | 40258 | 10.3% | 5.7%(+4.54)#94 | 4.9%(+5.34)#2,715 |
| 95. | 40914 | 10.3% | 5.7%(+4.53)#95 | 4.9%(+5.33)#2,721 |
| 96. | 41365 | 10.1% | 5.7%(+4.34)#96 | 4.9%(+5.14)#2,837 |
| 97. | 40210 | 10.0% | 5.7%(+4.26)#97 | 4.9%(+5.05)#2,881 |
| 98. | 40380 | 10.0% | 5.7%(+4.24)#98 | 4.9%(+5.04)#2,904 |
| 99. | 41094 | 9.8% | 5.7%(+4.08)#99 | 4.9%(+4.88)#3,004 |
| 100. | 41257 | 9.8% | 5.7%(+4.02)#100 | 4.9%(+4.82)#3,033 |
Common Questions
What are the Top 10 Zip Codes with the Highest Percentage of Population Employed in Transportation & Warehousing in Kentucky?
Top 10 Zip Codes with the Highest Percentage of Population Employed in Transportation & Warehousing in Kentucky are:
What zip code has the Highest Percentage of Population Employed in Transportation & Warehousing in Kentucky?
40334 has the Highest Percentage of Population Employed in Transportation & Warehousing in Kentucky with 100.0%.
What is the Percentage of Population Employed in Transportation & Warehousing in the State of Kentucky?
Percentage of Population Employed in Transportation & Warehousing in Kentucky is 5.7%.
What is the Percentage of Population Employed in Transportation & Warehousing in the United States?
Percentage of Population Employed in Transportation & Warehousing in the United States is 4.9%.