Zip Codes with the Highest Percentage of Population with a Degree in Science and Engineering in Kentucky
RELATED REPORTS & OPTIONS
Science and Engineering
Kentucky
Compare Zip Codes
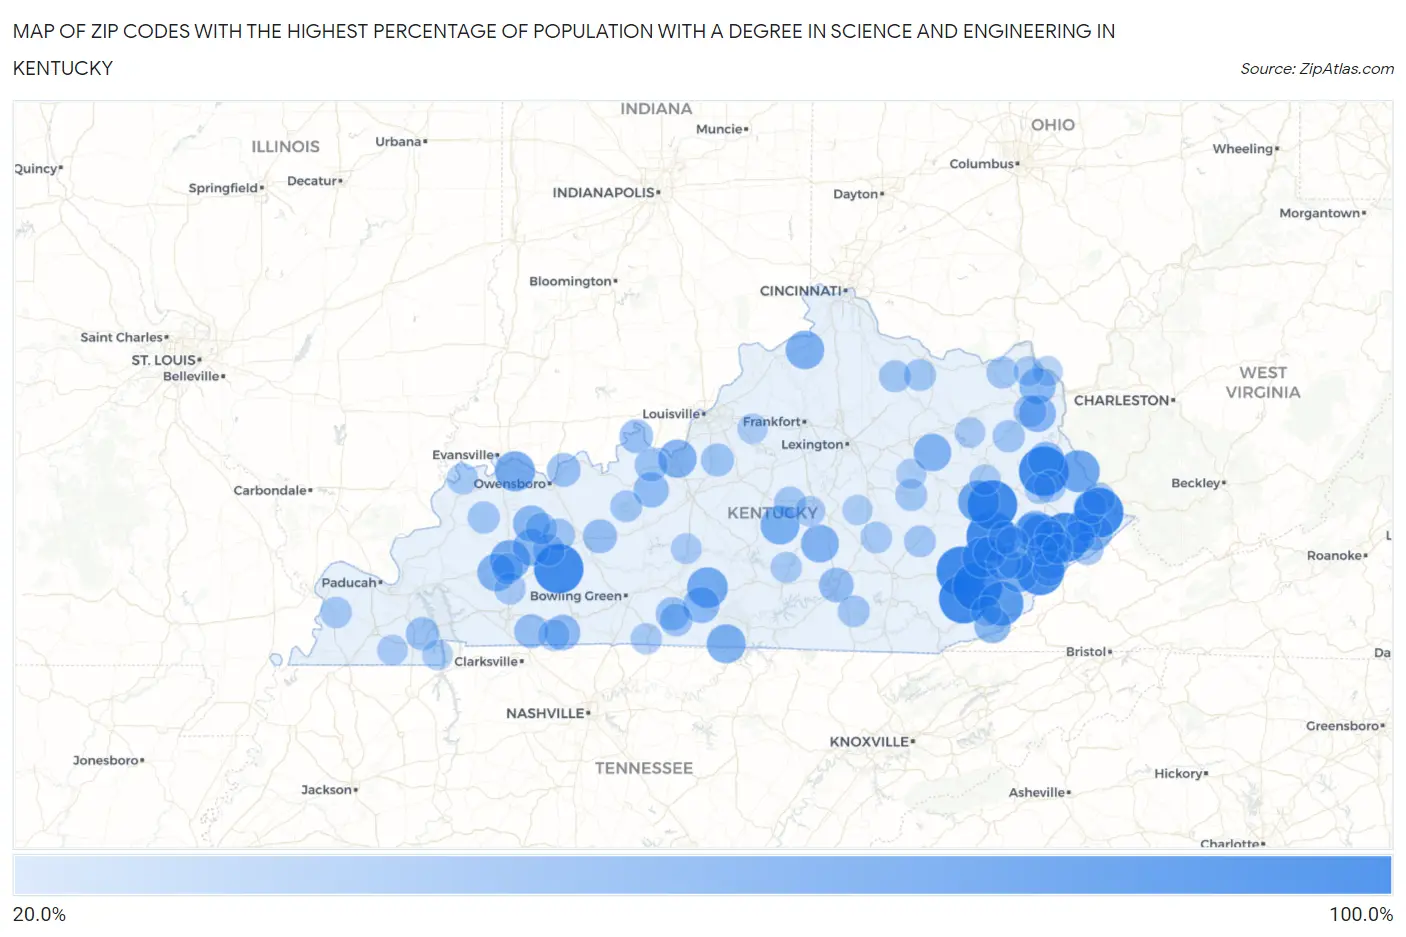
Map of Zip Codes with the Highest Percentage of Population with a Degree in Science and Engineering in Kentucky
20.0%
100.0%
Zip Codes with the Highest Percentage of Population with a Degree in Science and Engineering in Kentucky
| Zip Code | % Graduates | vs State | vs National | |
| 1. | 42323 | 100.0% | 11.9%(+88.1)#1 | 9.8%(+90.2)#5 |
| 2. | 41714 | 100.0% | 11.9%(+88.1)#2 | 9.8%(+90.2)#9 |
| 3. | 41263 | 100.0% | 11.9%(+88.1)#3 | 9.8%(+90.2)#33 |
| 4. | 41367 | 100.0% | 11.9%(+88.1)#4 | 9.8%(+90.2)#34 |
| 5. | 41560 | 100.0% | 11.9%(+88.1)#5 | 9.8%(+90.2)#46 |
| 6. | 40874 | 100.0% | 11.9%(+88.1)#6 | 9.8%(+90.2)#70 |
| 7. | 40844 | 100.0% | 11.9%(+88.1)#7 | 9.8%(+90.2)#79 |
| 8. | 41567 | 100.0% | 11.9%(+88.1)#8 | 9.8%(+90.2)#87 |
| 9. | 41366 | 100.0% | 11.9%(+88.1)#9 | 9.8%(+90.2)#104 |
| 10. | 41815 | 93.0% | 11.9%(+81.2)#10 | 9.8%(+83.2)#110 |
| 11. | 40870 | 80.0% | 11.9%(+68.1)#11 | 9.8%(+70.2)#133 |
| 12. | 41859 | 78.3% | 11.9%(+66.4)#12 | 9.8%(+68.5)#140 |
| 13. | 41203 | 70.4% | 11.9%(+58.5)#13 | 9.8%(+60.6)#176 |
| 14. | 41385 | 68.4% | 11.9%(+56.5)#14 | 9.8%(+58.6)#192 |
| 15. | 41723 | 65.1% | 11.9%(+53.3)#15 | 9.8%(+55.3)#221 |
| 16. | 42154 | 64.9% | 11.9%(+53.1)#16 | 9.8%(+55.1)#223 |
| 17. | 42458 | 62.8% | 11.9%(+51.0)#17 | 9.8%(+53.1)#232 |
| 18. | 42440 | 62.5% | 11.9%(+50.6)#18 | 9.8%(+52.7)#234 |
| 19. | 41804 | 60.5% | 11.9%(+48.6)#19 | 9.8%(+50.7)#251 |
| 20. | 40009 | 59.0% | 11.9%(+47.1)#20 | 9.8%(+49.2)#270 |
| 21. | 42151 | 58.3% | 11.9%(+46.5)#21 | 9.8%(+48.6)#279 |
| 22. | 41086 | 57.1% | 11.9%(+45.2)#22 | 9.8%(+47.3)#293 |
| 23. | 40155 | 55.8% | 11.9%(+43.9)#23 | 9.8%(+46.0)#308 |
| 24. | 40442 | 54.2% | 11.9%(+42.3)#24 | 9.8%(+44.4)#336 |
| 25. | 42453 | 54.1% | 11.9%(+42.2)#25 | 9.8%(+44.3)#337 |
| 26. | 41839 | 54.0% | 11.9%(+42.2)#26 | 9.8%(+44.2)#338 |
| 27. | 40346 | 53.1% | 11.9%(+41.2)#27 | 9.8%(+43.3)#347 |
| 28. | 42325 | 51.1% | 11.9%(+39.3)#28 | 9.8%(+41.4)#367 |
| 29. | 41132 | 50.0% | 11.9%(+38.1)#29 | 9.8%(+40.2)#382 |
| 30. | 41650 | 50.0% | 11.9%(+38.1)#30 | 9.8%(+40.2)#384 |
| 31. | 42371 | 49.3% | 11.9%(+37.4)#31 | 9.8%(+39.5)#433 |
| 32. | 40815 | 49.2% | 11.9%(+37.3)#32 | 9.8%(+39.4)#437 |
| 33. | 41232 | 48.7% | 11.9%(+36.9)#33 | 9.8%(+38.9)#439 |
| 34. | 42130 | 48.3% | 11.9%(+36.4)#34 | 9.8%(+38.5)#448 |
| 35. | 41121 | 48.2% | 11.9%(+36.4)#35 | 9.8%(+38.4)#450 |
| 36. | 41759 | 46.9% | 11.9%(+35.1)#36 | 9.8%(+37.1)#468 |
| 37. | 41630 | 46.7% | 11.9%(+34.9)#37 | 9.8%(+36.9)#470 |
| 38. | 42265 | 45.3% | 11.9%(+33.5)#38 | 9.8%(+35.5)#513 |
| 39. | 41554 | 44.7% | 11.9%(+32.8)#39 | 9.8%(+34.9)#531 |
| 40. | 40115 | 43.6% | 11.9%(+31.7)#40 | 9.8%(+33.8)#555 |
| 41. | 41751 | 43.5% | 11.9%(+31.6)#41 | 9.8%(+33.7)#559 |
| 42. | 41825 | 42.9% | 11.9%(+31.0)#42 | 9.8%(+33.1)#576 |
| 43. | 42533 | 41.6% | 11.9%(+29.7)#43 | 9.8%(+31.8)#618 |
| 44. | 42286 | 39.9% | 11.9%(+28.1)#44 | 9.8%(+30.1)#689 |
| 45. | 42349 | 39.8% | 11.9%(+27.9)#45 | 9.8%(+30.0)#690 |
| 46. | 40104 | 38.1% | 11.9%(+26.2)#46 | 9.8%(+28.3)#746 |
| 47. | 42355 | 37.9% | 11.9%(+26.1)#47 | 9.8%(+28.2)#754 |
| 48. | 42156 | 37.5% | 11.9%(+25.6)#48 | 9.8%(+27.7)#776 |
| 49. | 42036 | 36.7% | 11.9%(+24.9)#49 | 9.8%(+26.9)#827 |
| 50. | 40142 | 35.9% | 11.9%(+24.1)#50 | 9.8%(+26.1)#876 |
| 51. | 40110 | 35.7% | 11.9%(+23.9)#51 | 9.8%(+25.9)#891 |
| 52. | 41719 | 35.4% | 11.9%(+23.5)#52 | 9.8%(+25.6)#915 |
| 53. | 41557 | 35.2% | 11.9%(+23.4)#53 | 9.8%(+25.4)#923 |
| 54. | 41564 | 34.9% | 11.9%(+23.0)#54 | 9.8%(+25.1)#940 |
| 55. | 42328 | 34.6% | 11.9%(+22.8)#55 | 9.8%(+24.8)#958 |
| 56. | 41146 | 34.4% | 11.9%(+22.5)#56 | 9.8%(+24.6)#973 |
| 57. | 41722 | 34.4% | 11.9%(+22.5)#57 | 9.8%(+24.6)#975 |
| 58. | 42123 | 34.2% | 11.9%(+22.4)#58 | 9.8%(+24.4)#979 |
| 59. | 41503 | 34.1% | 11.9%(+22.2)#59 | 9.8%(+24.3)#991 |
| 60. | 41522 | 33.6% | 11.9%(+21.7)#60 | 9.8%(+23.8)#1,021 |
| 61. | 41849 | 33.3% | 11.9%(+21.5)#61 | 9.8%(+23.6)#1,058 |
| 62. | 41171 | 33.2% | 11.9%(+21.3)#62 | 9.8%(+23.4)#1,072 |
| 63. | 42409 | 32.5% | 11.9%(+20.7)#63 | 9.8%(+22.7)#1,099 |
| 64. | 41740 | 32.3% | 11.9%(+20.5)#64 | 9.8%(+22.5)#1,111 |
| 65. | 41055 | 32.2% | 11.9%(+20.4)#65 | 9.8%(+22.5)#1,119 |
| 66. | 42330 | 32.1% | 11.9%(+20.2)#66 | 9.8%(+22.3)#1,134 |
| 67. | 41141 | 32.0% | 11.9%(+20.1)#67 | 9.8%(+22.2)#1,139 |
| 68. | 41064 | 31.9% | 11.9%(+20.0)#68 | 9.8%(+22.1)#1,145 |
| 69. | 41265 | 31.7% | 11.9%(+19.9)#69 | 9.8%(+22.0)#1,156 |
| 70. | 40336 | 31.6% | 11.9%(+19.8)#70 | 9.8%(+21.9)#1,162 |
| 71. | 42350 | 31.6% | 11.9%(+19.7)#71 | 9.8%(+21.8)#1,172 |
| 72. | 41562 | 31.4% | 11.9%(+19.6)#72 | 9.8%(+21.6)#1,183 |
| 73. | 40486 | 31.4% | 11.9%(+19.5)#73 | 9.8%(+21.6)#1,186 |
| 74. | 42634 | 31.3% | 11.9%(+19.4)#74 | 9.8%(+21.5)#1,196 |
| 75. | 40468 | 31.3% | 11.9%(+19.4)#75 | 9.8%(+21.5)#1,198 |
| 76. | 40152 | 31.2% | 11.9%(+19.4)#76 | 9.8%(+21.5)#1,202 |
| 77. | 42204 | 30.4% | 11.9%(+18.5)#77 | 9.8%(+20.6)#1,279 |
| 78. | 40460 | 30.4% | 11.9%(+18.5)#78 | 9.8%(+20.6)#1,282 |
| 79. | 42217 | 30.3% | 11.9%(+18.4)#79 | 9.8%(+20.5)#1,288 |
| 80. | 42023 | 29.2% | 11.9%(+17.4)#80 | 9.8%(+19.5)#1,385 |
| 81. | 42442 | 29.2% | 11.9%(+17.3)#81 | 9.8%(+19.4)#1,390 |
| 82. | 42528 | 28.8% | 11.9%(+16.9)#82 | 9.8%(+19.0)#1,434 |
| 83. | 42120 | 28.6% | 11.9%(+16.8)#83 | 9.8%(+18.8)#1,449 |
| 84. | 42461 | 28.6% | 11.9%(+16.7)#84 | 9.8%(+18.8)#1,456 |
| 85. | 41636 | 28.3% | 11.9%(+16.4)#85 | 9.8%(+18.5)#1,501 |
| 86. | 41408 | 28.3% | 11.9%(+16.4)#86 | 9.8%(+18.5)#1,504 |
| 87. | 41828 | 28.1% | 11.9%(+16.3)#87 | 9.8%(+18.3)#1,517 |
| 88. | 42765 | 27.4% | 11.9%(+15.6)#88 | 9.8%(+17.6)#1,602 |
| 89. | 41216 | 27.1% | 11.9%(+15.3)#89 | 9.8%(+17.3)#1,651 |
| 90. | 40440 | 26.3% | 11.9%(+14.5)#90 | 9.8%(+16.5)#1,736 |
| 91. | 42040 | 26.3% | 11.9%(+14.5)#91 | 9.8%(+16.5)#1,740 |
| 92. | 40313 | 26.2% | 11.9%(+14.4)#92 | 9.8%(+16.4)#1,759 |
| 93. | 42076 | 25.9% | 11.9%(+14.1)#93 | 9.8%(+16.1)#1,799 |
| 94. | 41183 | 25.9% | 11.9%(+14.0)#94 | 9.8%(+16.1)#1,808 |
| 95. | 40022 | 25.8% | 11.9%(+14.0)#95 | 9.8%(+16.1)#1,810 |
| 96. | 41572 | 25.5% | 11.9%(+13.7)#96 | 9.8%(+15.7)#1,858 |
| 97. | 40806 | 25.5% | 11.9%(+13.6)#97 | 9.8%(+15.7)#1,862 |
| 98. | 40312 | 25.4% | 11.9%(+13.6)#98 | 9.8%(+15.6)#1,877 |
| 99. | 41144 | 25.4% | 11.9%(+13.5)#99 | 9.8%(+15.6)#1,885 |
| 100. | 40461 | 25.2% | 11.9%(+13.4)#100 | 9.8%(+15.5)#1,908 |
Common Questions
What are the Top 10 Zip Codes with the Highest Percentage of Population with a Degree in Science and Engineering in Kentucky?
Top 10 Zip Codes with the Highest Percentage of Population with a Degree in Science and Engineering in Kentucky are:
What zip code has the Highest Percentage of Population with a Degree in Science and Engineering in Kentucky?
42323 has the Highest Percentage of Population with a Degree in Science and Engineering in Kentucky with 100.0%.
What is the Percentage of Population with a Degree in Science and Engineering in the State of Kentucky?
Percentage of Population with a Degree in Science and Engineering in Kentucky is 11.9%.
What is the Percentage of Population with a Degree in Science and Engineering in the United States?
Percentage of Population with a Degree in Science and Engineering in the United States is 9.8%.