Zip Codes with the Highest Percentage of Households Heated by Fuel Oil / Kerosene in Kentucky
RELATED REPORTS & OPTIONS
Fuel Oil Heating
Kentucky
Compare Zip Codes
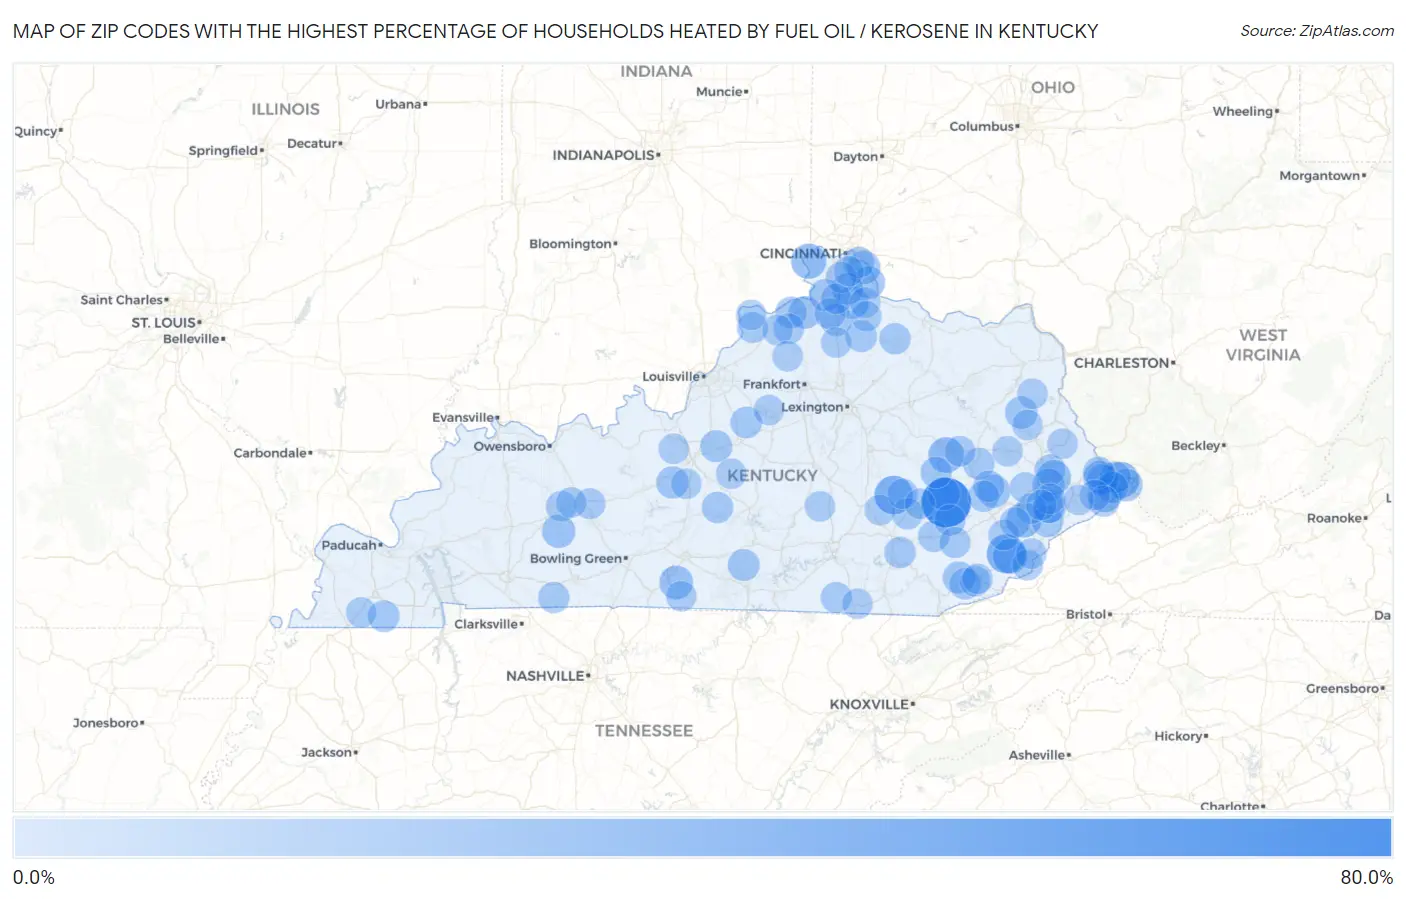
Map of Zip Codes with the Highest Percentage of Households Heated by Fuel Oil / Kerosene in Kentucky
0.0%
80.0%
Zip Codes with the Highest Percentage of Households Heated by Fuel Oil / Kerosene in Kentucky
| Zip Code | Fuel Oil Heating | vs State | vs National | |
| 1. | 41364 | 78.4% | 0.70%(+77.7)#1 | 4.2%(+74.2)#292 |
| 2. | 41735 | 35.8% | 0.70%(+35.1)#2 | 4.2%(+31.6)#2,879 |
| 3. | 40481 | 34.4% | 0.70%(+33.7)#3 | 4.2%(+30.2)#3,009 |
| 4. | 41547 | 23.6% | 0.70%(+22.9)#4 | 4.2%(+19.4)#3,913 |
| 5. | 41365 | 23.3% | 0.70%(+22.6)#5 | 4.2%(+19.1)#3,944 |
| 6. | 41834 | 21.3% | 0.70%(+20.6)#6 | 4.2%(+17.1)#4,145 |
| 7. | 41080 | 21.1% | 0.70%(+20.4)#7 | 4.2%(+16.9)#4,163 |
| 8. | 41819 | 20.0% | 0.70%(+19.3)#8 | 4.2%(+15.8)#4,284 |
| 9. | 41603 | 18.6% | 0.70%(+17.9)#9 | 4.2%(+14.4)#4,440 |
| 10. | 41524 | 17.2% | 0.70%(+16.5)#10 | 4.2%(+13.0)#4,647 |
| 11. | 42123 | 15.8% | 0.70%(+15.1)#11 | 4.2%(+11.6)#4,868 |
| 12. | 41543 | 14.3% | 0.70%(+13.6)#12 | 4.2%(+10.1)#5,130 |
| 13. | 42323 | 14.2% | 0.70%(+13.5)#13 | 4.2%(+10.00)#5,145 |
| 14. | 41059 | 13.8% | 0.70%(+13.1)#14 | 4.2%(+9.60)#5,212 |
| 15. | 41612 | 13.3% | 0.70%(+12.6)#15 | 4.2%(+9.10)#5,294 |
| 16. | 41317 | 13.2% | 0.70%(+12.5)#16 | 4.2%(+9.00)#5,311 |
| 17. | 41314 | 12.9% | 0.70%(+12.2)#17 | 4.2%(+8.70)#5,364 |
| 18. | 41655 | 12.1% | 0.70%(+11.4)#18 | 4.2%(+7.90)#5,552 |
| 19. | 41568 | 12.0% | 0.70%(+11.3)#19 | 4.2%(+7.80)#5,582 |
| 20. | 41033 | 11.7% | 0.70%(+11.0)#20 | 4.2%(+7.50)#5,644 |
| 21. | 41086 | 11.5% | 0.70%(+10.8)#21 | 4.2%(+7.30)#5,706 |
| 22. | 41007 | 11.4% | 0.70%(+10.7)#22 | 4.2%(+7.20)#5,720 |
| 23. | 41159 | 11.3% | 0.70%(+10.6)#23 | 4.2%(+7.10)#5,750 |
| 24. | 42788 | 10.5% | 0.70%(+9.80)#24 | 4.2%(+6.30)#5,952 |
| 25. | 41097 | 9.7% | 0.70%(+9.00)#25 | 4.2%(+5.50)#6,145 |
| 26. | 40107 | 9.4% | 0.70%(+8.70)#26 | 4.2%(+5.20)#6,246 |
| 27. | 40988 | 9.2% | 0.70%(+8.50)#27 | 4.2%(+5.00)#6,312 |
| 28. | 41092 | 9.0% | 0.70%(+8.30)#28 | 4.2%(+4.80)#6,354 |
| 29. | 41555 | 9.0% | 0.70%(+8.30)#29 | 4.2%(+4.80)#6,363 |
| 30. | 42715 | 8.7% | 0.70%(+8.00)#30 | 4.2%(+4.50)#6,474 |
| 31. | 41528 | 8.6% | 0.70%(+7.90)#31 | 4.2%(+4.40)#6,505 |
| 32. | 41063 | 8.4% | 0.70%(+7.70)#32 | 4.2%(+4.20)#6,546 |
| 33. | 41553 | 8.4% | 0.70%(+7.70)#33 | 4.2%(+4.20)#6,548 |
| 34. | 41003 | 8.1% | 0.70%(+7.40)#34 | 4.2%(+3.90)#6,678 |
| 35. | 42079 | 8.0% | 0.70%(+7.30)#35 | 4.2%(+3.80)#6,711 |
| 36. | 41812 | 8.0% | 0.70%(+7.30)#36 | 4.2%(+3.80)#6,727 |
| 37. | 40020 | 7.9% | 0.70%(+7.20)#37 | 4.2%(+3.70)#6,770 |
| 38. | 41083 | 7.8% | 0.70%(+7.10)#38 | 4.2%(+3.60)#6,797 |
| 39. | 41385 | 7.7% | 0.70%(+7.00)#39 | 4.2%(+3.50)#6,846 |
| 40. | 40740 | 7.5% | 0.70%(+6.80)#40 | 4.2%(+3.30)#6,922 |
| 41. | 41085 | 7.2% | 0.70%(+6.50)#41 | 4.2%(+3.00)#7,044 |
| 42. | 40819 | 7.1% | 0.70%(+6.40)#42 | 4.2%(+2.90)#7,079 |
| 43. | 42782 | 7.1% | 0.70%(+6.40)#43 | 4.2%(+2.90)#7,080 |
| 44. | 41535 | 7.1% | 0.70%(+6.40)#44 | 4.2%(+2.90)#7,083 |
| 45. | 41311 | 7.0% | 0.70%(+6.30)#45 | 4.2%(+2.80)#7,122 |
| 46. | 41339 | 6.9% | 0.70%(+6.20)#46 | 4.2%(+2.70)#7,150 |
| 47. | 40962 | 6.8% | 0.70%(+6.10)#47 | 4.2%(+2.60)#7,189 |
| 48. | 40402 | 6.5% | 0.70%(+5.80)#48 | 4.2%(+2.30)#7,343 |
| 49. | 40972 | 6.5% | 0.70%(+5.80)#49 | 4.2%(+2.30)#7,348 |
| 50. | 41348 | 6.5% | 0.70%(+5.80)#50 | 4.2%(+2.30)#7,353 |
| 51. | 41064 | 6.4% | 0.70%(+5.70)#51 | 4.2%(+2.20)#7,395 |
| 52. | 42204 | 6.4% | 0.70%(+5.70)#52 | 4.2%(+2.20)#7,411 |
| 53. | 41606 | 6.4% | 0.70%(+5.70)#53 | 4.2%(+2.20)#7,416 |
| 54. | 41601 | 5.9% | 0.70%(+5.20)#54 | 4.2%(+1.70)#7,657 |
| 55. | 40914 | 5.7% | 0.70%(+5.00)#55 | 4.2%(+1.50)#7,762 |
| 56. | 40006 | 5.4% | 0.70%(+4.70)#56 | 4.2%(+1.20)#7,902 |
| 57. | 42647 | 5.4% | 0.70%(+4.70)#57 | 4.2%(+1.20)#7,906 |
| 58. | 41548 | 5.2% | 0.70%(+4.50)#58 | 4.2%(+1.00)#8,031 |
| 59. | 41051 | 5.1% | 0.70%(+4.40)#59 | 4.2%(+0.900)#8,058 |
| 60. | 42333 | 5.1% | 0.70%(+4.40)#60 | 4.2%(+0.900)#8,100 |
| 61. | 40855 | 5.1% | 0.70%(+4.40)#61 | 4.2%(+0.900)#8,101 |
| 62. | 41035 | 4.8% | 0.70%(+4.10)#62 | 4.2%(+0.600)#8,229 |
| 63. | 41301 | 4.8% | 0.70%(+4.10)#63 | 4.2%(+0.600)#8,241 |
| 64. | 42369 | 4.7% | 0.70%(+4.00)#64 | 4.2%(+0.500)#8,350 |
| 65. | 41030 | 4.6% | 0.70%(+3.90)#65 | 4.2%(+0.400)#8,386 |
| 66. | 41774 | 4.4% | 0.70%(+3.70)#66 | 4.2%(+0.200)#8,519 |
| 67. | 41098 | 4.3% | 0.70%(+3.60)#67 | 4.2%(+0.100)#8,599 |
| 68. | 40075 | 4.1% | 0.70%(+3.40)#68 | 4.2%(-0.100)#8,761 |
| 69. | 40445 | 4.1% | 0.70%(+3.40)#69 | 4.2%(-0.100)#8,765 |
| 70. | 41554 | 4.0% | 0.70%(+3.30)#70 | 4.2%(-0.200)#8,839 |
| 71. | 41636 | 4.0% | 0.70%(+3.30)#71 | 4.2%(-0.200)#8,844 |
| 72. | 41844 | 3.9% | 0.70%(+3.20)#72 | 4.2%(-0.300)#8,889 |
| 73. | 40824 | 3.9% | 0.70%(+3.20)#73 | 4.2%(-0.300)#8,906 |
| 74. | 40862 | 3.9% | 0.70%(+3.20)#74 | 4.2%(-0.300)#8,911 |
| 75. | 40447 | 3.8% | 0.70%(+3.10)#75 | 4.2%(-0.400)#8,948 |
| 76. | 41006 | 3.8% | 0.70%(+3.10)#76 | 4.2%(-0.400)#8,969 |
| 77. | 42088 | 3.8% | 0.70%(+3.10)#77 | 4.2%(-0.400)#8,978 |
| 78. | 41214 | 3.8% | 0.70%(+3.10)#78 | 4.2%(-0.400)#8,989 |
| 79. | 41180 | 3.8% | 0.70%(+3.10)#79 | 4.2%(-0.400)#9,002 |
| 80. | 42635 | 3.7% | 0.70%(+3.00)#80 | 4.2%(-0.500)#9,063 |
| 81. | 40486 | 3.7% | 0.70%(+3.00)#81 | 4.2%(-0.500)#9,072 |
| 82. | 40052 | 3.7% | 0.70%(+3.00)#82 | 4.2%(-0.500)#9,091 |
| 83. | 42354 | 3.7% | 0.70%(+3.00)#83 | 4.2%(-0.500)#9,102 |
| 84. | 41465 | 3.6% | 0.70%(+2.90)#84 | 4.2%(-0.600)#9,123 |
| 85. | 41040 | 3.6% | 0.70%(+2.90)#85 | 4.2%(-0.600)#9,130 |
| 86. | 41010 | 3.6% | 0.70%(+2.90)#86 | 4.2%(-0.600)#9,142 |
| 87. | 42776 | 3.6% | 0.70%(+2.90)#87 | 4.2%(-0.600)#9,155 |
| 88. | 41640 | 3.6% | 0.70%(+2.90)#88 | 4.2%(-0.600)#9,166 |
| 89. | 40442 | 3.6% | 0.70%(+2.90)#89 | 4.2%(-0.600)#9,169 |
| 90. | 40046 | 3.5% | 0.70%(+2.80)#90 | 4.2%(-0.700)#9,263 |
| 91. | 41862 | 3.5% | 0.70%(+2.80)#91 | 4.2%(-0.700)#9,271 |
| 92. | 40057 | 3.4% | 0.70%(+2.70)#92 | 4.2%(-0.800)#9,332 |
| 93. | 41773 | 3.4% | 0.70%(+2.70)#93 | 4.2%(-0.800)#9,358 |
| 94. | 40854 | 3.4% | 0.70%(+2.70)#94 | 4.2%(-0.800)#9,367 |
| 95. | 41015 | 3.3% | 0.70%(+2.60)#95 | 4.2%(-0.900)#9,395 |
| 96. | 41219 | 3.3% | 0.70%(+2.60)#96 | 4.2%(-0.900)#9,439 |
| 97. | 40162 | 3.2% | 0.70%(+2.50)#97 | 4.2%(-1.00)#9,508 |
| 98. | 41562 | 3.2% | 0.70%(+2.50)#98 | 4.2%(-1.00)#9,530 |
| 99. | 42133 | 3.2% | 0.70%(+2.50)#99 | 4.2%(-1.00)#9,543 |
| 100. | 40045 | 3.1% | 0.70%(+2.40)#100 | 4.2%(-1.10)#9,608 |
Common Questions
What are the Top 10 Zip Codes with the Highest Percentage of Households Heated by Fuel Oil / Kerosene in Kentucky?
Top 10 Zip Codes with the Highest Percentage of Households Heated by Fuel Oil / Kerosene in Kentucky are:
What zip code has the Highest Percentage of Households Heated by Fuel Oil / Kerosene in Kentucky?
41364 has the Highest Percentage of Households Heated by Fuel Oil / Kerosene in Kentucky with 78.4%.
What is the Percentage of Households Heated by Fuel Oil / Kerosene in the State of Kentucky?
Percentage of Households Heated by Fuel Oil / Kerosene in Kentucky is 0.70%.
What is the Percentage of Households Heated by Fuel Oil / Kerosene in the United States?
Percentage of Households Heated by Fuel Oil / Kerosene in the United States is 4.2%.