Zip Codes with the Largest Greek Community in Kentucky
RELATED REPORTS & OPTIONS
Greek
Kentucky
Compare Zip Codes
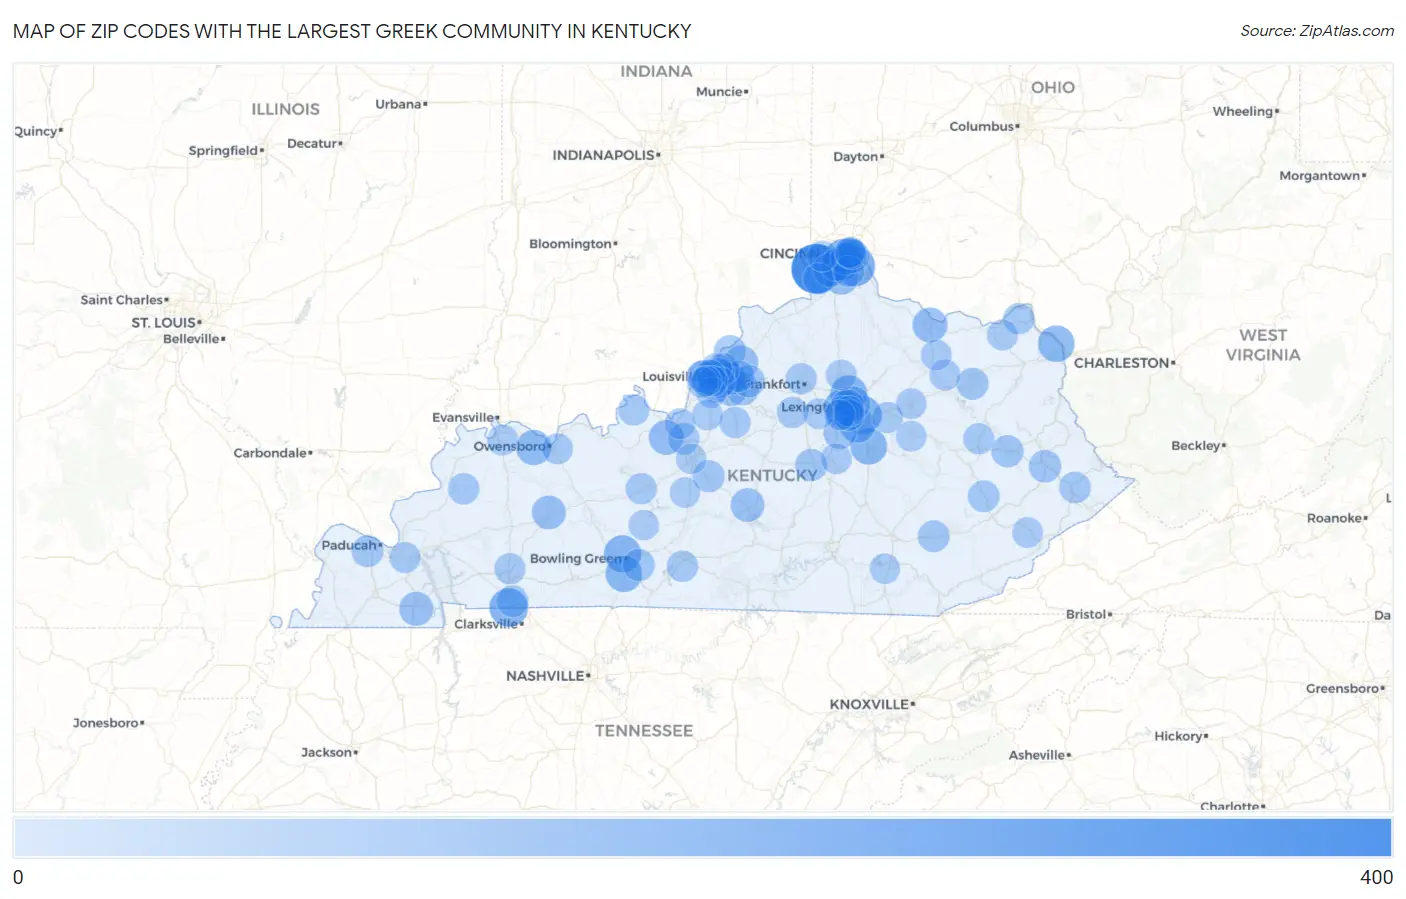
Map of Zip Codes with the Largest Greek Community in Kentucky
0
400
Zip Codes with the Largest Greek Community in Kentucky
| Zip Code | Greek | vs State | vs National | |
| 1. | 41005 | 374 | 5,714(6.55%)#1 | 1,230,319(0.03%)#536 |
| 2. | 41076 | 194 | 5,714(3.40%)#2 | 1,230,319(0.02%)#1,782 |
| 3. | 41011 | 186 | 5,714(3.26%)#3 | 1,230,319(0.02%)#1,902 |
| 4. | 42223 | 166 | 5,714(2.91%)#4 | 1,230,319(0.01%)#2,219 |
| 5. | 40509 | 159 | 5,714(2.78%)#5 | 1,230,319(0.01%)#2,325 |
| 6. | 42101 | 135 | 5,714(2.36%)#6 | 1,230,319(0.01%)#2,799 |
| 7. | 40511 | 132 | 5,714(2.31%)#7 | 1,230,319(0.01%)#2,869 |
| 8. | 40504 | 131 | 5,714(2.29%)#8 | 1,230,319(0.01%)#2,894 |
| 9. | 40475 | 129 | 5,714(2.26%)#9 | 1,230,319(0.01%)#2,925 |
| 10. | 42104 | 126 | 5,714(2.21%)#10 | 1,230,319(0.01%)#3,000 |
| 11. | 41101 | 126 | 5,714(2.21%)#11 | 1,230,319(0.01%)#3,011 |
| 12. | 41017 | 114 | 5,714(2.00%)#12 | 1,230,319(0.01%)#3,345 |
| 13. | 40515 | 109 | 5,714(1.91%)#13 | 1,230,319(0.01%)#3,502 |
| 14. | 41071 | 109 | 5,714(1.91%)#14 | 1,230,319(0.01%)#3,511 |
| 15. | 42301 | 102 | 5,714(1.79%)#15 | 1,230,319(0.01%)#3,729 |
| 16. | 40505 | 101 | 5,714(1.77%)#16 | 1,230,319(0.01%)#3,776 |
| 17. | 41056 | 93 | 5,714(1.63%)#17 | 1,230,319(0.01%)#4,053 |
| 18. | 40175 | 92 | 5,714(1.61%)#18 | 1,230,319(0.01%)#4,088 |
| 19. | 41051 | 86 | 5,714(1.51%)#19 | 1,230,319(0.01%)#4,286 |
| 20. | 41042 | 79 | 5,714(1.38%)#20 | 1,230,319(0.01%)#4,560 |
| 21. | 42071 | 79 | 5,714(1.38%)#21 | 1,230,319(0.01%)#4,570 |
| 22. | 40014 | 77 | 5,714(1.35%)#22 | 1,230,319(0.01%)#4,669 |
| 23. | 42330 | 76 | 5,714(1.33%)#23 | 1,230,319(0.01%)#4,728 |
| 24. | 42718 | 73 | 5,714(1.28%)#24 | 1,230,319(0.01%)#4,836 |
| 25. | 40508 | 72 | 5,714(1.26%)#25 | 1,230,319(0.01%)#4,874 |
| 26. | 41075 | 69 | 5,714(1.21%)#26 | 1,230,319(0.01%)#5,057 |
| 27. | 40223 | 65 | 5,714(1.14%)#27 | 1,230,319(0.01%)#5,258 |
| 28. | 40503 | 63 | 5,714(1.10%)#28 | 1,230,319(0.01%)#5,358 |
| 29. | 40356 | 62 | 5,714(1.09%)#29 | 1,230,319(0.01%)#5,405 |
| 30. | 40023 | 61 | 5,714(1.07%)#30 | 1,230,319(0.00%)#5,505 |
| 31. | 40218 | 59 | 5,714(1.03%)#31 | 1,230,319(0.00%)#5,589 |
| 32. | 40207 | 50 | 5,714(0.88%)#32 | 1,230,319(0.00%)#6,133 |
| 33. | 41653 | 50 | 5,714(0.88%)#33 | 1,230,319(0.00%)#6,169 |
| 34. | 40299 | 49 | 5,714(0.86%)#34 | 1,230,319(0.00%)#6,203 |
| 35. | 40243 | 48 | 5,714(0.84%)#35 | 1,230,319(0.00%)#6,300 |
| 36. | 41465 | 47 | 5,714(0.82%)#36 | 1,230,319(0.00%)#6,378 |
| 37. | 40067 | 47 | 5,714(0.82%)#37 | 1,230,319(0.00%)#6,396 |
| 38. | 41018 | 46 | 5,714(0.81%)#38 | 1,230,319(0.00%)#6,431 |
| 39. | 40422 | 46 | 5,714(0.81%)#39 | 1,230,319(0.00%)#6,436 |
| 40. | 42103 | 46 | 5,714(0.81%)#40 | 1,230,319(0.00%)#6,443 |
| 41. | 41014 | 46 | 5,714(0.81%)#41 | 1,230,319(0.00%)#6,468 |
| 42. | 40202 | 44 | 5,714(0.77%)#42 | 1,230,319(0.00%)#6,610 |
| 43. | 40026 | 44 | 5,714(0.77%)#43 | 1,230,319(0.00%)#6,614 |
| 44. | 42748 | 43 | 5,714(0.75%)#44 | 1,230,319(0.00%)#6,673 |
| 45. | 40351 | 42 | 5,714(0.74%)#45 | 1,230,319(0.00%)#6,720 |
| 46. | 40204 | 39 | 5,714(0.68%)#46 | 1,230,319(0.00%)#6,952 |
| 47. | 42001 | 38 | 5,714(0.67%)#47 | 1,230,319(0.00%)#7,011 |
| 48. | 40962 | 38 | 5,714(0.67%)#48 | 1,230,319(0.00%)#7,028 |
| 49. | 42262 | 37 | 5,714(0.65%)#49 | 1,230,319(0.00%)#7,123 |
| 50. | 41348 | 36 | 5,714(0.63%)#50 | 1,230,319(0.00%)#7,241 |
| 51. | 40245 | 35 | 5,714(0.61%)#51 | 1,230,319(0.00%)#7,252 |
| 52. | 41501 | 35 | 5,714(0.61%)#52 | 1,230,319(0.00%)#7,270 |
| 53. | 40241 | 34 | 5,714(0.60%)#53 | 1,230,319(0.00%)#7,331 |
| 54. | 40222 | 34 | 5,714(0.60%)#54 | 1,230,319(0.00%)#7,349 |
| 55. | 40160 | 33 | 5,714(0.58%)#55 | 1,230,319(0.00%)#7,425 |
| 56. | 40517 | 32 | 5,714(0.56%)#56 | 1,230,319(0.00%)#7,490 |
| 57. | 42463 | 31 | 5,714(0.54%)#57 | 1,230,319(0.00%)#7,686 |
| 58. | 42141 | 30 | 5,714(0.53%)#58 | 1,230,319(0.00%)#7,710 |
| 59. | 41091 | 30 | 5,714(0.53%)#59 | 1,230,319(0.00%)#7,718 |
| 60. | 40342 | 30 | 5,714(0.53%)#60 | 1,230,319(0.00%)#7,720 |
| 61. | 42754 | 29 | 5,714(0.51%)#61 | 1,230,319(0.00%)#7,817 |
| 62. | 40013 | 29 | 5,714(0.51%)#62 | 1,230,319(0.00%)#7,846 |
| 63. | 40601 | 27 | 5,714(0.47%)#63 | 1,230,319(0.00%)#7,987 |
| 64. | 41015 | 27 | 5,714(0.47%)#64 | 1,230,319(0.00%)#8,020 |
| 65. | 41175 | 27 | 5,714(0.47%)#65 | 1,230,319(0.00%)#8,071 |
| 66. | 40203 | 26 | 5,714(0.46%)#66 | 1,230,319(0.00%)#8,139 |
| 67. | 41074 | 26 | 5,714(0.46%)#67 | 1,230,319(0.00%)#8,186 |
| 68. | 42240 | 25 | 5,714(0.44%)#68 | 1,230,319(0.00%)#8,229 |
| 69. | 42303 | 24 | 5,714(0.42%)#69 | 1,230,319(0.00%)#8,339 |
| 70. | 41352 | 24 | 5,714(0.42%)#70 | 1,230,319(0.00%)#8,465 |
| 71. | 40391 | 23 | 5,714(0.40%)#71 | 1,230,319(0.00%)#8,473 |
| 72. | 42029 | 23 | 5,714(0.40%)#72 | 1,230,319(0.00%)#8,559 |
| 73. | 40157 | 23 | 5,714(0.40%)#73 | 1,230,319(0.00%)#8,593 |
| 74. | 40025 | 23 | 5,714(0.40%)#74 | 1,230,319(0.00%)#8,597 |
| 75. | 42420 | 22 | 5,714(0.39%)#75 | 1,230,319(0.00%)#8,612 |
| 76. | 40502 | 22 | 5,714(0.39%)#76 | 1,230,319(0.00%)#8,622 |
| 77. | 41048 | 22 | 5,714(0.39%)#77 | 1,230,319(0.00%)#8,642 |
| 78. | 41141 | 22 | 5,714(0.39%)#78 | 1,230,319(0.00%)#8,702 |
| 79. | 41049 | 21 | 5,714(0.37%)#79 | 1,230,319(0.00%)#8,839 |
| 80. | 40324 | 20 | 5,714(0.35%)#80 | 1,230,319(0.00%)#8,862 |
| 81. | 40514 | 20 | 5,714(0.35%)#81 | 1,230,319(0.00%)#8,906 |
| 82. | 40220 | 18 | 5,714(0.32%)#82 | 1,230,319(0.00%)#9,197 |
| 83. | 40353 | 18 | 5,714(0.32%)#83 | 1,230,319(0.00%)#9,207 |
| 84. | 40206 | 18 | 5,714(0.32%)#84 | 1,230,319(0.00%)#9,211 |
| 85. | 40444 | 18 | 5,714(0.32%)#85 | 1,230,319(0.00%)#9,233 |
| 86. | 40121 | 18 | 5,714(0.32%)#86 | 1,230,319(0.00%)#9,260 |
| 87. | 41041 | 18 | 5,714(0.32%)#87 | 1,230,319(0.00%)#9,267 |
| 88. | 41826 | 18 | 5,714(0.32%)#88 | 1,230,319(0.00%)#9,333 |
| 89. | 40219 | 17 | 5,714(0.30%)#89 | 1,230,319(0.00%)#9,347 |
| 90. | 40165 | 17 | 5,714(0.30%)#90 | 1,230,319(0.00%)#9,348 |
| 91. | 41073 | 17 | 5,714(0.30%)#91 | 1,230,319(0.00%)#9,435 |
| 92. | 40205 | 16 | 5,714(0.28%)#92 | 1,230,319(0.00%)#9,534 |
| 93. | 40208 | 16 | 5,714(0.28%)#93 | 1,230,319(0.00%)#9,553 |
| 94. | 40312 | 16 | 5,714(0.28%)#94 | 1,230,319(0.00%)#9,594 |
| 95. | 40217 | 15 | 5,714(0.26%)#95 | 1,230,319(0.00%)#9,723 |
| 96. | 42784 | 15 | 5,714(0.26%)#96 | 1,230,319(0.00%)#9,808 |
| 97. | 40383 | 14 | 5,714(0.25%)#97 | 1,230,319(0.00%)#9,870 |
| 98. | 40701 | 13 | 5,714(0.23%)#98 | 1,230,319(0.00%)#10,049 |
| 99. | 42210 | 13 | 5,714(0.23%)#99 | 1,230,319(0.00%)#10,146 |
| 100. | 42701 | 12 | 5,714(0.21%)#100 | 1,230,319(0.00%)#10,211 |
Common Questions
What are the Top 10 Zip Codes with the Largest Greek Community in Kentucky?
Top 10 Zip Codes with the Largest Greek Community in Kentucky are:
What zip code has the Largest Greek Community in Kentucky?
41005 has the Largest Greek Community in Kentucky with 374.
What is the Total Greek Population in the State of Kentucky?
Total Greek Population in Kentucky is 5,714.
What is the Total Greek Population in the United States?
Total Greek Population in the United States is 1,230,319.