Zip Codes with the Highest Percentage of Population with a Degree in Visual and Performing Arts in Kentucky
RELATED REPORTS & OPTIONS
Visual and Performing Arts
Kentucky
Compare Zip Codes
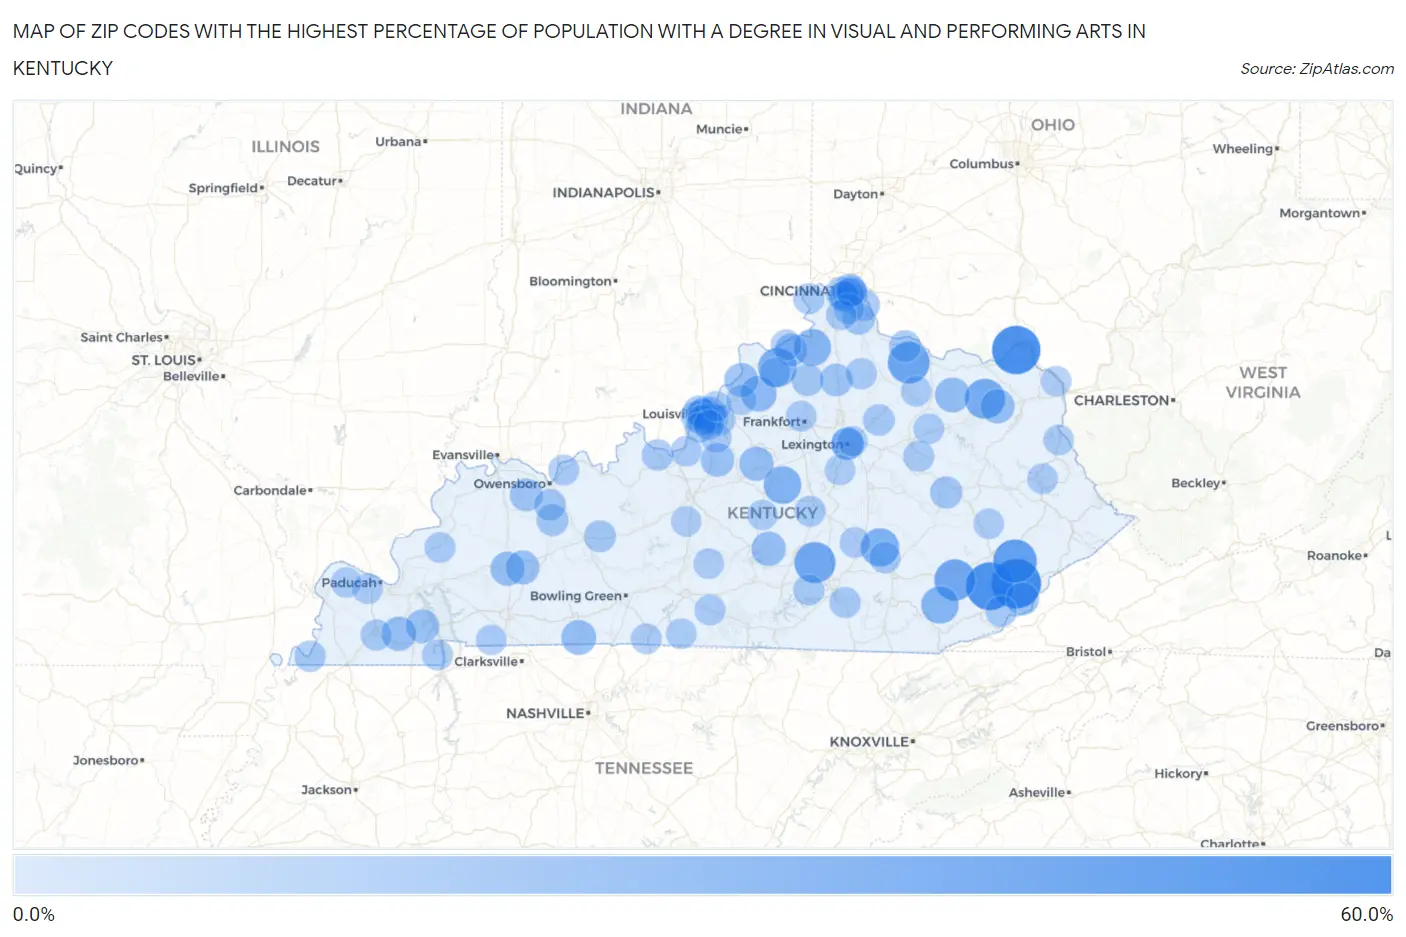
Map of Zip Codes with the Highest Percentage of Population with a Degree in Visual and Performing Arts in Kentucky
0.0%
60.0%
Zip Codes with the Highest Percentage of Population with a Degree in Visual and Performing Arts in Kentucky
| Zip Code | % Graduates | vs State | vs National | |
| 1. | 41821 | 54.5% | 3.2%(+51.3)#1 | 4.3%(+50.3)#59 |
| 2. | 41174 | 51.4% | 3.2%(+48.2)#2 | 4.3%(+47.2)#65 |
| 3. | 41777 | 50.0% | 3.2%(+46.8)#3 | 4.3%(+45.7)#68 |
| 4. | 41759 | 38.9% | 3.2%(+35.7)#4 | 4.3%(+34.7)#123 |
| 5. | 41044 | 34.3% | 3.2%(+31.1)#5 | 4.3%(+30.0)#159 |
| 6. | 40914 | 32.5% | 3.2%(+29.3)#6 | 4.3%(+28.2)#191 |
| 7. | 42516 | 32.3% | 3.2%(+29.0)#7 | 4.3%(+28.0)#193 |
| 8. | 41135 | 29.7% | 3.2%(+26.5)#8 | 4.3%(+25.5)#224 |
| 9. | 40075 | 26.7% | 3.2%(+23.4)#9 | 4.3%(+22.4)#275 |
| 10. | 40445 | 25.4% | 3.2%(+22.1)#10 | 4.3%(+21.1)#306 |
| 11. | 40040 | 23.1% | 3.2%(+19.8)#11 | 4.3%(+18.8)#353 |
| 12. | 40982 | 22.7% | 3.2%(+19.5)#12 | 4.3%(+18.5)#371 |
| 13. | 41046 | 21.6% | 3.2%(+18.4)#13 | 4.3%(+17.4)#408 |
| 14. | 40068 | 18.4% | 3.2%(+15.1)#14 | 4.3%(+14.1)#551 |
| 15. | 41093 | 16.0% | 3.2%(+12.8)#15 | 4.3%(+11.7)#710 |
| 16. | 42202 | 15.9% | 3.2%(+12.7)#16 | 4.3%(+11.6)#725 |
| 17. | 42733 | 14.6% | 3.2%(+11.4)#17 | 4.3%(+10.4)#858 |
| 18. | 42054 | 14.6% | 3.2%(+11.4)#18 | 4.3%(+10.4)#864 |
| 19. | 41164 | 14.4% | 3.2%(+11.2)#19 | 4.3%(+10.2)#888 |
| 20. | 40008 | 14.4% | 3.2%(+11.2)#20 | 4.3%(+10.1)#894 |
| 21. | 42442 | 14.0% | 3.2%(+10.8)#21 | 4.3%(+9.75)#956 |
| 22. | 42464 | 13.7% | 3.2%(+10.5)#22 | 4.3%(+9.46)#990 |
| 23. | 40077 | 13.6% | 3.2%(+10.4)#23 | 4.3%(+9.38)#1,005 |
| 24. | 42048 | 12.9% | 3.2%(+9.72)#24 | 4.3%(+8.70)#1,112 |
| 25. | 40110 | 12.5% | 3.2%(+9.27)#25 | 4.3%(+8.25)#1,192 |
| 26. | 40202 | 11.9% | 3.2%(+8.72)#26 | 4.3%(+7.70)#1,297 |
| 27. | 40807 | 11.3% | 3.2%(+8.02)#27 | 4.3%(+7.00)#1,456 |
| 28. | 42356 | 10.8% | 3.2%(+7.59)#28 | 4.3%(+6.57)#1,578 |
| 29. | 41010 | 10.6% | 3.2%(+7.40)#29 | 4.3%(+6.37)#1,647 |
| 30. | 41083 | 10.3% | 3.2%(+7.12)#30 | 4.3%(+6.09)#1,725 |
| 31. | 41073 | 10.0% | 3.2%(+6.76)#31 | 4.3%(+5.74)#1,847 |
| 32. | 40507 | 9.8% | 3.2%(+6.60)#32 | 4.3%(+5.58)#1,898 |
| 33. | 41365 | 9.5% | 3.2%(+6.25)#33 | 4.3%(+5.22)#2,034 |
| 34. | 40508 | 9.4% | 3.2%(+6.20)#34 | 4.3%(+5.18)#2,051 |
| 35. | 41014 | 9.3% | 3.2%(+6.09)#35 | 4.3%(+5.07)#2,099 |
| 36. | 41059 | 9.0% | 3.2%(+5.80)#36 | 4.3%(+4.78)#2,247 |
| 37. | 40359 | 8.9% | 3.2%(+5.71)#37 | 4.3%(+4.68)#2,285 |
| 38. | 42352 | 8.6% | 3.2%(+5.42)#38 | 4.3%(+4.40)#2,446 |
| 39. | 42349 | 8.6% | 3.2%(+5.37)#39 | 4.3%(+4.35)#2,470 |
| 40. | 41001 | 8.5% | 3.2%(+5.32)#40 | 4.3%(+4.29)#2,496 |
| 41. | 41002 | 8.2% | 3.2%(+4.96)#41 | 4.3%(+3.94)#2,721 |
| 42. | 42376 | 8.0% | 3.2%(+4.75)#42 | 4.3%(+3.73)#2,864 |
| 43. | 40206 | 7.9% | 3.2%(+4.65)#43 | 4.3%(+3.63)#2,936 |
| 44. | 40204 | 7.7% | 3.2%(+4.44)#44 | 4.3%(+3.42)#3,093 |
| 45. | 41016 | 7.4% | 3.2%(+4.19)#45 | 4.3%(+3.17)#3,280 |
| 46. | 40361 | 7.3% | 3.2%(+4.12)#46 | 4.3%(+3.10)#3,335 |
| 47. | 40108 | 7.3% | 3.2%(+4.07)#47 | 4.3%(+3.05)#3,372 |
| 48. | 40729 | 7.3% | 3.2%(+4.03)#48 | 4.3%(+3.00)#3,423 |
| 49. | 40828 | 7.2% | 3.2%(+4.02)#49 | 4.3%(+2.99)#3,433 |
| 50. | 42050 | 6.9% | 3.2%(+3.72)#50 | 4.3%(+2.70)#3,710 |
| 51. | 42066 | 6.9% | 3.2%(+3.67)#51 | 4.3%(+2.65)#3,756 |
| 52. | 41003 | 6.8% | 3.2%(+3.54)#52 | 4.3%(+2.51)#3,912 |
| 53. | 41075 | 6.6% | 3.2%(+3.39)#53 | 4.3%(+2.37)#4,098 |
| 54. | 40205 | 6.6% | 3.2%(+3.33)#54 | 4.3%(+2.31)#4,165 |
| 55. | 42519 | 6.5% | 3.2%(+3.24)#55 | 4.3%(+2.22)#4,268 |
| 56. | 40337 | 6.5% | 3.2%(+3.23)#56 | 4.3%(+2.21)#4,277 |
| 57. | 40440 | 6.4% | 3.2%(+3.21)#57 | 4.3%(+2.19)#4,296 |
| 58. | 40212 | 6.3% | 3.2%(+3.04)#58 | 4.3%(+2.02)#4,509 |
| 59. | 42544 | 6.2% | 3.2%(+3.01)#59 | 4.3%(+1.99)#4,549 |
| 60. | 41080 | 6.2% | 3.2%(+2.93)#60 | 4.3%(+1.90)#4,668 |
| 61. | 40211 | 6.0% | 3.2%(+2.82)#61 | 4.3%(+1.79)#4,810 |
| 62. | 41071 | 6.0% | 3.2%(+2.78)#62 | 4.3%(+1.76)#4,865 |
| 63. | 41011 | 6.0% | 3.2%(+2.73)#63 | 4.3%(+1.70)#4,931 |
| 64. | 41015 | 5.9% | 3.2%(+2.64)#64 | 4.3%(+1.62)#5,059 |
| 65. | 40217 | 5.9% | 3.2%(+2.64)#65 | 4.3%(+1.62)#5,071 |
| 66. | 40220 | 5.8% | 3.2%(+2.58)#66 | 4.3%(+1.56)#5,159 |
| 67. | 41045 | 5.8% | 3.2%(+2.57)#67 | 4.3%(+1.54)#5,173 |
| 68. | 42064 | 5.8% | 3.2%(+2.55)#68 | 4.3%(+1.52)#5,200 |
| 69. | 42166 | 5.8% | 3.2%(+2.53)#69 | 4.3%(+1.51)#5,231 |
| 70. | 40601 | 5.7% | 3.2%(+2.45)#70 | 4.3%(+1.42)#5,370 |
| 71. | 42355 | 5.6% | 3.2%(+2.41)#71 | 4.3%(+1.39)#5,425 |
| 72. | 41074 | 5.6% | 3.2%(+2.35)#72 | 4.3%(+1.33)#5,535 |
| 73. | 40203 | 5.6% | 3.2%(+2.33)#73 | 4.3%(+1.31)#5,552 |
| 74. | 42076 | 5.6% | 3.2%(+2.33)#74 | 4.3%(+1.30)#5,580 |
| 75. | 40409 | 5.5% | 3.2%(+2.30)#75 | 4.3%(+1.27)#5,631 |
| 76. | 42120 | 5.5% | 3.2%(+2.24)#76 | 4.3%(+1.21)#5,743 |
| 77. | 40229 | 5.4% | 3.2%(+2.15)#77 | 4.3%(+1.12)#5,899 |
| 78. | 40208 | 5.3% | 3.2%(+2.05)#78 | 4.3%(+1.03)#6,094 |
| 79. | 40214 | 5.3% | 3.2%(+2.04)#79 | 4.3%(+1.02)#6,107 |
| 80. | 42001 | 5.2% | 3.2%(+2.01)#80 | 4.3%(+0.991)#6,162 |
| 81. | 40177 | 5.2% | 3.2%(+2.01)#81 | 4.3%(+0.988)#6,167 |
| 82. | 40360 | 5.2% | 3.2%(+2.00)#82 | 4.3%(+0.974)#6,195 |
| 83. | 41039 | 5.2% | 3.2%(+1.97)#83 | 4.3%(+0.943)#6,246 |
| 84. | 41240 | 5.2% | 3.2%(+1.96)#84 | 4.3%(+0.938)#6,259 |
| 85. | 42133 | 5.1% | 3.2%(+1.86)#85 | 4.3%(+0.833)#6,447 |
| 86. | 41230 | 5.0% | 3.2%(+1.78)#86 | 4.3%(+0.761)#6,595 |
| 87. | 42254 | 5.0% | 3.2%(+1.77)#87 | 4.3%(+0.748)#6,652 |
| 88. | 41339 | 4.9% | 3.2%(+1.71)#88 | 4.3%(+0.684)#6,792 |
| 89. | 42746 | 4.9% | 3.2%(+1.70)#89 | 4.3%(+0.677)#6,809 |
| 90. | 42053 | 4.9% | 3.2%(+1.67)#90 | 4.3%(+0.642)#6,872 |
| 91. | 40025 | 4.9% | 3.2%(+1.64)#91 | 4.3%(+0.620)#6,920 |
| 92. | 40213 | 4.9% | 3.2%(+1.63)#92 | 4.3%(+0.610)#6,943 |
| 93. | 40505 | 4.7% | 3.2%(+1.52)#93 | 4.3%(+0.492)#7,205 |
| 94. | 40356 | 4.7% | 3.2%(+1.47)#94 | 4.3%(+0.450)#7,298 |
| 95. | 41101 | 4.7% | 3.2%(+1.46)#95 | 4.3%(+0.439)#7,320 |
| 96. | 40033 | 4.6% | 3.2%(+1.38)#96 | 4.3%(+0.354)#7,539 |
| 97. | 41051 | 4.6% | 3.2%(+1.36)#97 | 4.3%(+0.341)#7,569 |
| 98. | 40011 | 4.5% | 3.2%(+1.32)#98 | 4.3%(+0.293)#7,677 |
| 99. | 42776 | 4.5% | 3.2%(+1.32)#99 | 4.3%(+0.293)#7,680 |
| 100. | 40014 | 4.4% | 3.2%(+1.20)#100 | 4.3%(+0.180)#8,008 |
Common Questions
What are the Top 10 Zip Codes with the Highest Percentage of Population with a Degree in Visual and Performing Arts in Kentucky?
Top 10 Zip Codes with the Highest Percentage of Population with a Degree in Visual and Performing Arts in Kentucky are:
What zip code has the Highest Percentage of Population with a Degree in Visual and Performing Arts in Kentucky?
41821 has the Highest Percentage of Population with a Degree in Visual and Performing Arts in Kentucky with 54.5%.
What is the Percentage of Population with a Degree in Visual and Performing Arts in the State of Kentucky?
Percentage of Population with a Degree in Visual and Performing Arts in Kentucky is 3.2%.
What is the Percentage of Population with a Degree in Visual and Performing Arts in the United States?
Percentage of Population with a Degree in Visual and Performing Arts in the United States is 4.3%.