Zip Codes with the Youngest Male Population in Kentucky
RELATED REPORTS & OPTIONS
Youngest Population | Male
Kentucky
Compare Zip Codes
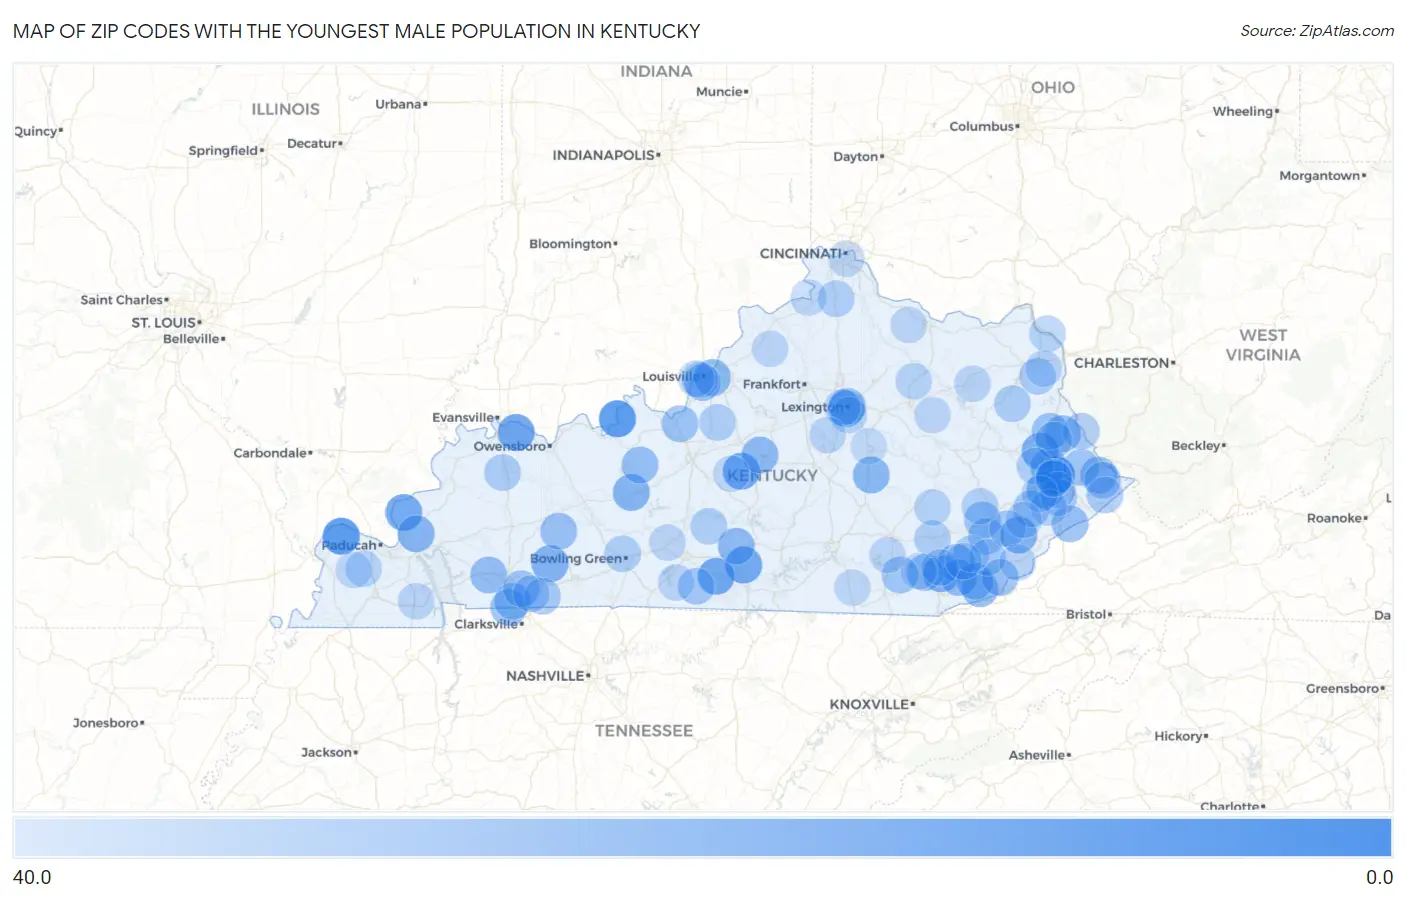
Map of Zip Codes with the Youngest Male Population in Kentucky
40.0
0.0
Zip Codes with the Youngest Male Population in Kentucky
| Zip Code | Median Age | vs State | vs National | |
| 1. | 41663 | 8.4 | 37.8(-29.4)#1 | 37.4(-29.0)#33 |
| 2. | 40170 | 9.1 | 37.8(-28.7)#2 | 37.4(-28.3)#42 |
| 3. | 42022 | 9.9 | 37.8(-27.9)#3 | 37.4(-27.5)#53 |
| 4. | 42451 | 13.7 | 37.8(-24.1)#4 | 37.4(-23.7)#104 |
| 5. | 40062 | 13.8 | 37.8(-24.0)#5 | 37.4(-23.6)#110 |
| 6. | 42715 | 14.5 | 37.8(-23.3)#6 | 37.4(-22.9)#128 |
| 7. | 42124 | 14.5 | 37.8(-23.3)#7 | 37.4(-22.9)#130 |
| 8. | 42047 | 14.7 | 37.8(-23.1)#8 | 37.4(-22.7)#136 |
| 9. | 41216 | 16.9 | 37.8(-20.9)#9 | 37.4(-20.5)#195 |
| 10. | 40997 | 17.3 | 37.8(-20.5)#10 | 37.4(-20.1)#212 |
| 11. | 41804 | 17.6 | 37.8(-20.2)#11 | 37.4(-19.8)#220 |
| 12. | 42280 | 17.9 | 37.8(-19.9)#12 | 37.4(-19.5)#237 |
| 13. | 42762 | 18.5 | 37.8(-19.3)#13 | 37.4(-18.9)#261 |
| 14. | 42083 | 19.0 | 37.8(-18.8)#14 | 37.4(-18.4)#306 |
| 15. | 40526 | 19.2 | 37.8(-18.6)#15 | 37.4(-18.2)#330 |
| 16. | 40404 | 19.6 | 37.8(-18.2)#16 | 37.4(-17.8)#436 |
| 17. | 41651 | 19.6 | 37.8(-18.2)#17 | 37.4(-17.8)#440 |
| 18. | 40280 | 20.1 | 37.8(-17.7)#18 | 37.4(-17.3)#554 |
| 19. | 41621 | 20.5 | 37.8(-17.3)#19 | 37.4(-16.9)#614 |
| 20. | 40061 | 20.6 | 37.8(-17.2)#20 | 37.4(-16.8)#628 |
| 21. | 42742 | 20.6 | 37.8(-17.2)#21 | 37.4(-16.8)#633 |
| 22. | 40830 | 20.9 | 37.8(-16.9)#22 | 37.4(-16.5)#679 |
| 23. | 40913 | 21.0 | 37.8(-16.8)#23 | 37.4(-16.4)#694 |
| 24. | 41262 | 21.6 | 37.8(-16.2)#24 | 37.4(-15.8)#783 |
| 25. | 42232 | 21.7 | 37.8(-16.1)#25 | 37.4(-15.7)#808 |
| 26. | 40988 | 21.7 | 37.8(-16.1)#26 | 37.4(-15.7)#812 |
| 27. | 40824 | 22.0 | 37.8(-15.8)#27 | 37.4(-15.4)#868 |
| 28. | 40915 | 22.2 | 37.8(-15.6)#28 | 37.4(-15.2)#896 |
| 29. | 40145 | 22.2 | 37.8(-15.6)#29 | 37.4(-15.2)#897 |
| 30. | 42223 | 22.3 | 37.8(-15.5)#30 | 37.4(-15.1)#902 |
| 31. | 40208 | 22.4 | 37.8(-15.4)#31 | 37.4(-15.0)#915 |
| 32. | 41563 | 22.4 | 37.8(-15.4)#32 | 37.4(-15.0)#921 |
| 33. | 42323 | 22.7 | 37.8(-15.1)#33 | 37.4(-14.7)#957 |
| 34. | 40847 | 22.7 | 37.8(-15.1)#34 | 37.4(-14.7)#965 |
| 35. | 41567 | 22.7 | 37.8(-15.1)#35 | 37.4(-14.7)#966 |
| 36. | 41254 | 23.2 | 37.8(-14.6)#36 | 37.4(-14.2)#1,033 |
| 37. | 42262 | 23.4 | 37.8(-14.4)#37 | 37.4(-14.0)#1,055 |
| 38. | 40508 | 23.7 | 37.8(-14.1)#38 | 37.4(-13.7)#1,092 |
| 39. | 40121 | 23.9 | 37.8(-13.9)#39 | 37.4(-13.5)#1,132 |
| 40. | 42266 | 23.9 | 37.8(-13.9)#40 | 37.4(-13.5)#1,137 |
| 41. | 41723 | 24.0 | 37.8(-13.8)#41 | 37.4(-13.4)#1,156 |
| 42. | 42157 | 24.5 | 37.8(-13.3)#42 | 37.4(-12.9)#1,209 |
| 43. | 41571 | 24.6 | 37.8(-13.2)#43 | 37.4(-12.8)#1,230 |
| 44. | 40771 | 24.8 | 37.8(-13.0)#44 | 37.4(-12.6)#1,263 |
| 45. | 41555 | 24.8 | 37.8(-13.0)#45 | 37.4(-12.6)#1,264 |
| 46. | 41844 | 24.9 | 37.8(-12.9)#46 | 37.4(-12.5)#1,278 |
| 47. | 41776 | 25.7 | 37.8(-12.1)#47 | 37.4(-11.7)#1,392 |
| 48. | 40808 | 25.8 | 37.8(-12.0)#48 | 37.4(-11.6)#1,419 |
| 49. | 42234 | 26.2 | 37.8(-11.6)#49 | 37.4(-11.2)#1,476 |
| 50. | 41760 | 26.3 | 37.8(-11.5)#50 | 37.4(-11.1)#1,497 |
| 51. | 41132 | 26.4 | 37.8(-11.4)#51 | 37.4(-11.0)#1,512 |
| 52. | 41660 | 26.4 | 37.8(-11.4)#52 | 37.4(-11.0)#1,515 |
| 53. | 42286 | 26.5 | 37.8(-11.3)#53 | 37.4(-10.9)#1,525 |
| 54. | 41267 | 26.7 | 37.8(-11.1)#54 | 37.4(-10.7)#1,574 |
| 55. | 41524 | 26.7 | 37.8(-11.1)#55 | 37.4(-10.7)#1,581 |
| 56. | 41149 | 26.9 | 37.8(-10.9)#56 | 37.4(-10.5)#1,618 |
| 57. | 42455 | 27.1 | 37.8(-10.7)#57 | 37.4(-10.3)#1,660 |
| 58. | 40858 | 27.5 | 37.8(-10.3)#58 | 37.4(-9.90)#1,766 |
| 59. | 40941 | 27.5 | 37.8(-10.3)#59 | 37.4(-9.90)#1,768 |
| 60. | 42746 | 27.6 | 37.8(-10.2)#60 | 37.4(-9.80)#1,784 |
| 61. | 41631 | 27.6 | 37.8(-10.2)#61 | 37.4(-9.80)#1,791 |
| 62. | 42101 | 27.7 | 37.8(-10.1)#62 | 37.4(-9.70)#1,807 |
| 63. | 41204 | 27.7 | 37.8(-10.1)#63 | 37.4(-9.70)#1,826 |
| 64. | 40110 | 27.7 | 37.8(-10.1)#64 | 37.4(-9.70)#1,829 |
| 65. | 40982 | 27.7 | 37.8(-10.1)#65 | 37.4(-9.70)#1,830 |
| 66. | 41030 | 28.0 | 37.8(-9.80)#66 | 37.4(-9.40)#1,919 |
| 67. | 41607 | 28.1 | 37.8(-9.70)#67 | 37.4(-9.30)#1,948 |
| 68. | 41727 | 28.3 | 37.8(-9.50)#68 | 37.4(-9.10)#1,990 |
| 69. | 41603 | 28.7 | 37.8(-9.10)#69 | 37.4(-8.70)#2,130 |
| 70. | 42069 | 28.7 | 37.8(-9.10)#70 | 37.4(-8.70)#2,132 |
| 71. | 40983 | 28.8 | 37.8(-9.00)#71 | 37.4(-8.60)#2,178 |
| 72. | 41183 | 28.9 | 37.8(-8.90)#72 | 37.4(-8.50)#2,204 |
| 73. | 40374 | 29.0 | 37.8(-8.80)#73 | 37.4(-8.40)#2,247 |
| 74. | 40517 | 29.3 | 37.8(-8.50)#74 | 37.4(-8.10)#2,330 |
| 75. | 41168 | 29.4 | 37.8(-8.40)#75 | 37.4(-8.00)#2,386 |
| 76. | 41606 | 29.4 | 37.8(-8.40)#76 | 37.4(-8.00)#2,403 |
| 77. | 40504 | 29.5 | 37.8(-8.30)#77 | 37.4(-7.90)#2,415 |
| 78. | 41666 | 29.5 | 37.8(-8.30)#78 | 37.4(-7.90)#2,437 |
| 79. | 42123 | 29.7 | 37.8(-8.10)#79 | 37.4(-7.70)#2,536 |
| 80. | 40351 | 29.8 | 37.8(-8.00)#80 | 37.4(-7.60)#2,557 |
| 81. | 40390 | 29.8 | 37.8(-8.00)#81 | 37.4(-7.60)#2,569 |
| 82. | 40210 | 29.9 | 37.8(-7.90)#82 | 37.4(-7.50)#2,612 |
| 83. | 40823 | 29.9 | 37.8(-7.90)#83 | 37.4(-7.50)#2,618 |
| 84. | 42020 | 29.9 | 37.8(-7.90)#84 | 37.4(-7.50)#2,624 |
| 85. | 40211 | 30.1 | 37.8(-7.70)#85 | 37.4(-7.30)#2,714 |
| 86. | 40050 | 30.2 | 37.8(-7.60)#86 | 37.4(-7.20)#2,791 |
| 87. | 40346 | 30.3 | 37.8(-7.50)#87 | 37.4(-7.10)#2,846 |
| 88. | 41834 | 30.3 | 37.8(-7.50)#88 | 37.4(-7.10)#2,854 |
| 89. | 42160 | 30.5 | 37.8(-7.30)#89 | 37.4(-6.90)#2,941 |
| 90. | 40737 | 30.5 | 37.8(-7.30)#90 | 37.4(-6.90)#2,945 |
| 91. | 41044 | 30.5 | 37.8(-7.30)#91 | 37.4(-6.90)#2,946 |
| 92. | 40874 | 30.5 | 37.8(-7.30)#92 | 37.4(-6.90)#2,962 |
| 93. | 42035 | 30.6 | 37.8(-7.20)#93 | 37.4(-6.80)#3,016 |
| 94. | 40949 | 30.7 | 37.8(-7.10)#94 | 37.4(-6.70)#3,060 |
| 95. | 41095 | 30.9 | 37.8(-6.90)#95 | 37.4(-6.50)#3,170 |
| 96. | 42653 | 31.1 | 37.8(-6.70)#96 | 37.4(-6.30)#3,294 |
| 97. | 40052 | 31.2 | 37.8(-6.60)#97 | 37.4(-6.20)#3,365 |
| 98. | 41014 | 31.4 | 37.8(-6.40)#98 | 37.4(-6.00)#3,468 |
| 99. | 41615 | 31.4 | 37.8(-6.40)#99 | 37.4(-6.00)#3,489 |
| 100. | 40475 | 31.7 | 37.8(-6.10)#100 | 37.4(-5.70)#3,627 |
Common Questions
What are the Top 10 Zip Codes with the Youngest Male Population in Kentucky?
Top 10 Zip Codes with the Youngest Male Population in Kentucky are:
What zip code has the Youngest Male Population in Kentucky?
41663 has the Youngest Male Population in Kentucky with 8.4.
What is the Median Male Age in the State of Kentucky?
Median Male Age in Kentucky is 37.8.
What is the Median Male Age in the United States?
Median Male Age in the United States is 37.4.