Zip Codes with the Highest Percentage of Population Employed in Firefighting & Prevention in Kentucky
RELATED REPORTS & OPTIONS
Firefighting & Prevention
Kentucky
Compare Zip Codes
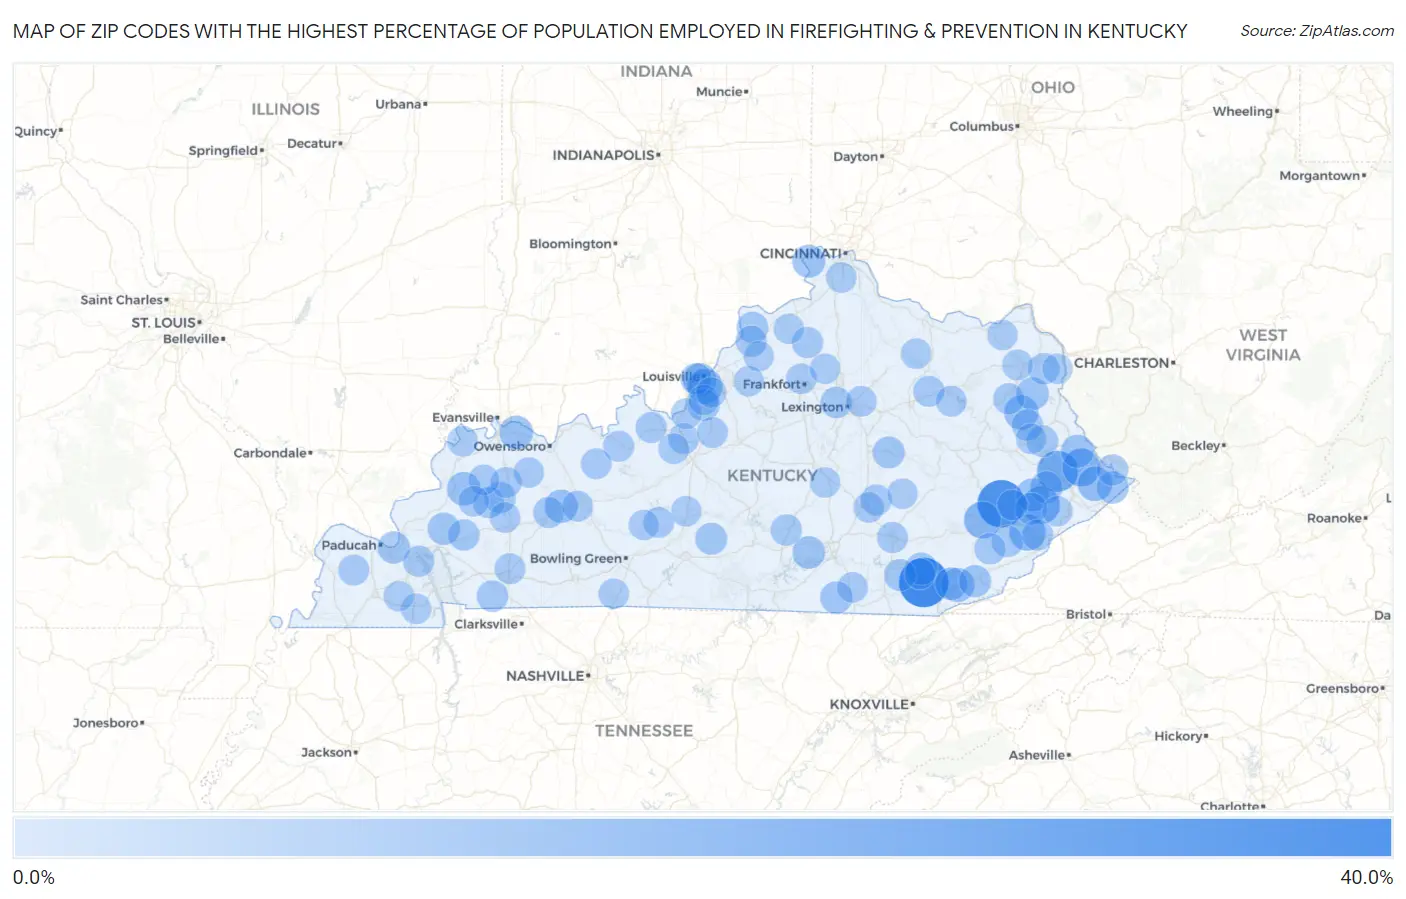
Map of Zip Codes with the Highest Percentage of Population Employed in Firefighting & Prevention in Kentucky
0.0%
40.0%
Zip Codes with the Highest Percentage of Population Employed in Firefighting & Prevention in Kentucky
| Zip Code | % Employed | vs State | vs National | |
| 1. | 40903 | 33.5% | 1.1%(+32.4)#1 | 1.2%(+32.3)#38 |
| 2. | 41712 | 29.9% | 1.1%(+28.8)#2 | 1.2%(+28.8)#44 |
| 3. | 41642 | 19.2% | 1.1%(+18.0)#3 | 1.2%(+18.0)#104 |
| 4. | 41571 | 14.1% | 1.1%(+13.0)#4 | 1.2%(+13.0)#174 |
| 5. | 41862 | 13.4% | 1.1%(+12.3)#5 | 1.2%(+12.2)#192 |
| 6. | 41723 | 12.6% | 1.1%(+11.5)#6 | 1.2%(+11.5)#206 |
| 7. | 41826 | 11.6% | 1.1%(+10.4)#7 | 1.2%(+10.4)#245 |
| 8. | 40209 | 9.6% | 1.1%(+8.44)#8 | 1.2%(+8.39)#322 |
| 9. | 41539 | 8.9% | 1.1%(+7.72)#9 | 1.2%(+7.67)#349 |
| 10. | 41159 | 8.1% | 1.1%(+7.00)#10 | 1.2%(+6.95)#398 |
| 11. | 40845 | 7.8% | 1.1%(+6.68)#11 | 1.2%(+6.63)#429 |
| 12. | 42463 | 7.3% | 1.1%(+6.14)#12 | 1.2%(+6.09)#479 |
| 13. | 42451 | 7.1% | 1.1%(+6.01)#13 | 1.2%(+5.96)#497 |
| 14. | 40210 | 6.9% | 1.1%(+5.72)#14 | 1.2%(+5.67)#534 |
| 15. | 42369 | 6.7% | 1.1%(+5.53)#15 | 1.2%(+5.48)#565 |
| 16. | 41839 | 6.5% | 1.1%(+5.41)#16 | 1.2%(+5.36)#586 |
| 17. | 41250 | 6.2% | 1.1%(+5.04)#17 | 1.2%(+4.99)#647 |
| 18. | 41080 | 6.1% | 1.1%(+5.01)#18 | 1.2%(+4.96)#655 |
| 19. | 41180 | 5.7% | 1.1%(+4.58)#19 | 1.2%(+4.53)#725 |
| 20. | 40958 | 5.5% | 1.1%(+4.40)#20 | 1.2%(+4.35)#761 |
| 21. | 42544 | 5.4% | 1.1%(+4.31)#21 | 1.2%(+4.26)#778 |
| 22. | 41619 | 5.4% | 1.1%(+4.25)#22 | 1.2%(+4.20)#789 |
| 23. | 41553 | 5.0% | 1.1%(+3.82)#23 | 1.2%(+3.77)#924 |
| 24. | 42647 | 5.0% | 1.1%(+3.82)#24 | 1.2%(+3.77)#925 |
| 25. | 42411 | 4.9% | 1.1%(+3.81)#25 | 1.2%(+3.76)#932 |
| 26. | 42058 | 4.9% | 1.1%(+3.81)#26 | 1.2%(+3.76)#933 |
| 27. | 40824 | 4.9% | 1.1%(+3.72)#27 | 1.2%(+3.67)#966 |
| 28. | 40923 | 4.7% | 1.1%(+3.59)#28 | 1.2%(+3.54)#1,014 |
| 29. | 40771 | 4.5% | 1.1%(+3.36)#29 | 1.2%(+3.31)#1,104 |
| 30. | 42214 | 4.4% | 1.1%(+3.31)#30 | 1.2%(+3.26)#1,129 |
| 31. | 40385 | 4.4% | 1.1%(+3.25)#31 | 1.2%(+3.20)#1,157 |
| 32. | 41844 | 4.3% | 1.1%(+3.20)#32 | 1.2%(+3.15)#1,184 |
| 33. | 40109 | 4.2% | 1.1%(+3.06)#33 | 1.2%(+3.01)#1,264 |
| 34. | 41731 | 4.1% | 1.1%(+2.96)#34 | 1.2%(+2.91)#1,298 |
| 35. | 42436 | 3.9% | 1.1%(+2.73)#35 | 1.2%(+2.68)#1,432 |
| 36. | 41240 | 3.8% | 1.1%(+2.62)#36 | 1.2%(+2.57)#1,500 |
| 37. | 40006 | 3.7% | 1.1%(+2.62)#37 | 1.2%(+2.56)#1,508 |
| 38. | 42445 | 3.7% | 1.1%(+2.58)#38 | 1.2%(+2.53)#1,539 |
| 39. | 41168 | 3.7% | 1.1%(+2.52)#39 | 1.2%(+2.47)#1,594 |
| 40. | 42236 | 3.6% | 1.1%(+2.51)#40 | 1.2%(+2.46)#1,605 |
| 41. | 40510 | 3.6% | 1.1%(+2.47)#41 | 1.2%(+2.42)#1,633 |
| 42. | 41219 | 3.6% | 1.1%(+2.42)#42 | 1.2%(+2.37)#1,674 |
| 43. | 40211 | 3.4% | 1.1%(+2.29)#43 | 1.2%(+2.24)#1,791 |
| 44. | 41777 | 3.4% | 1.1%(+2.25)#44 | 1.2%(+2.20)#1,816 |
| 45. | 42528 | 3.4% | 1.1%(+2.25)#45 | 1.2%(+2.20)#1,822 |
| 46. | 40359 | 3.4% | 1.1%(+2.23)#46 | 1.2%(+2.18)#1,846 |
| 47. | 41544 | 3.4% | 1.1%(+2.23)#47 | 1.2%(+2.18)#1,848 |
| 48. | 42441 | 3.4% | 1.1%(+2.22)#48 | 1.2%(+2.17)#1,853 |
| 49. | 42330 | 3.4% | 1.1%(+2.22)#49 | 1.2%(+2.17)#1,855 |
| 50. | 40055 | 3.2% | 1.1%(+2.10)#50 | 1.2%(+2.05)#1,974 |
| 51. | 41858 | 3.2% | 1.1%(+2.10)#51 | 1.2%(+2.05)#1,980 |
| 52. | 42044 | 3.2% | 1.1%(+2.07)#52 | 1.2%(+2.02)#2,024 |
| 53. | 41171 | 3.1% | 1.1%(+1.96)#53 | 1.2%(+1.91)#2,135 |
| 54. | 40142 | 3.1% | 1.1%(+1.92)#54 | 1.2%(+1.87)#2,176 |
| 55. | 40460 | 3.0% | 1.1%(+1.88)#55 | 1.2%(+1.83)#2,224 |
| 56. | 40741 | 2.9% | 1.1%(+1.76)#56 | 1.2%(+1.70)#2,397 |
| 57. | 40360 | 2.9% | 1.1%(+1.74)#57 | 1.2%(+1.69)#2,419 |
| 58. | 42320 | 2.8% | 1.1%(+1.71)#58 | 1.2%(+1.66)#2,479 |
| 59. | 40160 | 2.8% | 1.1%(+1.68)#59 | 1.2%(+1.63)#2,530 |
| 60. | 40143 | 2.8% | 1.1%(+1.67)#60 | 1.2%(+1.62)#2,566 |
| 61. | 42456 | 2.8% | 1.1%(+1.63)#61 | 1.2%(+1.58)#2,626 |
| 62. | 40906 | 2.7% | 1.1%(+1.61)#62 | 1.2%(+1.56)#2,645 |
| 63. | 42035 | 2.7% | 1.1%(+1.60)#63 | 1.2%(+1.55)#2,669 |
| 64. | 40150 | 2.7% | 1.1%(+1.57)#64 | 1.2%(+1.52)#2,719 |
| 65. | 40516 | 2.7% | 1.1%(+1.54)#65 | 1.2%(+1.48)#2,771 |
| 66. | 42240 | 2.6% | 1.1%(+1.47)#66 | 1.2%(+1.41)#2,898 |
| 67. | 40177 | 2.6% | 1.1%(+1.46)#67 | 1.2%(+1.41)#2,900 |
| 68. | 41143 | 2.5% | 1.1%(+1.37)#68 | 1.2%(+1.32)#3,084 |
| 69. | 40371 | 2.5% | 1.1%(+1.37)#69 | 1.2%(+1.32)#3,085 |
| 70. | 42343 | 2.5% | 1.1%(+1.34)#70 | 1.2%(+1.29)#3,158 |
| 71. | 42259 | 2.5% | 1.1%(+1.33)#71 | 1.2%(+1.28)#3,171 |
| 72. | 42410 | 2.4% | 1.1%(+1.29)#72 | 1.2%(+1.24)#3,273 |
| 73. | 42653 | 2.4% | 1.1%(+1.25)#73 | 1.2%(+1.20)#3,363 |
| 74. | 40601 | 2.4% | 1.1%(+1.22)#74 | 1.2%(+1.17)#3,446 |
| 75. | 42409 | 2.3% | 1.1%(+1.21)#75 | 1.2%(+1.16)#3,451 |
| 76. | 42450 | 2.3% | 1.1%(+1.20)#76 | 1.2%(+1.15)#3,474 |
| 77. | 40162 | 2.3% | 1.1%(+1.20)#77 | 1.2%(+1.15)#3,482 |
| 78. | 41039 | 2.3% | 1.1%(+1.17)#78 | 1.2%(+1.12)#3,539 |
| 79. | 41740 | 2.3% | 1.1%(+1.14)#79 | 1.2%(+1.09)#3,643 |
| 80. | 40456 | 2.3% | 1.1%(+1.12)#80 | 1.2%(+1.07)#3,686 |
| 81. | 42327 | 2.2% | 1.1%(+1.11)#81 | 1.2%(+1.06)#3,720 |
| 82. | 41256 | 2.2% | 1.1%(+1.04)#82 | 1.2%(+0.992)#3,936 |
| 83. | 42461 | 2.2% | 1.1%(+1.02)#83 | 1.2%(+0.974)#3,987 |
| 84. | 41129 | 2.1% | 1.1%(+0.953)#84 | 1.2%(+0.903)#4,186 |
| 85. | 40484 | 2.1% | 1.1%(+0.935)#85 | 1.2%(+0.884)#4,248 |
| 86. | 40447 | 2.1% | 1.1%(+0.933)#86 | 1.2%(+0.883)#4,260 |
| 87. | 42134 | 2.1% | 1.1%(+0.927)#87 | 1.2%(+0.876)#4,289 |
| 88. | 40118 | 2.1% | 1.1%(+0.916)#88 | 1.2%(+0.865)#4,326 |
| 89. | 42071 | 2.0% | 1.1%(+0.911)#89 | 1.2%(+0.860)#4,351 |
| 90. | 40067 | 2.0% | 1.1%(+0.893)#90 | 1.2%(+0.842)#4,414 |
| 91. | 42765 | 2.0% | 1.1%(+0.858)#91 | 1.2%(+0.807)#4,530 |
| 92. | 42210 | 2.0% | 1.1%(+0.854)#92 | 1.2%(+0.803)#4,543 |
| 93. | 41051 | 2.0% | 1.1%(+0.844)#93 | 1.2%(+0.793)#4,594 |
| 94. | 41572 | 2.0% | 1.1%(+0.844)#94 | 1.2%(+0.793)#4,595 |
| 95. | 41141 | 2.0% | 1.1%(+0.836)#95 | 1.2%(+0.785)#4,623 |
| 96. | 40068 | 2.0% | 1.1%(+0.830)#96 | 1.2%(+0.779)#4,647 |
| 97. | 42054 | 2.0% | 1.1%(+0.829)#97 | 1.2%(+0.778)#4,649 |
| 98. | 40219 | 1.9% | 1.1%(+0.810)#98 | 1.2%(+0.759)#4,721 |
| 99. | 40379 | 1.9% | 1.1%(+0.791)#99 | 1.2%(+0.740)#4,804 |
| 100. | 41098 | 1.9% | 1.1%(+0.781)#100 | 1.2%(+0.730)#4,852 |
Common Questions
What are the Top 10 Zip Codes with the Highest Percentage of Population Employed in Firefighting & Prevention in Kentucky?
Top 10 Zip Codes with the Highest Percentage of Population Employed in Firefighting & Prevention in Kentucky are:
What zip code has the Highest Percentage of Population Employed in Firefighting & Prevention in Kentucky?
40903 has the Highest Percentage of Population Employed in Firefighting & Prevention in Kentucky with 33.5%.
What is the Percentage of Population Employed in Firefighting & Prevention in the State of Kentucky?
Percentage of Population Employed in Firefighting & Prevention in Kentucky is 1.1%.
What is the Percentage of Population Employed in Firefighting & Prevention in the United States?
Percentage of Population Employed in Firefighting & Prevention in the United States is 1.2%.