Zip Codes with the Highest Percentage of Population Employed in Arts, Entertainment & Recreation in Kentucky
RELATED REPORTS & OPTIONS
Arts, Entertainment & Recreation
Kentucky
Compare Zip Codes
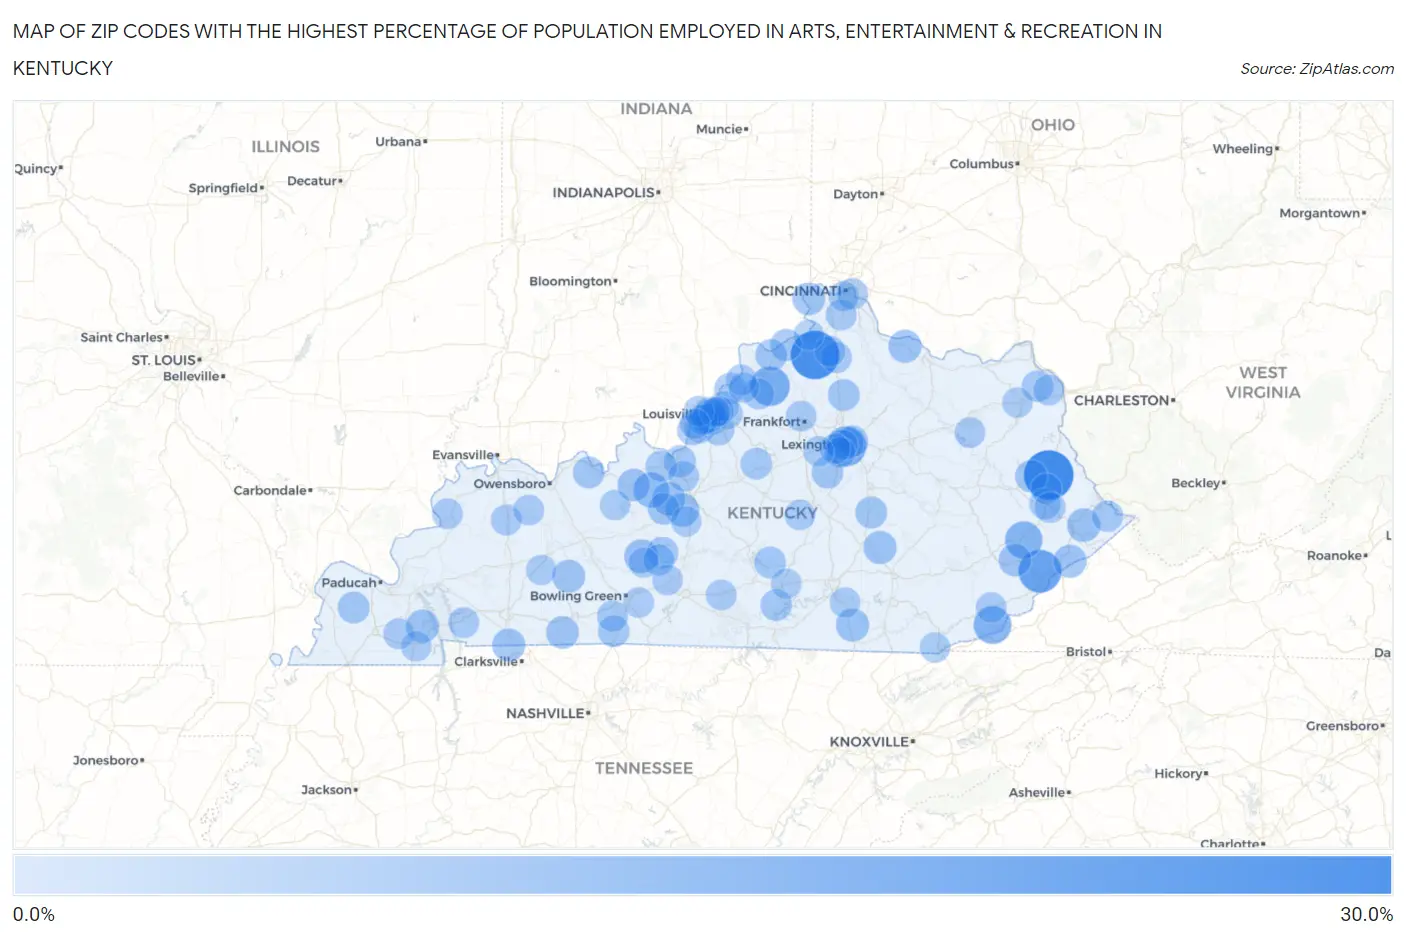
Map of Zip Codes with the Highest Percentage of Population Employed in Arts, Entertainment & Recreation in Kentucky
0.0%
30.0%
Zip Codes with the Highest Percentage of Population Employed in Arts, Entertainment & Recreation in Kentucky
| Zip Code | % Employed | vs State | vs National | |
| 1. | 41271 | 29.8% | 1.4%(+28.3)#1 | 2.1%(+27.7)#78 |
| 2. | 41052 | 28.1% | 1.4%(+26.7)#2 | 2.1%(+26.0)#92 |
| 3. | 41815 | 19.9% | 1.4%(+18.5)#3 | 2.1%(+17.9)#188 |
| 4. | 40526 | 16.0% | 1.4%(+14.6)#4 | 2.1%(+13.9)#291 |
| 5. | 40050 | 15.1% | 1.4%(+13.7)#5 | 2.1%(+13.0)#329 |
| 6. | 40815 | 12.6% | 1.4%(+11.2)#6 | 2.1%(+10.5)#476 |
| 7. | 41831 | 12.0% | 1.4%(+10.5)#7 | 2.1%(+9.87)#511 |
| 8. | 40115 | 9.2% | 1.4%(+7.75)#8 | 2.1%(+7.11)#822 |
| 9. | 42285 | 7.0% | 1.4%(+5.53)#9 | 2.1%(+4.89)#1,341 |
| 10. | 42740 | 6.6% | 1.4%(+5.11)#10 | 2.1%(+4.47)#1,471 |
| 11. | 41557 | 6.5% | 1.4%(+5.05)#11 | 2.1%(+4.41)#1,502 |
| 12. | 42724 | 6.5% | 1.4%(+5.01)#12 | 2.1%(+4.38)#1,518 |
| 13. | 42653 | 6.1% | 1.4%(+4.63)#13 | 2.1%(+4.00)#1,661 |
| 14. | 42048 | 6.1% | 1.4%(+4.63)#14 | 2.1%(+3.99)#1,662 |
| 15. | 41563 | 6.0% | 1.4%(+4.58)#15 | 2.1%(+3.94)#1,692 |
| 16. | 41002 | 5.9% | 1.4%(+4.43)#16 | 2.1%(+3.80)#1,768 |
| 17. | 40445 | 5.9% | 1.4%(+4.41)#17 | 2.1%(+3.78)#1,775 |
| 18. | 42223 | 5.8% | 1.4%(+4.31)#18 | 2.1%(+3.67)#1,825 |
| 19. | 42339 | 5.7% | 1.4%(+4.23)#19 | 2.1%(+3.60)#1,870 |
| 20. | 41080 | 5.6% | 1.4%(+4.12)#20 | 2.1%(+3.48)#1,928 |
| 21. | 41773 | 5.5% | 1.4%(+4.01)#21 | 2.1%(+3.38)#1,989 |
| 22. | 42265 | 5.3% | 1.4%(+3.86)#22 | 2.1%(+3.23)#2,077 |
| 23. | 40144 | 5.1% | 1.4%(+3.69)#23 | 2.1%(+3.06)#2,189 |
| 24. | 41256 | 4.9% | 1.4%(+3.45)#24 | 2.1%(+2.82)#2,359 |
| 25. | 40404 | 4.3% | 1.4%(+2.83)#25 | 2.1%(+2.20)#2,989 |
| 26. | 42035 | 4.3% | 1.4%(+2.81)#26 | 2.1%(+2.17)#3,011 |
| 27. | 40390 | 4.2% | 1.4%(+2.76)#27 | 2.1%(+2.13)#3,066 |
| 28. | 41045 | 4.2% | 1.4%(+2.76)#28 | 2.1%(+2.13)#3,068 |
| 29. | 42732 | 4.2% | 1.4%(+2.76)#29 | 2.1%(+2.12)#3,080 |
| 30. | 40370 | 4.1% | 1.4%(+2.70)#30 | 2.1%(+2.07)#3,148 |
| 31. | 41008 | 4.1% | 1.4%(+2.70)#31 | 2.1%(+2.06)#3,154 |
| 32. | 42348 | 4.0% | 1.4%(+2.58)#32 | 2.1%(+1.95)#3,296 |
| 33. | 40121 | 3.9% | 1.4%(+2.50)#33 | 2.1%(+1.86)#3,409 |
| 34. | 40508 | 3.9% | 1.4%(+2.48)#34 | 2.1%(+1.84)#3,439 |
| 35. | 42753 | 3.9% | 1.4%(+2.46)#35 | 2.1%(+1.83)#3,466 |
| 36. | 42729 | 3.9% | 1.4%(+2.42)#36 | 2.1%(+1.79)#3,525 |
| 37. | 40280 | 3.8% | 1.4%(+2.35)#37 | 2.1%(+1.71)#3,632 |
| 38. | 40204 | 3.8% | 1.4%(+2.33)#38 | 2.1%(+1.70)#3,663 |
| 39. | 42629 | 3.8% | 1.4%(+2.31)#39 | 2.1%(+1.67)#3,699 |
| 40. | 40505 | 3.7% | 1.4%(+2.29)#40 | 2.1%(+1.66)#3,721 |
| 41. | 40008 | 3.7% | 1.4%(+2.27)#41 | 2.1%(+1.64)#3,745 |
| 42. | 42134 | 3.7% | 1.4%(+2.27)#42 | 2.1%(+1.63)#3,755 |
| 43. | 40205 | 3.6% | 1.4%(+2.14)#43 | 2.1%(+1.51)#3,973 |
| 44. | 41558 | 3.5% | 1.4%(+2.04)#44 | 2.1%(+1.40)#4,171 |
| 45. | 41121 | 3.5% | 1.4%(+2.03)#45 | 2.1%(+1.39)#4,187 |
| 46. | 40026 | 3.5% | 1.4%(+2.01)#46 | 2.1%(+1.38)#4,221 |
| 47. | 40117 | 3.3% | 1.4%(+1.88)#47 | 2.1%(+1.24)#4,514 |
| 48. | 41653 | 3.2% | 1.4%(+1.75)#48 | 2.1%(+1.12)#4,802 |
| 49. | 41097 | 3.2% | 1.4%(+1.73)#49 | 2.1%(+1.09)#4,875 |
| 50. | 40214 | 3.2% | 1.4%(+1.70)#50 | 2.1%(+1.07)#4,922 |
| 51. | 42259 | 3.1% | 1.4%(+1.69)#51 | 2.1%(+1.06)#4,961 |
| 52. | 40228 | 3.1% | 1.4%(+1.60)#52 | 2.1%(+0.969)#5,215 |
| 53. | 41075 | 3.0% | 1.4%(+1.57)#53 | 2.1%(+0.939)#5,300 |
| 54. | 40068 | 3.0% | 1.4%(+1.57)#54 | 2.1%(+0.935)#5,315 |
| 55. | 41602 | 3.0% | 1.4%(+1.56)#55 | 2.1%(+0.923)#5,343 |
| 56. | 42170 | 3.0% | 1.4%(+1.53)#56 | 2.1%(+0.896)#5,423 |
| 57. | 42211 | 2.9% | 1.4%(+1.46)#57 | 2.1%(+0.824)#5,629 |
| 58. | 41601 | 2.9% | 1.4%(+1.44)#58 | 2.1%(+0.808)#5,679 |
| 59. | 40077 | 2.9% | 1.4%(+1.44)#59 | 2.1%(+0.799)#5,704 |
| 60. | 42054 | 2.9% | 1.4%(+1.41)#60 | 2.1%(+0.775)#5,785 |
| 61. | 41102 | 2.8% | 1.4%(+1.39)#61 | 2.1%(+0.751)#5,874 |
| 62. | 40223 | 2.8% | 1.4%(+1.32)#62 | 2.1%(+0.684)#6,110 |
| 63. | 41051 | 2.8% | 1.4%(+1.32)#63 | 2.1%(+0.684)#6,114 |
| 64. | 40601 | 2.8% | 1.4%(+1.32)#64 | 2.1%(+0.682)#6,124 |
| 65. | 42456 | 2.8% | 1.4%(+1.32)#65 | 2.1%(+0.681)#6,128 |
| 66. | 40206 | 2.7% | 1.4%(+1.30)#66 | 2.1%(+0.662)#6,213 |
| 67. | 40160 | 2.7% | 1.4%(+1.21)#67 | 2.1%(+0.571)#6,548 |
| 68. | 40504 | 2.7% | 1.4%(+1.20)#68 | 2.1%(+0.569)#6,556 |
| 69. | 41035 | 2.6% | 1.4%(+1.20)#69 | 2.1%(+0.562)#6,585 |
| 70. | 40258 | 2.6% | 1.4%(+1.16)#70 | 2.1%(+0.519)#6,751 |
| 71. | 42327 | 2.6% | 1.4%(+1.15)#71 | 2.1%(+0.512)#6,781 |
| 72. | 40217 | 2.6% | 1.4%(+1.12)#72 | 2.1%(+0.482)#6,892 |
| 73. | 40865 | 2.6% | 1.4%(+1.12)#73 | 2.1%(+0.482)#6,899 |
| 74. | 40514 | 2.5% | 1.4%(+1.08)#74 | 2.1%(+0.444)#7,064 |
| 75. | 40313 | 2.5% | 1.4%(+1.08)#75 | 2.1%(+0.442)#7,071 |
| 76. | 42459 | 2.5% | 1.4%(+1.05)#76 | 2.1%(+0.416)#7,185 |
| 77. | 42129 | 2.5% | 1.4%(+1.03)#77 | 2.1%(+0.393)#7,284 |
| 78. | 40464 | 2.4% | 1.4%(+0.940)#78 | 2.1%(+0.304)#7,709 |
| 79. | 42160 | 2.4% | 1.4%(+0.920)#79 | 2.1%(+0.284)#7,806 |
| 80. | 41011 | 2.4% | 1.4%(+0.915)#80 | 2.1%(+0.279)#7,828 |
| 81. | 42642 | 2.3% | 1.4%(+0.903)#81 | 2.1%(+0.267)#7,881 |
| 82. | 42103 | 2.3% | 1.4%(+0.864)#82 | 2.1%(+0.228)#8,080 |
| 83. | 40119 | 2.3% | 1.4%(+0.859)#83 | 2.1%(+0.223)#8,099 |
| 84. | 42071 | 2.3% | 1.4%(+0.850)#84 | 2.1%(+0.214)#8,142 |
| 85. | 40965 | 2.3% | 1.4%(+0.839)#85 | 2.1%(+0.203)#8,197 |
| 86. | 40241 | 2.3% | 1.4%(+0.826)#86 | 2.1%(+0.190)#8,265 |
| 87. | 40208 | 2.3% | 1.4%(+0.819)#87 | 2.1%(+0.183)#8,295 |
| 88. | 40222 | 2.3% | 1.4%(+0.817)#88 | 2.1%(+0.181)#8,314 |
| 89. | 42210 | 2.3% | 1.4%(+0.817)#89 | 2.1%(+0.181)#8,315 |
| 90. | 42519 | 2.2% | 1.4%(+0.771)#90 | 2.1%(+0.135)#8,526 |
| 91. | 40513 | 2.2% | 1.4%(+0.770)#91 | 2.1%(+0.134)#8,537 |
| 92. | 40031 | 2.2% | 1.4%(+0.766)#92 | 2.1%(+0.130)#8,562 |
| 93. | 42776 | 2.1% | 1.4%(+0.701)#93 | 2.1%(+0.065)#8,943 |
| 94. | 40212 | 2.1% | 1.4%(+0.697)#94 | 2.1%(+0.061)#8,973 |
| 95. | 41095 | 2.1% | 1.4%(+0.679)#95 | 2.1%(+0.043)#9,067 |
| 96. | 40207 | 2.1% | 1.4%(+0.677)#96 | 2.1%(+0.041)#9,076 |
| 97. | 40383 | 2.1% | 1.4%(+0.669)#97 | 2.1%(+0.033)#9,125 |
| 98. | 42345 | 2.1% | 1.4%(+0.647)#98 | 2.1%(+0.011)#9,253 |
| 99. | 40216 | 2.1% | 1.4%(+0.646)#99 | 2.1%(+0.010)#9,258 |
| 100. | 41143 | 2.1% | 1.4%(+0.641)#100 | 2.1%(+0.005)#9,284 |
Common Questions
What are the Top 10 Zip Codes with the Highest Percentage of Population Employed in Arts, Entertainment & Recreation in Kentucky?
Top 10 Zip Codes with the Highest Percentage of Population Employed in Arts, Entertainment & Recreation in Kentucky are:
What zip code has the Highest Percentage of Population Employed in Arts, Entertainment & Recreation in Kentucky?
41271 has the Highest Percentage of Population Employed in Arts, Entertainment & Recreation in Kentucky with 29.8%.
What is the Percentage of Population Employed in Arts, Entertainment & Recreation in the State of Kentucky?
Percentage of Population Employed in Arts, Entertainment & Recreation in Kentucky is 1.4%.
What is the Percentage of Population Employed in Arts, Entertainment & Recreation in the United States?
Percentage of Population Employed in Arts, Entertainment & Recreation in the United States is 2.1%.