Zip Codes with the Highest Percentage of Population Employed in Cleaning & Maintenance in Kentucky
RELATED REPORTS & OPTIONS
Cleaning & Maintenance
Kentucky
Compare Zip Codes
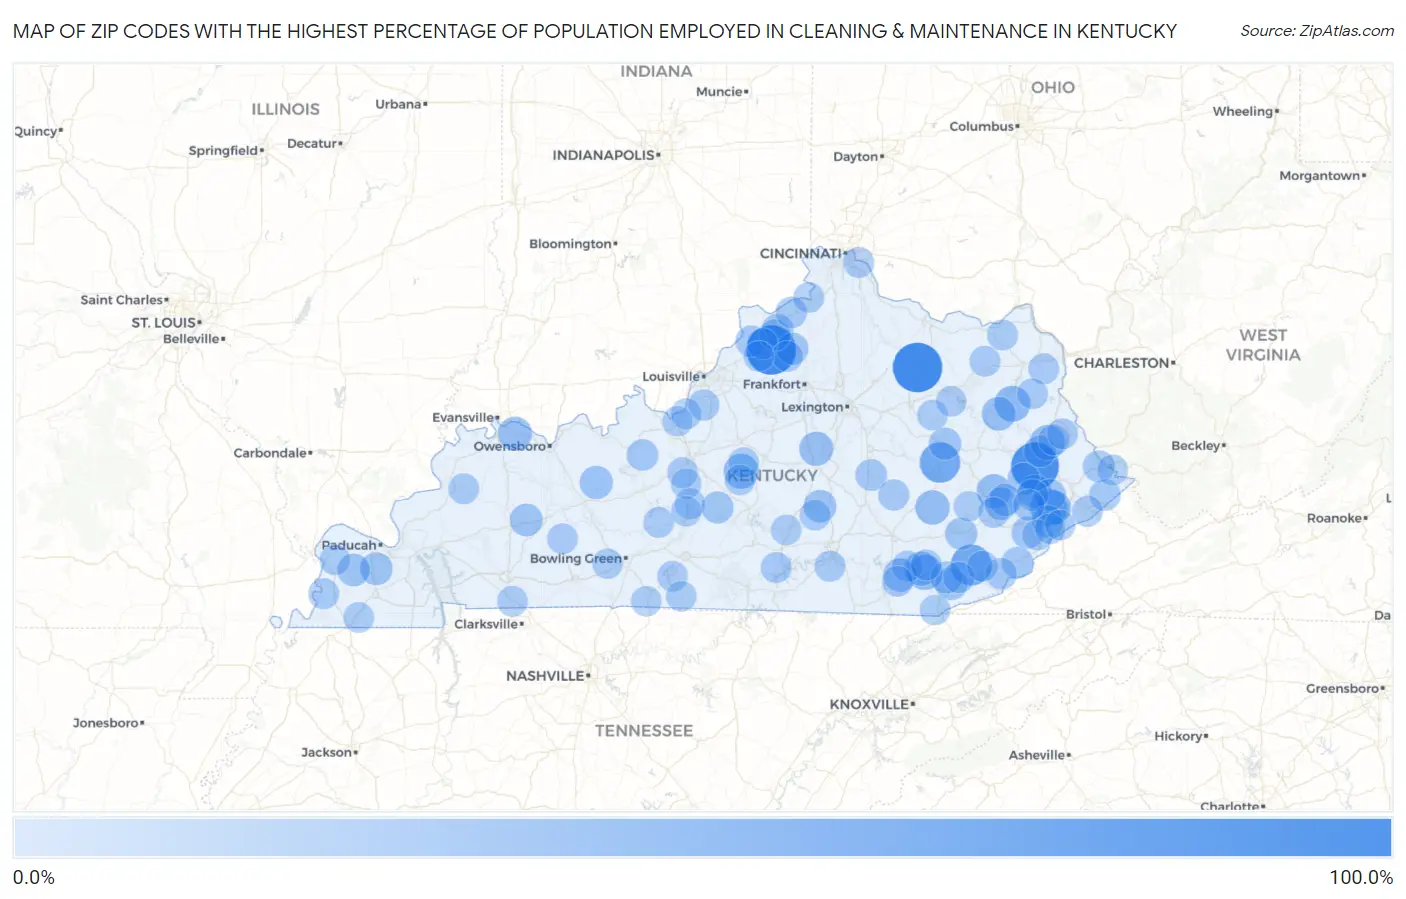
Map of Zip Codes with the Highest Percentage of Population Employed in Cleaning & Maintenance in Kentucky
0.0%
100.0%
Zip Codes with the Highest Percentage of Population Employed in Cleaning & Maintenance in Kentucky
| Zip Code | % Employed | vs State | vs National | |
| 1. | 40350 | 100.0% | 3.3%(+96.7)#1 | 3.5%(+96.5)#5 |
| 2. | 40058 | 100.0% | 3.3%(+96.7)#2 | 3.5%(+96.5)#9 |
| 3. | 41607 | 91.5% | 3.3%(+88.2)#3 | 3.5%(+88.1)#13 |
| 4. | 40840 | 57.6% | 3.3%(+54.3)#4 | 3.5%(+54.2)#33 |
| 5. | 41397 | 55.1% | 3.3%(+51.7)#5 | 3.5%(+51.6)#37 |
| 6. | 41606 | 40.7% | 3.3%(+37.4)#6 | 3.5%(+37.3)#83 |
| 7. | 41149 | 33.3% | 3.3%(+30.0)#7 | 3.5%(+29.9)#138 |
| 8. | 40062 | 30.0% | 3.3%(+26.7)#8 | 3.5%(+26.5)#171 |
| 9. | 40915 | 29.6% | 3.3%(+26.3)#9 | 3.5%(+26.1)#174 |
| 10. | 41234 | 27.8% | 3.3%(+24.5)#10 | 3.5%(+24.3)#199 |
| 11. | 40983 | 25.9% | 3.3%(+22.6)#11 | 3.5%(+22.4)#237 |
| 12. | 41650 | 25.7% | 3.3%(+22.4)#12 | 3.5%(+22.3)#240 |
| 13. | 40923 | 25.0% | 3.3%(+21.7)#13 | 3.5%(+21.5)#250 |
| 14. | 41317 | 25.0% | 3.3%(+21.7)#14 | 3.5%(+21.5)#251 |
| 15. | 40310 | 24.3% | 3.3%(+21.0)#15 | 3.5%(+20.8)#266 |
| 16. | 42458 | 23.9% | 3.3%(+20.6)#16 | 3.5%(+20.4)#276 |
| 17. | 41421 | 23.7% | 3.3%(+20.3)#17 | 3.5%(+20.2)#281 |
| 18. | 40771 | 21.6% | 3.3%(+18.3)#18 | 3.5%(+18.1)#343 |
| 19. | 42361 | 20.8% | 3.3%(+17.5)#19 | 3.5%(+17.3)#375 |
| 20. | 41630 | 19.0% | 3.3%(+15.7)#20 | 3.5%(+15.6)#449 |
| 21. | 42344 | 18.2% | 3.3%(+14.9)#21 | 3.5%(+14.7)#487 |
| 22. | 41712 | 17.9% | 3.3%(+14.6)#22 | 3.5%(+14.4)#506 |
| 23. | 42027 | 17.9% | 3.3%(+14.6)#23 | 3.5%(+14.4)#508 |
| 24. | 40442 | 17.8% | 3.3%(+14.5)#24 | 3.5%(+14.3)#512 |
| 25. | 42035 | 17.6% | 3.3%(+14.3)#25 | 3.5%(+14.1)#519 |
| 26. | 40958 | 17.0% | 3.3%(+13.6)#26 | 3.5%(+13.5)#580 |
| 27. | 41360 | 16.5% | 3.3%(+13.1)#27 | 3.5%(+13.0)#621 |
| 28. | 41632 | 16.4% | 3.3%(+13.1)#28 | 3.5%(+12.9)#626 |
| 29. | 41722 | 16.2% | 3.3%(+12.9)#29 | 3.5%(+12.7)#643 |
| 30. | 40075 | 16.1% | 3.3%(+12.8)#30 | 3.5%(+12.7)#646 |
| 31. | 41714 | 15.7% | 3.3%(+12.4)#31 | 3.5%(+12.2)#678 |
| 32. | 41826 | 15.5% | 3.3%(+12.2)#32 | 3.5%(+12.0)#696 |
| 33. | 40902 | 15.3% | 3.3%(+12.0)#33 | 3.5%(+11.8)#718 |
| 34. | 42782 | 15.2% | 3.3%(+11.8)#34 | 3.5%(+11.7)#732 |
| 35. | 40036 | 14.5% | 3.3%(+11.2)#35 | 3.5%(+11.1)#797 |
| 36. | 41216 | 14.5% | 3.3%(+11.2)#36 | 3.5%(+11.0)#804 |
| 37. | 41647 | 13.9% | 3.3%(+10.6)#37 | 3.5%(+10.4)#881 |
| 38. | 41812 | 13.9% | 3.3%(+10.6)#38 | 3.5%(+10.4)#883 |
| 39. | 41839 | 13.1% | 3.3%(+9.77)#39 | 3.5%(+9.60)#1,003 |
| 40. | 40404 | 12.8% | 3.3%(+9.52)#40 | 3.5%(+9.35)#1,043 |
| 41. | 40140 | 12.6% | 3.3%(+9.33)#41 | 3.5%(+9.15)#1,073 |
| 42. | 41527 | 12.6% | 3.3%(+9.27)#42 | 3.5%(+9.10)#1,082 |
| 43. | 40055 | 12.5% | 3.3%(+9.18)#43 | 3.5%(+9.01)#1,102 |
| 44. | 40011 | 12.4% | 3.3%(+9.09)#44 | 3.5%(+8.92)#1,117 |
| 45. | 40823 | 12.4% | 3.3%(+9.06)#45 | 3.5%(+8.89)#1,125 |
| 46. | 41524 | 12.2% | 3.3%(+8.88)#46 | 3.5%(+8.71)#1,164 |
| 47. | 41817 | 12.1% | 3.3%(+8.78)#47 | 3.5%(+8.61)#1,183 |
| 48. | 40988 | 11.7% | 3.3%(+8.38)#48 | 3.5%(+8.21)#1,278 |
| 49. | 40828 | 11.7% | 3.3%(+8.36)#49 | 3.5%(+8.19)#1,285 |
| 50. | 40481 | 11.1% | 3.3%(+7.80)#50 | 3.5%(+7.63)#1,453 |
| 51. | 41083 | 11.0% | 3.3%(+7.68)#51 | 3.5%(+7.51)#1,489 |
| 52. | 40109 | 10.4% | 3.3%(+7.07)#52 | 3.5%(+6.90)#1,668 |
| 53. | 40070 | 10.3% | 3.3%(+7.03)#53 | 3.5%(+6.86)#1,683 |
| 54. | 40734 | 9.7% | 3.3%(+6.40)#54 | 3.5%(+6.23)#1,945 |
| 55. | 41204 | 9.6% | 3.3%(+6.29)#55 | 3.5%(+6.12)#1,995 |
| 56. | 41522 | 9.6% | 3.3%(+6.27)#56 | 3.5%(+6.09)#2,007 |
| 57. | 40810 | 9.6% | 3.3%(+6.25)#57 | 3.5%(+6.08)#2,011 |
| 58. | 41141 | 9.5% | 3.3%(+6.17)#58 | 3.5%(+6.00)#2,053 |
| 59. | 40953 | 9.4% | 3.3%(+6.14)#59 | 3.5%(+5.97)#2,071 |
| 60. | 42629 | 9.4% | 3.3%(+6.07)#60 | 3.5%(+5.90)#2,097 |
| 61. | 42032 | 9.3% | 3.3%(+6.02)#61 | 3.5%(+5.85)#2,133 |
| 62. | 41544 | 9.2% | 3.3%(+5.93)#62 | 3.5%(+5.76)#2,167 |
| 63. | 40057 | 9.2% | 3.3%(+5.91)#63 | 3.5%(+5.74)#2,177 |
| 64. | 41168 | 9.1% | 3.3%(+5.82)#64 | 3.5%(+5.65)#2,220 |
| 65. | 42463 | 9.1% | 3.3%(+5.78)#65 | 3.5%(+5.61)#2,251 |
| 66. | 42518 | 9.1% | 3.3%(+5.77)#66 | 3.5%(+5.60)#2,256 |
| 67. | 42713 | 9.0% | 3.3%(+5.65)#67 | 3.5%(+5.48)#2,321 |
| 68. | 41135 | 8.9% | 3.3%(+5.58)#68 | 3.5%(+5.41)#2,373 |
| 69. | 40759 | 8.9% | 3.3%(+5.54)#69 | 3.5%(+5.37)#2,396 |
| 70. | 41262 | 8.8% | 3.3%(+5.53)#70 | 3.5%(+5.36)#2,401 |
| 71. | 41085 | 8.8% | 3.3%(+5.47)#71 | 3.5%(+5.30)#2,430 |
| 72. | 42566 | 8.5% | 3.3%(+5.22)#72 | 3.5%(+5.04)#2,592 |
| 73. | 42324 | 8.5% | 3.3%(+5.20)#73 | 3.5%(+5.03)#2,600 |
| 74. | 41858 | 8.5% | 3.3%(+5.19)#74 | 3.5%(+5.02)#2,618 |
| 75. | 41701 | 8.4% | 3.3%(+5.14)#75 | 3.5%(+4.96)#2,643 |
| 76. | 40068 | 8.3% | 3.3%(+4.97)#76 | 3.5%(+4.80)#2,792 |
| 77. | 41095 | 8.2% | 3.3%(+4.93)#77 | 3.5%(+4.76)#2,829 |
| 78. | 42262 | 8.2% | 3.3%(+4.87)#78 | 3.5%(+4.70)#2,881 |
| 79. | 41180 | 8.2% | 3.3%(+4.85)#79 | 3.5%(+4.68)#2,901 |
| 80. | 42740 | 8.0% | 3.3%(+4.73)#80 | 3.5%(+4.56)#3,001 |
| 81. | 40177 | 8.0% | 3.3%(+4.66)#81 | 3.5%(+4.49)#3,070 |
| 82. | 40346 | 7.9% | 3.3%(+4.61)#82 | 3.5%(+4.44)#3,098 |
| 83. | 42259 | 7.8% | 3.3%(+4.54)#83 | 3.5%(+4.36)#3,179 |
| 84. | 42085 | 7.8% | 3.3%(+4.49)#84 | 3.5%(+4.32)#3,221 |
| 85. | 42156 | 7.8% | 3.3%(+4.47)#85 | 3.5%(+4.30)#3,247 |
| 86. | 41840 | 7.6% | 3.3%(+4.29)#86 | 3.5%(+4.12)#3,428 |
| 87. | 40371 | 7.6% | 3.3%(+4.29)#87 | 3.5%(+4.12)#3,433 |
| 88. | 41537 | 7.5% | 3.3%(+4.24)#88 | 3.5%(+4.07)#3,488 |
| 89. | 42120 | 7.4% | 3.3%(+4.10)#89 | 3.5%(+3.93)#3,636 |
| 90. | 42528 | 7.4% | 3.3%(+4.07)#90 | 3.5%(+3.90)#3,664 |
| 91. | 40037 | 7.4% | 3.3%(+4.06)#91 | 3.5%(+3.89)#3,674 |
| 92. | 42776 | 7.4% | 3.3%(+4.05)#92 | 3.5%(+3.88)#3,681 |
| 93. | 42087 | 7.3% | 3.3%(+4.02)#93 | 3.5%(+3.85)#3,704 |
| 94. | 42765 | 7.3% | 3.3%(+3.97)#94 | 3.5%(+3.80)#3,764 |
| 95. | 42133 | 7.3% | 3.3%(+3.95)#95 | 3.5%(+3.78)#3,786 |
| 96. | 40965 | 7.2% | 3.3%(+3.89)#96 | 3.5%(+3.72)#3,862 |
| 97. | 41745 | 7.1% | 3.3%(+3.83)#97 | 3.5%(+3.66)#3,918 |
| 98. | 42274 | 7.0% | 3.3%(+3.72)#98 | 3.5%(+3.55)#4,031 |
| 99. | 40060 | 7.0% | 3.3%(+3.70)#99 | 3.5%(+3.53)#4,063 |
| 100. | 40155 | 7.0% | 3.3%(+3.66)#100 | 3.5%(+3.49)#4,106 |
Common Questions
What are the Top 10 Zip Codes with the Highest Percentage of Population Employed in Cleaning & Maintenance in Kentucky?
Top 10 Zip Codes with the Highest Percentage of Population Employed in Cleaning & Maintenance in Kentucky are:
What zip code has the Highest Percentage of Population Employed in Cleaning & Maintenance in Kentucky?
40350 has the Highest Percentage of Population Employed in Cleaning & Maintenance in Kentucky with 100.0%.
What is the Percentage of Population Employed in Cleaning & Maintenance in the State of Kentucky?
Percentage of Population Employed in Cleaning & Maintenance in Kentucky is 3.3%.
What is the Percentage of Population Employed in Cleaning & Maintenance in the United States?
Percentage of Population Employed in Cleaning & Maintenance in the United States is 3.5%.