Zip Codes with the Highest Percentage of Population Employed in Computer & Mathematics in Kentucky
RELATED REPORTS & OPTIONS
Computer & Mathematics
Kentucky
Compare Zip Codes
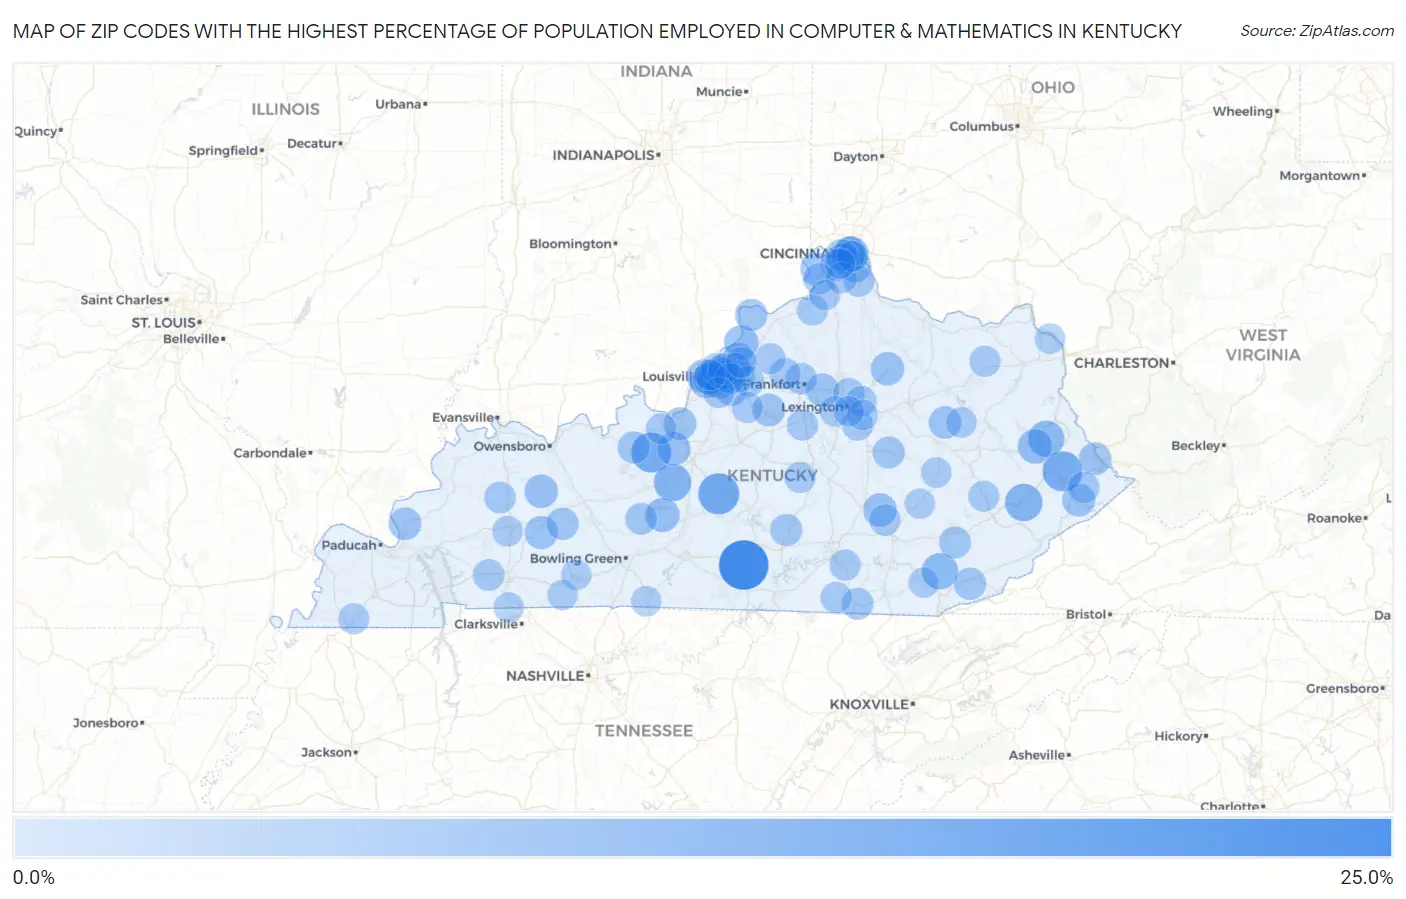
Map of Zip Codes with the Highest Percentage of Population Employed in Computer & Mathematics in Kentucky
0.0%
25.0%
Zip Codes with the Highest Percentage of Population Employed in Computer & Mathematics in Kentucky
| Zip Code | % Employed | vs State | vs National | |
| 1. | 42715 | 25.0% | 2.2%(+22.8)#1 | 3.5%(+21.5)#78 |
| 2. | 42764 | 15.0% | 2.2%(+12.8)#2 | 3.5%(+11.5)#254 |
| 3. | 40115 | 13.8% | 2.2%(+11.6)#3 | 3.5%(+10.3)#320 |
| 4. | 41659 | 13.7% | 2.2%(+11.5)#4 | 3.5%(+10.2)#324 |
| 5. | 42788 | 10.8% | 2.2%(+8.65)#5 | 3.5%(+7.29)#586 |
| 6. | 41831 | 10.8% | 2.2%(+8.64)#6 | 3.5%(+7.28)#587 |
| 7. | 40935 | 9.6% | 2.2%(+7.40)#7 | 3.5%(+6.03)#784 |
| 8. | 41260 | 9.6% | 2.2%(+7.39)#8 | 3.5%(+6.03)#785 |
| 9. | 41074 | 8.0% | 2.2%(+5.81)#9 | 3.5%(+4.45)#1,214 |
| 10. | 40222 | 7.6% | 2.2%(+5.39)#10 | 3.5%(+4.03)#1,370 |
| 11. | 40077 | 7.5% | 2.2%(+5.33)#11 | 3.5%(+3.97)#1,390 |
| 12. | 41222 | 7.3% | 2.2%(+5.14)#12 | 3.5%(+3.78)#1,463 |
| 13. | 42729 | 7.1% | 2.2%(+4.96)#13 | 3.5%(+3.60)#1,556 |
| 14. | 40202 | 6.9% | 2.2%(+4.70)#14 | 3.5%(+3.34)#1,699 |
| 15. | 40445 | 6.6% | 2.2%(+4.43)#15 | 3.5%(+3.07)#1,865 |
| 16. | 42350 | 6.5% | 2.2%(+4.33)#16 | 3.5%(+2.97)#1,930 |
| 17. | 40162 | 6.5% | 2.2%(+4.30)#17 | 3.5%(+2.94)#1,960 |
| 18. | 40348 | 6.4% | 2.2%(+4.25)#18 | 3.5%(+2.89)#1,996 |
| 19. | 40217 | 6.2% | 2.2%(+4.06)#19 | 3.5%(+2.69)#2,133 |
| 20. | 42345 | 6.2% | 2.2%(+3.99)#20 | 3.5%(+2.63)#2,184 |
| 21. | 41562 | 6.0% | 2.2%(+3.86)#21 | 3.5%(+2.49)#2,299 |
| 22. | 40010 | 5.9% | 2.2%(+3.72)#22 | 3.5%(+2.36)#2,423 |
| 23. | 40347 | 5.9% | 2.2%(+3.70)#23 | 3.5%(+2.34)#2,439 |
| 24. | 40121 | 5.7% | 2.2%(+3.51)#24 | 3.5%(+2.15)#2,614 |
| 25. | 41076 | 5.6% | 2.2%(+3.40)#25 | 3.5%(+2.04)#2,710 |
| 26. | 42081 | 5.5% | 2.2%(+3.37)#26 | 3.5%(+2.01)#2,743 |
| 27. | 41514 | 5.5% | 2.2%(+3.35)#27 | 3.5%(+1.99)#2,761 |
| 28. | 40046 | 5.5% | 2.2%(+3.30)#28 | 3.5%(+1.94)#2,823 |
| 29. | 40322 | 5.5% | 2.2%(+3.30)#29 | 3.5%(+1.94)#2,828 |
| 30. | 40207 | 5.4% | 2.2%(+3.23)#30 | 3.5%(+1.87)#2,904 |
| 31. | 41071 | 5.3% | 2.2%(+3.16)#31 | 3.5%(+1.80)#2,974 |
| 32. | 42337 | 5.1% | 2.2%(+2.97)#32 | 3.5%(+1.61)#3,189 |
| 33. | 40280 | 5.1% | 2.2%(+2.90)#33 | 3.5%(+1.54)#3,280 |
| 34. | 40873 | 5.0% | 2.2%(+2.84)#34 | 3.5%(+1.48)#3,348 |
| 35. | 40045 | 5.0% | 2.2%(+2.83)#35 | 3.5%(+1.47)#3,360 |
| 36. | 40220 | 5.0% | 2.2%(+2.81)#36 | 3.5%(+1.45)#3,381 |
| 37. | 40144 | 4.9% | 2.2%(+2.76)#37 | 3.5%(+1.40)#3,461 |
| 38. | 42528 | 4.9% | 2.2%(+2.76)#38 | 3.5%(+1.40)#3,467 |
| 39. | 41073 | 4.8% | 2.2%(+2.68)#39 | 3.5%(+1.32)#3,584 |
| 40. | 40385 | 4.8% | 2.2%(+2.67)#40 | 3.5%(+1.31)#3,589 |
| 41. | 40245 | 4.8% | 2.2%(+2.63)#41 | 3.5%(+1.27)#3,649 |
| 42. | 40914 | 4.7% | 2.2%(+2.58)#42 | 3.5%(+1.22)#3,720 |
| 43. | 40299 | 4.7% | 2.2%(+2.56)#43 | 3.5%(+1.20)#3,754 |
| 44. | 42285 | 4.7% | 2.2%(+2.49)#44 | 3.5%(+1.13)#3,866 |
| 45. | 42635 | 4.6% | 2.2%(+2.41)#45 | 3.5%(+1.05)#3,978 |
| 46. | 40056 | 4.6% | 2.2%(+2.40)#46 | 3.5%(+1.04)#3,995 |
| 47. | 40205 | 4.5% | 2.2%(+2.32)#47 | 3.5%(+0.957)#4,109 |
| 48. | 40204 | 4.5% | 2.2%(+2.29)#48 | 3.5%(+0.932)#4,161 |
| 49. | 42232 | 4.4% | 2.2%(+2.27)#49 | 3.5%(+0.906)#4,218 |
| 50. | 41557 | 4.4% | 2.2%(+2.22)#50 | 3.5%(+0.856)#4,298 |
| 51. | 42436 | 4.4% | 2.2%(+2.19)#51 | 3.5%(+0.828)#4,338 |
| 52. | 40511 | 4.3% | 2.2%(+2.17)#52 | 3.5%(+0.805)#4,377 |
| 53. | 40601 | 4.3% | 2.2%(+2.16)#53 | 3.5%(+0.796)#4,393 |
| 54. | 41005 | 4.3% | 2.2%(+2.12)#54 | 3.5%(+0.755)#4,466 |
| 55. | 41011 | 4.3% | 2.2%(+2.11)#55 | 3.5%(+0.749)#4,474 |
| 56. | 41018 | 4.2% | 2.2%(+2.07)#56 | 3.5%(+0.706)#4,557 |
| 57. | 40003 | 4.2% | 2.2%(+2.05)#57 | 3.5%(+0.692)#4,578 |
| 58. | 40223 | 4.2% | 2.2%(+2.05)#58 | 3.5%(+0.686)#4,593 |
| 59. | 41016 | 4.2% | 2.2%(+1.99)#59 | 3.5%(+0.632)#4,690 |
| 60. | 40242 | 4.1% | 2.2%(+1.92)#60 | 3.5%(+0.558)#4,850 |
| 61. | 40729 | 4.1% | 2.2%(+1.92)#61 | 3.5%(+0.555)#4,857 |
| 62. | 41091 | 4.0% | 2.2%(+1.86)#62 | 3.5%(+0.498)#4,988 |
| 63. | 40515 | 4.0% | 2.2%(+1.79)#63 | 3.5%(+0.433)#5,139 |
| 64. | 40372 | 3.9% | 2.2%(+1.78)#64 | 3.5%(+0.423)#5,155 |
| 65. | 41051 | 3.9% | 2.2%(+1.78)#65 | 3.5%(+0.422)#5,161 |
| 66. | 42519 | 3.9% | 2.2%(+1.77)#66 | 3.5%(+0.407)#5,190 |
| 67. | 42647 | 3.9% | 2.2%(+1.75)#67 | 3.5%(+0.388)#5,232 |
| 68. | 40464 | 3.9% | 2.2%(+1.74)#68 | 3.5%(+0.380)#5,242 |
| 69. | 41001 | 3.9% | 2.2%(+1.71)#69 | 3.5%(+0.345)#5,311 |
| 70. | 40067 | 3.8% | 2.2%(+1.60)#70 | 3.5%(+0.241)#5,564 |
| 71. | 41075 | 3.8% | 2.2%(+1.60)#71 | 3.5%(+0.235)#5,574 |
| 72. | 40025 | 3.7% | 2.2%(+1.58)#72 | 3.5%(+0.221)#5,604 |
| 73. | 40241 | 3.7% | 2.2%(+1.57)#73 | 3.5%(+0.206)#5,641 |
| 74. | 41135 | 3.7% | 2.2%(+1.54)#74 | 3.5%(+0.179)#5,721 |
| 75. | 41348 | 3.7% | 2.2%(+1.52)#75 | 3.5%(+0.156)#5,774 |
| 76. | 40516 | 3.7% | 2.2%(+1.49)#76 | 3.5%(+0.130)#5,828 |
| 77. | 40243 | 3.7% | 2.2%(+1.49)#77 | 3.5%(+0.127)#5,834 |
| 78. | 40513 | 3.6% | 2.2%(+1.48)#78 | 3.5%(+0.120)#5,856 |
| 79. | 41046 | 3.6% | 2.2%(+1.48)#79 | 3.5%(+0.116)#5,865 |
| 80. | 40228 | 3.6% | 2.2%(+1.48)#80 | 3.5%(+0.115)#5,870 |
| 81. | 40019 | 3.6% | 2.2%(+1.48)#81 | 3.5%(+0.114)#5,871 |
| 82. | 40071 | 3.6% | 2.2%(+1.46)#82 | 3.5%(+0.101)#5,903 |
| 83. | 40206 | 3.6% | 2.2%(+1.44)#83 | 3.5%(+0.076)#5,956 |
| 84. | 42041 | 3.6% | 2.2%(+1.40)#84 | 3.5%(+0.039)#6,031 |
| 85. | 40014 | 3.5% | 2.2%(+1.33)#85 | 3.5%(-0.027)#6,212 |
| 86. | 40509 | 3.4% | 2.2%(+1.26)#86 | 3.5%(-0.101)#6,413 |
| 87. | 41017 | 3.4% | 2.2%(+1.24)#87 | 3.5%(-0.117)#6,468 |
| 88. | 42442 | 3.4% | 2.2%(+1.24)#88 | 3.5%(-0.124)#6,485 |
| 89. | 40117 | 3.3% | 2.2%(+1.16)#89 | 3.5%(-0.198)#6,694 |
| 90. | 41092 | 3.3% | 2.2%(+1.11)#90 | 3.5%(-0.255)#6,878 |
| 91. | 40387 | 3.2% | 2.2%(+1.06)#91 | 3.5%(-0.303)#7,031 |
| 92. | 40502 | 3.2% | 2.2%(+1.03)#92 | 3.5%(-0.329)#7,107 |
| 93. | 42120 | 3.2% | 2.2%(+1.01)#93 | 3.5%(-0.347)#7,168 |
| 94. | 41311 | 3.1% | 2.2%(+0.978)#94 | 3.5%(-0.383)#7,289 |
| 95. | 40486 | 3.1% | 2.2%(+0.909)#95 | 3.5%(-0.452)#7,490 |
| 96. | 42276 | 3.1% | 2.2%(+0.906)#96 | 3.5%(-0.455)#7,500 |
| 97. | 41169 | 3.0% | 2.2%(+0.868)#97 | 3.5%(-0.493)#7,628 |
| 98. | 42223 | 3.0% | 2.2%(+0.830)#98 | 3.5%(-0.531)#7,769 |
| 99. | 40903 | 3.0% | 2.2%(+0.809)#99 | 3.5%(-0.552)#7,833 |
| 100. | 42265 | 3.0% | 2.2%(+0.809)#100 | 3.5%(-0.552)#7,837 |
Common Questions
What are the Top 10 Zip Codes with the Highest Percentage of Population Employed in Computer & Mathematics in Kentucky?
Top 10 Zip Codes with the Highest Percentage of Population Employed in Computer & Mathematics in Kentucky are:
What zip code has the Highest Percentage of Population Employed in Computer & Mathematics in Kentucky?
42715 has the Highest Percentage of Population Employed in Computer & Mathematics in Kentucky with 25.0%.
What is the Percentage of Population Employed in Computer & Mathematics in the State of Kentucky?
Percentage of Population Employed in Computer & Mathematics in Kentucky is 2.2%.
What is the Percentage of Population Employed in Computer & Mathematics in the United States?
Percentage of Population Employed in Computer & Mathematics in the United States is 3.5%.