Zip Codes with the Highest Percentage of Population with a Degree in Arts and Humanities in Kentucky
RELATED REPORTS & OPTIONS
Arts and Humanities
Kentucky
Compare Zip Codes
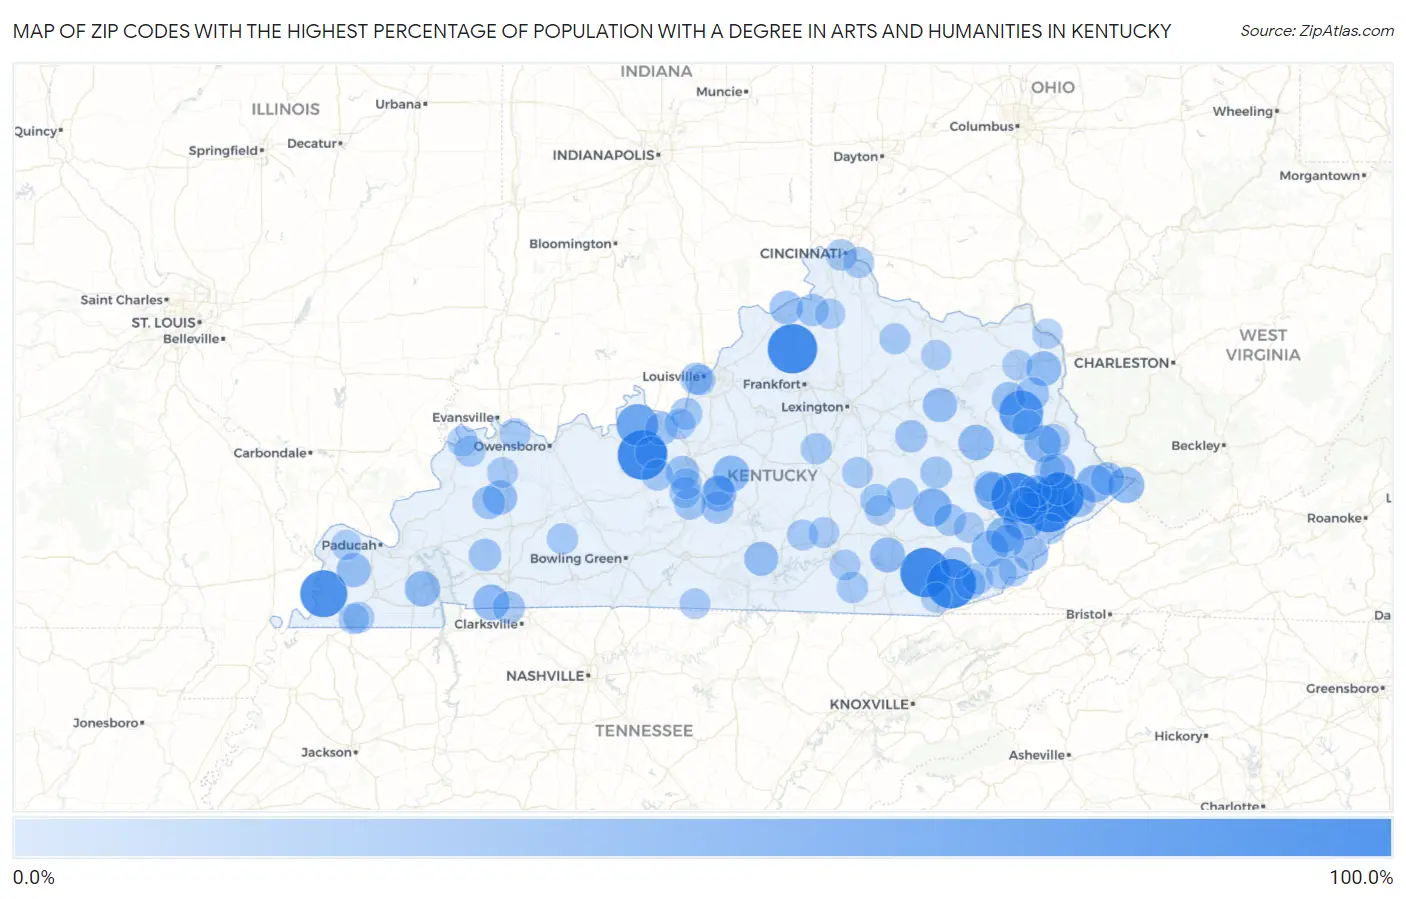
Map of Zip Codes with the Highest Percentage of Population with a Degree in Arts and Humanities in Kentucky
0.0%
100.0%
Zip Codes with the Highest Percentage of Population with a Degree in Arts and Humanities in Kentucky
| Zip Code | % Graduates | vs State | vs National | |
| 1. | 40915 | 100.0% | 7.5%(+92.5)#1 | 6.0%(+94.0)#8 |
| 2. | 40140 | 100.0% | 7.5%(+92.5)#2 | 6.0%(+94.0)#13 |
| 3. | 40958 | 100.0% | 7.5%(+92.5)#3 | 6.0%(+94.0)#15 |
| 4. | 41606 | 100.0% | 7.5%(+92.5)#4 | 6.0%(+94.0)#20 |
| 5. | 41772 | 100.0% | 7.5%(+92.5)#5 | 6.0%(+94.0)#29 |
| 6. | 41660 | 100.0% | 7.5%(+92.5)#6 | 6.0%(+94.0)#31 |
| 7. | 40036 | 100.0% | 7.5%(+92.5)#7 | 6.0%(+94.0)#39 |
| 8. | 42032 | 89.3% | 7.5%(+81.8)#8 | 6.0%(+83.3)#85 |
| 9. | 41159 | 75.0% | 7.5%(+67.5)#9 | 6.0%(+69.0)#107 |
| 10. | 40176 | 65.6% | 7.5%(+58.0)#10 | 6.0%(+59.6)#139 |
| 11. | 41834 | 58.5% | 7.5%(+51.0)#11 | 6.0%(+52.5)#163 |
| 12. | 41817 | 50.0% | 7.5%(+42.5)#12 | 6.0%(+44.0)#209 |
| 13. | 40983 | 50.0% | 7.5%(+42.5)#13 | 6.0%(+44.0)#219 |
| 14. | 41317 | 47.8% | 7.5%(+40.3)#14 | 6.0%(+41.8)#250 |
| 15. | 41539 | 46.0% | 7.5%(+38.5)#15 | 6.0%(+40.0)#269 |
| 16. | 41268 | 43.9% | 7.5%(+36.4)#16 | 6.0%(+37.9)#290 |
| 17. | 41777 | 41.7% | 7.5%(+34.2)#17 | 6.0%(+35.7)#317 |
| 18. | 41568 | 41.3% | 7.5%(+33.8)#18 | 6.0%(+35.3)#326 |
| 19. | 40052 | 41.2% | 7.5%(+33.7)#19 | 6.0%(+35.2)#328 |
| 20. | 42254 | 40.0% | 7.5%(+32.5)#20 | 6.0%(+34.0)#345 |
| 21. | 41332 | 38.6% | 7.5%(+31.1)#21 | 6.0%(+32.6)#370 |
| 22. | 41774 | 37.9% | 7.5%(+30.4)#22 | 6.0%(+31.9)#398 |
| 23. | 42048 | 37.7% | 7.5%(+30.2)#23 | 6.0%(+31.7)#402 |
| 24. | 42764 | 37.1% | 7.5%(+29.6)#24 | 6.0%(+31.1)#417 |
| 25. | 41642 | 36.4% | 7.5%(+28.9)#25 | 6.0%(+30.4)#436 |
| 26. | 41666 | 36.4% | 7.5%(+28.9)#26 | 6.0%(+30.4)#437 |
| 27. | 40737 | 36.2% | 7.5%(+28.7)#27 | 6.0%(+30.2)#442 |
| 28. | 41168 | 36.2% | 7.5%(+28.7)#28 | 6.0%(+30.2)#445 |
| 29. | 40358 | 33.3% | 7.5%(+25.8)#29 | 6.0%(+27.3)#512 |
| 30. | 42035 | 33.0% | 7.5%(+25.5)#30 | 6.0%(+27.0)#543 |
| 31. | 42436 | 32.6% | 7.5%(+25.1)#31 | 6.0%(+26.6)#554 |
| 32. | 42741 | 32.3% | 7.5%(+24.8)#32 | 6.0%(+26.3)#566 |
| 33. | 41562 | 31.4% | 7.5%(+23.9)#33 | 6.0%(+25.4)#604 |
| 34. | 40862 | 31.3% | 7.5%(+23.8)#34 | 6.0%(+25.3)#611 |
| 35. | 41171 | 30.2% | 7.5%(+22.7)#35 | 6.0%(+24.2)#652 |
| 36. | 41635 | 30.1% | 7.5%(+22.6)#36 | 6.0%(+24.1)#654 |
| 37. | 41731 | 29.7% | 7.5%(+22.2)#37 | 6.0%(+23.7)#673 |
| 38. | 42740 | 29.0% | 7.5%(+21.5)#38 | 6.0%(+23.0)#706 |
| 39. | 41045 | 29.0% | 7.5%(+21.5)#39 | 6.0%(+23.0)#707 |
| 40. | 41558 | 28.6% | 7.5%(+21.1)#40 | 6.0%(+22.6)#721 |
| 41. | 41180 | 28.6% | 7.5%(+21.1)#41 | 6.0%(+22.6)#722 |
| 42. | 42441 | 27.2% | 7.5%(+19.7)#42 | 6.0%(+21.2)#808 |
| 43. | 40117 | 27.2% | 7.5%(+19.7)#43 | 6.0%(+21.2)#811 |
| 44. | 40115 | 25.6% | 7.5%(+18.1)#44 | 6.0%(+19.6)#910 |
| 45. | 42215 | 25.4% | 7.5%(+17.9)#45 | 6.0%(+19.4)#920 |
| 46. | 40312 | 25.4% | 7.5%(+17.9)#46 | 6.0%(+19.4)#924 |
| 47. | 42223 | 25.3% | 7.5%(+17.8)#47 | 6.0%(+19.3)#931 |
| 48. | 41046 | 25.2% | 7.5%(+17.7)#48 | 6.0%(+19.2)#936 |
| 49. | 42782 | 25.0% | 7.5%(+17.5)#49 | 6.0%(+19.0)#952 |
| 50. | 41844 | 23.7% | 7.5%(+16.2)#50 | 6.0%(+17.7)#1,056 |
| 51. | 40972 | 23.4% | 7.5%(+15.9)#51 | 6.0%(+17.4)#1,082 |
| 52. | 40460 | 23.2% | 7.5%(+15.7)#52 | 6.0%(+17.2)#1,097 |
| 53. | 41204 | 23.2% | 7.5%(+15.7)#53 | 6.0%(+17.2)#1,101 |
| 54. | 40211 | 23.1% | 7.5%(+15.6)#54 | 6.0%(+17.1)#1,104 |
| 55. | 41311 | 22.8% | 7.5%(+15.3)#55 | 6.0%(+16.8)#1,130 |
| 56. | 42713 | 22.8% | 7.5%(+15.3)#56 | 6.0%(+16.8)#1,131 |
| 57. | 40177 | 22.7% | 7.5%(+15.2)#57 | 6.0%(+16.7)#1,146 |
| 58. | 41630 | 22.4% | 7.5%(+14.9)#58 | 6.0%(+16.4)#1,174 |
| 59. | 40447 | 21.8% | 7.5%(+14.3)#59 | 6.0%(+15.8)#1,252 |
| 60. | 41016 | 21.2% | 7.5%(+13.7)#60 | 6.0%(+15.2)#1,331 |
| 61. | 40854 | 20.9% | 7.5%(+13.4)#61 | 6.0%(+14.9)#1,355 |
| 62. | 40873 | 20.8% | 7.5%(+13.3)#62 | 6.0%(+14.8)#1,376 |
| 63. | 42784 | 20.8% | 7.5%(+13.3)#63 | 6.0%(+14.8)#1,379 |
| 64. | 42653 | 20.7% | 7.5%(+13.2)#64 | 6.0%(+14.7)#1,394 |
| 65. | 42712 | 20.6% | 7.5%(+13.1)#65 | 6.0%(+14.6)#1,402 |
| 66. | 40310 | 20.4% | 7.5%(+12.9)#66 | 6.0%(+14.4)#1,426 |
| 67. | 40828 | 20.3% | 7.5%(+12.8)#67 | 6.0%(+14.3)#1,444 |
| 68. | 42324 | 20.3% | 7.5%(+12.8)#68 | 6.0%(+14.3)#1,445 |
| 69. | 42776 | 19.7% | 7.5%(+12.2)#69 | 6.0%(+13.7)#1,538 |
| 70. | 40121 | 19.6% | 7.5%(+12.1)#70 | 6.0%(+13.6)#1,547 |
| 71. | 41064 | 19.5% | 7.5%(+12.0)#71 | 6.0%(+13.5)#1,571 |
| 72. | 42085 | 19.4% | 7.5%(+11.8)#72 | 6.0%(+13.4)#1,595 |
| 73. | 42458 | 19.3% | 7.5%(+11.8)#73 | 6.0%(+13.3)#1,614 |
| 74. | 42565 | 18.9% | 7.5%(+11.4)#74 | 6.0%(+12.9)#1,664 |
| 75. | 41085 | 18.9% | 7.5%(+11.4)#75 | 6.0%(+12.9)#1,672 |
| 76. | 42462 | 18.8% | 7.5%(+11.3)#76 | 6.0%(+12.8)#1,681 |
| 77. | 40461 | 18.8% | 7.5%(+11.2)#77 | 6.0%(+12.8)#1,685 |
| 78. | 40913 | 18.6% | 7.5%(+11.1)#78 | 6.0%(+12.6)#1,711 |
| 79. | 41831 | 18.4% | 7.5%(+10.9)#79 | 6.0%(+12.4)#1,747 |
| 80. | 42519 | 18.4% | 7.5%(+10.9)#80 | 6.0%(+12.4)#1,752 |
| 81. | 40210 | 18.3% | 7.5%(+10.8)#81 | 6.0%(+12.4)#1,765 |
| 82. | 41219 | 18.3% | 7.5%(+10.8)#82 | 6.0%(+12.3)#1,768 |
| 83. | 42455 | 18.3% | 7.5%(+10.8)#83 | 6.0%(+12.3)#1,780 |
| 84. | 41601 | 18.3% | 7.5%(+10.8)#84 | 6.0%(+12.3)#1,781 |
| 85. | 42140 | 18.1% | 7.5%(+10.6)#85 | 6.0%(+12.1)#1,821 |
| 86. | 42553 | 18.0% | 7.5%(+10.5)#86 | 6.0%(+12.0)#1,843 |
| 87. | 42041 | 17.7% | 7.5%(+10.2)#87 | 6.0%(+11.7)#1,914 |
| 88. | 42716 | 17.6% | 7.5%(+10.1)#88 | 6.0%(+11.6)#1,944 |
| 89. | 41840 | 17.3% | 7.5%(+9.83)#89 | 6.0%(+11.3)#2,002 |
| 90. | 41749 | 17.3% | 7.5%(+9.82)#90 | 6.0%(+11.3)#2,004 |
| 91. | 42461 | 17.1% | 7.5%(+9.64)#91 | 6.0%(+11.1)#2,049 |
| 92. | 40445 | 16.9% | 7.5%(+9.39)#92 | 6.0%(+10.9)#2,096 |
| 93. | 40927 | 16.9% | 7.5%(+9.38)#93 | 6.0%(+10.9)#2,097 |
| 94. | 40977 | 16.7% | 7.5%(+9.18)#94 | 6.0%(+10.7)#2,141 |
| 95. | 41143 | 16.6% | 7.5%(+9.11)#95 | 6.0%(+10.6)#2,189 |
| 96. | 41339 | 16.6% | 7.5%(+9.09)#96 | 6.0%(+10.6)#2,195 |
| 97. | 41183 | 16.3% | 7.5%(+8.82)#97 | 6.0%(+10.3)#2,257 |
| 98. | 41035 | 16.2% | 7.5%(+8.72)#98 | 6.0%(+10.2)#2,282 |
| 99. | 41041 | 16.2% | 7.5%(+8.66)#99 | 6.0%(+10.2)#2,299 |
| 100. | 42053 | 16.1% | 7.5%(+8.63)#100 | 6.0%(+10.1)#2,305 |
Common Questions
What are the Top 10 Zip Codes with the Highest Percentage of Population with a Degree in Arts and Humanities in Kentucky?
Top 10 Zip Codes with the Highest Percentage of Population with a Degree in Arts and Humanities in Kentucky are:
What zip code has the Highest Percentage of Population with a Degree in Arts and Humanities in Kentucky?
40915 has the Highest Percentage of Population with a Degree in Arts and Humanities in Kentucky with 100.0%.
What is the Percentage of Population with a Degree in Arts and Humanities in the State of Kentucky?
Percentage of Population with a Degree in Arts and Humanities in Kentucky is 7.5%.
What is the Percentage of Population with a Degree in Arts and Humanities in the United States?
Percentage of Population with a Degree in Arts and Humanities in the United States is 6.0%.