Zip Codes with the Highest Percentage of Population Employed in Computer, Engineering & Science in Kentucky
RELATED REPORTS & OPTIONS
Computer, Engineering & Science
Kentucky
Compare Zip Codes
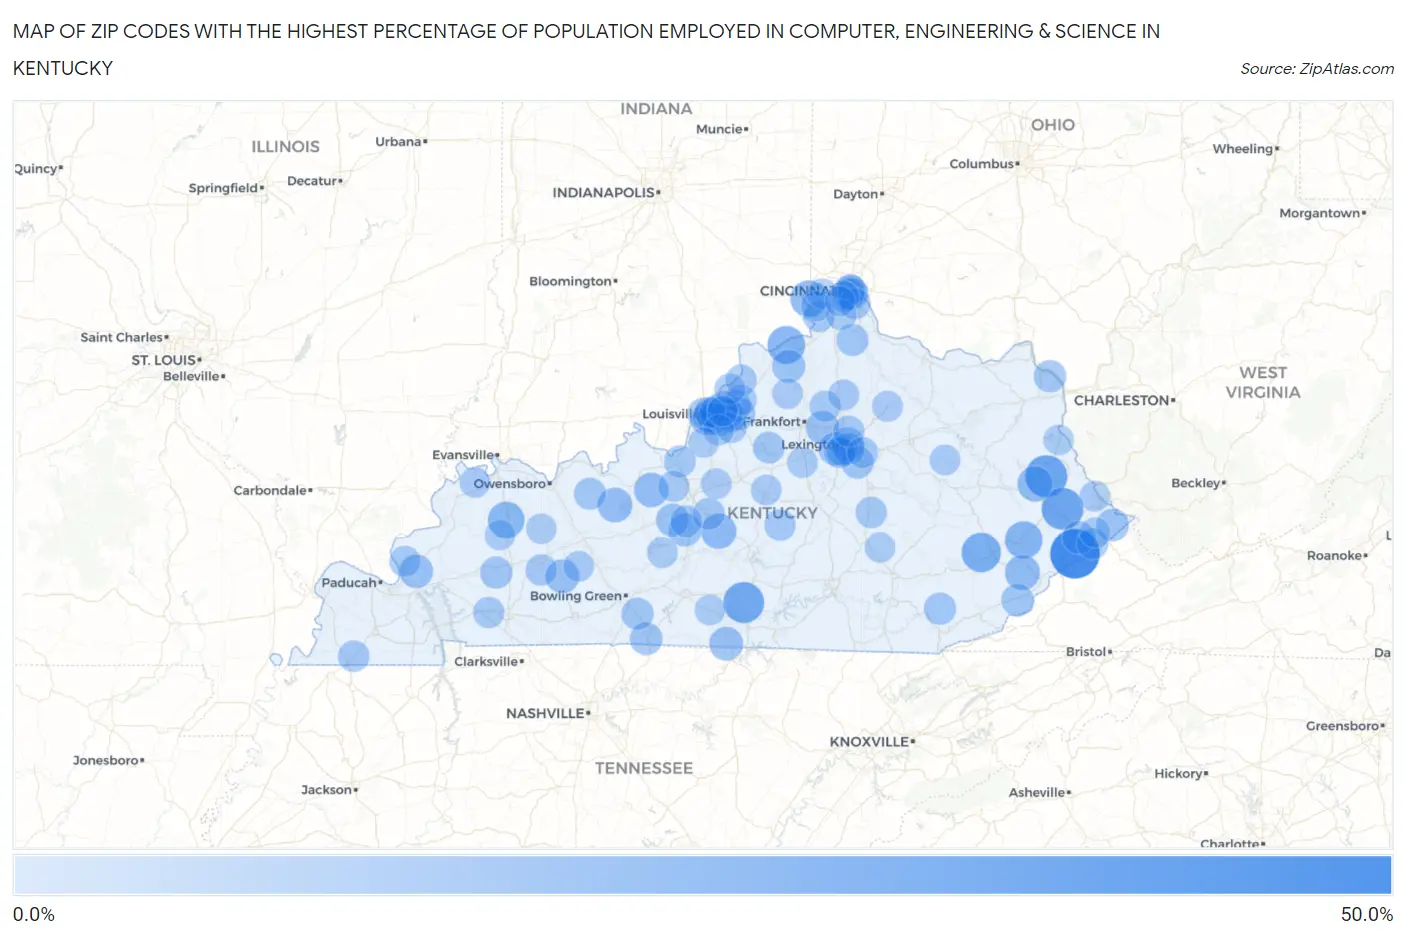
Map of Zip Codes with the Highest Percentage of Population Employed in Computer, Engineering & Science in Kentucky
0.0%
50.0%
Zip Codes with the Highest Percentage of Population Employed in Computer, Engineering & Science in Kentucky
| Zip Code | % Employed | vs State | vs National | |
| 1. | 41534 | 40.7% | 4.6%(+36.1)#1 | 6.8%(+34.0)#77 |
| 2. | 41260 | 27.0% | 4.6%(+22.3)#2 | 6.8%(+20.2)#230 |
| 3. | 41659 | 26.6% | 4.6%(+21.9)#3 | 6.8%(+19.8)#241 |
| 4. | 42715 | 25.0% | 4.6%(+20.4)#4 | 6.8%(+18.2)#276 |
| 5. | 41754 | 22.1% | 4.6%(+17.5)#5 | 6.8%(+15.4)#383 |
| 6. | 41045 | 19.4% | 4.6%(+14.7)#6 | 6.8%(+12.6)#565 |
| 7. | 41831 | 18.9% | 4.6%(+14.2)#7 | 6.8%(+12.1)#606 |
| 8. | 41080 | 17.4% | 4.6%(+12.7)#8 | 6.8%(+10.6)#765 |
| 9. | 42456 | 17.3% | 4.6%(+12.6)#9 | 6.8%(+10.5)#784 |
| 10. | 42764 | 15.0% | 4.6%(+10.4)#10 | 6.8%(+8.24)#1,121 |
| 11. | 41222 | 14.6% | 4.6%(+9.98)#11 | 6.8%(+7.85)#1,194 |
| 12. | 41832 | 14.5% | 4.6%(+9.86)#12 | 6.8%(+7.73)#1,227 |
| 13. | 40119 | 14.0% | 4.6%(+9.35)#13 | 6.8%(+7.21)#1,343 |
| 14. | 40115 | 13.8% | 4.6%(+9.16)#14 | 6.8%(+7.03)#1,402 |
| 15. | 42324 | 12.7% | 4.6%(+8.04)#15 | 6.8%(+5.91)#1,758 |
| 16. | 42151 | 12.3% | 4.6%(+7.69)#16 | 6.8%(+5.55)#1,886 |
| 17. | 42083 | 12.1% | 4.6%(+7.43)#17 | 6.8%(+5.29)#2,012 |
| 18. | 40347 | 11.5% | 4.6%(+6.83)#18 | 6.8%(+4.69)#2,323 |
| 19. | 40222 | 11.4% | 4.6%(+6.79)#19 | 6.8%(+4.66)#2,344 |
| 20. | 41098 | 11.3% | 4.6%(+6.67)#20 | 6.8%(+4.54)#2,407 |
| 21. | 40513 | 11.3% | 4.6%(+6.67)#21 | 6.8%(+4.54)#2,409 |
| 22. | 40507 | 11.2% | 4.6%(+6.54)#22 | 6.8%(+4.40)#2,477 |
| 23. | 42784 | 11.1% | 4.6%(+6.46)#23 | 6.8%(+4.33)#2,518 |
| 24. | 42788 | 10.8% | 4.6%(+6.18)#24 | 6.8%(+4.05)#2,673 |
| 25. | 40245 | 10.7% | 4.6%(+6.08)#25 | 6.8%(+3.94)#2,724 |
| 26. | 41562 | 10.6% | 4.6%(+6.02)#26 | 6.8%(+3.88)#2,763 |
| 27. | 41553 | 10.5% | 4.6%(+5.84)#27 | 6.8%(+3.70)#2,888 |
| 28. | 42120 | 10.2% | 4.6%(+5.61)#28 | 6.8%(+3.47)#3,040 |
| 29. | 40220 | 9.9% | 4.6%(+5.28)#29 | 6.8%(+3.14)#3,298 |
| 30. | 41169 | 9.9% | 4.6%(+5.22)#30 | 6.8%(+3.09)#3,326 |
| 31. | 40515 | 9.8% | 4.6%(+5.20)#31 | 6.8%(+3.07)#3,345 |
| 32. | 40243 | 9.7% | 4.6%(+5.06)#32 | 6.8%(+2.93)#3,450 |
| 33. | 40823 | 9.7% | 4.6%(+5.05)#33 | 6.8%(+2.92)#3,454 |
| 34. | 42453 | 9.6% | 4.6%(+4.99)#34 | 6.8%(+2.85)#3,513 |
| 35. | 42122 | 9.6% | 4.6%(+4.93)#35 | 6.8%(+2.80)#3,552 |
| 36. | 40935 | 9.6% | 4.6%(+4.93)#36 | 6.8%(+2.79)#3,553 |
| 37. | 41074 | 9.4% | 4.6%(+4.77)#37 | 6.8%(+2.64)#3,687 |
| 38. | 40202 | 9.4% | 4.6%(+4.76)#38 | 6.8%(+2.62)#3,695 |
| 39. | 40056 | 9.4% | 4.6%(+4.74)#39 | 6.8%(+2.60)#3,716 |
| 40. | 40217 | 9.3% | 4.6%(+4.71)#40 | 6.8%(+2.57)#3,750 |
| 41. | 42748 | 9.2% | 4.6%(+4.59)#41 | 6.8%(+2.46)#3,843 |
| 42. | 42368 | 9.2% | 4.6%(+4.54)#42 | 6.8%(+2.41)#3,893 |
| 43. | 40502 | 9.2% | 4.6%(+4.53)#43 | 6.8%(+2.39)#3,912 |
| 44. | 41033 | 9.1% | 4.6%(+4.45)#44 | 6.8%(+2.32)#3,990 |
| 45. | 40204 | 9.0% | 4.6%(+4.38)#45 | 6.8%(+2.25)#4,053 |
| 46. | 41075 | 8.8% | 4.6%(+4.22)#46 | 6.8%(+2.08)#4,215 |
| 47. | 40046 | 8.8% | 4.6%(+4.17)#47 | 6.8%(+2.04)#4,263 |
| 48. | 40207 | 8.7% | 4.6%(+4.11)#48 | 6.8%(+1.97)#4,320 |
| 49. | 40121 | 8.7% | 4.6%(+4.06)#49 | 6.8%(+1.93)#4,382 |
| 50. | 40205 | 8.6% | 4.6%(+3.92)#50 | 6.8%(+1.79)#4,547 |
| 51. | 40503 | 8.6% | 4.6%(+3.92)#51 | 6.8%(+1.79)#4,551 |
| 52. | 41091 | 8.5% | 4.6%(+3.88)#52 | 6.8%(+1.74)#4,595 |
| 53. | 42345 | 8.3% | 4.6%(+3.69)#53 | 6.8%(+1.55)#4,834 |
| 54. | 42041 | 8.3% | 4.6%(+3.67)#54 | 6.8%(+1.53)#4,866 |
| 55. | 40404 | 8.3% | 4.6%(+3.66)#55 | 6.8%(+1.52)#4,881 |
| 56. | 42776 | 8.3% | 4.6%(+3.65)#56 | 6.8%(+1.52)#4,897 |
| 57. | 40009 | 8.1% | 4.6%(+3.50)#57 | 6.8%(+1.37)#5,083 |
| 58. | 41071 | 8.1% | 4.6%(+3.48)#58 | 6.8%(+1.34)#5,121 |
| 59. | 40514 | 8.1% | 4.6%(+3.47)#59 | 6.8%(+1.33)#5,135 |
| 60. | 41513 | 8.1% | 4.6%(+3.44)#60 | 6.8%(+1.31)#5,174 |
| 61. | 40223 | 7.9% | 4.6%(+3.29)#61 | 6.8%(+1.16)#5,379 |
| 62. | 41073 | 7.9% | 4.6%(+3.28)#62 | 6.8%(+1.15)#5,393 |
| 63. | 42232 | 7.9% | 4.6%(+3.28)#63 | 6.8%(+1.15)#5,395 |
| 64. | 40511 | 7.9% | 4.6%(+3.26)#64 | 6.8%(+1.13)#5,416 |
| 65. | 41076 | 7.7% | 4.6%(+3.05)#65 | 6.8%(+0.913)#5,710 |
| 66. | 40162 | 7.6% | 4.6%(+3.00)#66 | 6.8%(+0.867)#5,788 |
| 67. | 40509 | 7.6% | 4.6%(+2.97)#67 | 6.8%(+0.834)#5,833 |
| 68. | 40379 | 7.6% | 4.6%(+2.96)#68 | 6.8%(+0.830)#5,838 |
| 69. | 40241 | 7.6% | 4.6%(+2.94)#69 | 6.8%(+0.806)#5,884 |
| 70. | 40077 | 7.5% | 4.6%(+2.86)#70 | 6.8%(+0.728)#6,004 |
| 71. | 40206 | 7.5% | 4.6%(+2.82)#71 | 6.8%(+0.686)#6,073 |
| 72. | 40299 | 7.4% | 4.6%(+2.80)#72 | 6.8%(+0.665)#6,112 |
| 73. | 42081 | 7.4% | 4.6%(+2.75)#73 | 6.8%(+0.619)#6,206 |
| 74. | 40370 | 7.4% | 4.6%(+2.74)#74 | 6.8%(+0.603)#6,224 |
| 75. | 41011 | 7.3% | 4.6%(+2.68)#75 | 6.8%(+0.542)#6,299 |
| 76. | 40228 | 7.2% | 4.6%(+2.62)#76 | 6.8%(+0.483)#6,384 |
| 77. | 41514 | 7.2% | 4.6%(+2.54)#77 | 6.8%(+0.408)#6,498 |
| 78. | 40348 | 7.2% | 4.6%(+2.54)#78 | 6.8%(+0.405)#6,503 |
| 79. | 42729 | 7.1% | 4.6%(+2.50)#79 | 6.8%(+0.364)#6,584 |
| 80. | 40014 | 7.1% | 4.6%(+2.44)#80 | 6.8%(+0.301)#6,690 |
| 81. | 40026 | 7.0% | 4.6%(+2.39)#81 | 6.8%(+0.255)#6,763 |
| 82. | 40372 | 7.0% | 4.6%(+2.39)#82 | 6.8%(+0.253)#6,764 |
| 83. | 40107 | 6.9% | 4.6%(+2.28)#83 | 6.8%(+0.145)#6,951 |
| 84. | 40057 | 6.9% | 4.6%(+2.26)#84 | 6.8%(+0.126)#6,989 |
| 85. | 42273 | 6.9% | 4.6%(+2.25)#85 | 6.8%(+0.116)#7,009 |
| 86. | 40322 | 6.9% | 4.6%(+2.24)#86 | 6.8%(+0.109)#7,021 |
| 87. | 42406 | 6.7% | 4.6%(+2.10)#87 | 6.8%(-0.033)#7,290 |
| 88. | 40069 | 6.7% | 4.6%(+2.08)#88 | 6.8%(-0.051)#7,323 |
| 89. | 40242 | 6.7% | 4.6%(+2.04)#89 | 6.8%(-0.099)#7,423 |
| 90. | 40445 | 6.6% | 4.6%(+1.96)#90 | 6.8%(-0.171)#7,551 |
| 91. | 40109 | 6.6% | 4.6%(+1.96)#91 | 6.8%(-0.178)#7,557 |
| 92. | 42166 | 6.6% | 4.6%(+1.94)#92 | 6.8%(-0.194)#7,592 |
| 93. | 42350 | 6.5% | 4.6%(+1.87)#93 | 6.8%(-0.269)#7,742 |
| 94. | 41048 | 6.5% | 4.6%(+1.86)#94 | 6.8%(-0.271)#7,750 |
| 95. | 41051 | 6.5% | 4.6%(+1.83)#95 | 6.8%(-0.300)#7,808 |
| 96. | 41230 | 6.4% | 4.6%(+1.80)#96 | 6.8%(-0.331)#7,866 |
| 97. | 42436 | 6.4% | 4.6%(+1.78)#97 | 6.8%(-0.356)#7,919 |
| 98. | 41005 | 6.4% | 4.6%(+1.75)#98 | 6.8%(-0.383)#7,957 |
| 99. | 41554 | 6.4% | 4.6%(+1.73)#99 | 6.8%(-0.401)#8,004 |
| 100. | 41017 | 6.3% | 4.6%(+1.66)#100 | 6.8%(-0.479)#8,162 |
Common Questions
What are the Top 10 Zip Codes with the Highest Percentage of Population Employed in Computer, Engineering & Science in Kentucky?
Top 10 Zip Codes with the Highest Percentage of Population Employed in Computer, Engineering & Science in Kentucky are:
What zip code has the Highest Percentage of Population Employed in Computer, Engineering & Science in Kentucky?
41534 has the Highest Percentage of Population Employed in Computer, Engineering & Science in Kentucky with 40.7%.
What is the Percentage of Population Employed in Computer, Engineering & Science in the State of Kentucky?
Percentage of Population Employed in Computer, Engineering & Science in Kentucky is 4.6%.
What is the Percentage of Population Employed in Computer, Engineering & Science in the United States?
Percentage of Population Employed in Computer, Engineering & Science in the United States is 6.8%.