Zip Codes with the Highest Percentage of Population Employed in Education Instruction & Library in Kentucky
RELATED REPORTS & OPTIONS
Education Instruction & Library
Kentucky
Compare Zip Codes
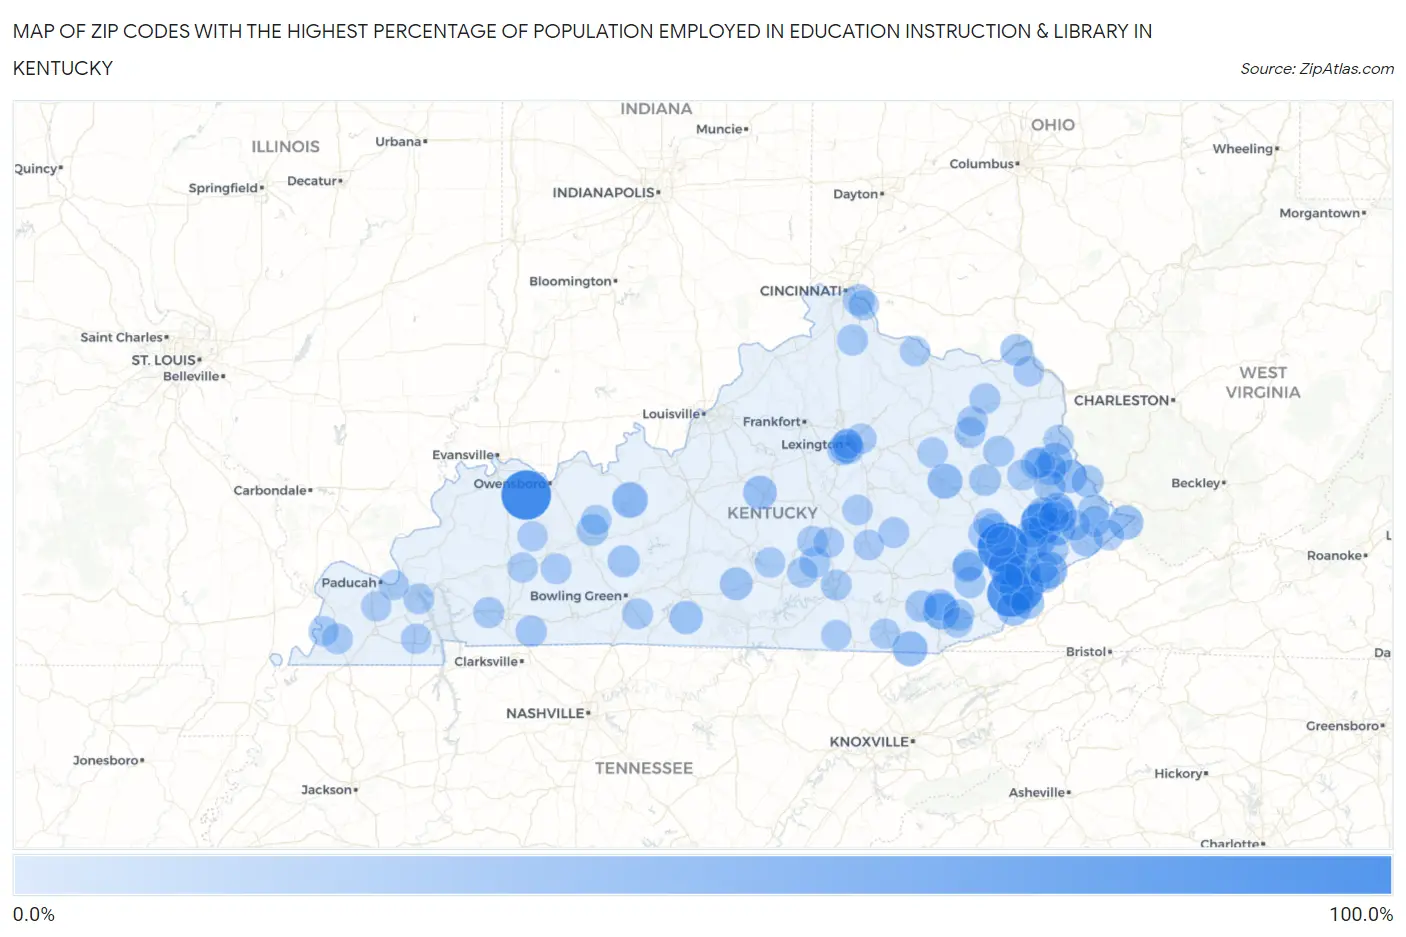
Map of Zip Codes with the Highest Percentage of Population Employed in Education Instruction & Library in Kentucky
0.0%
100.0%
Zip Codes with the Highest Percentage of Population Employed in Education Instruction & Library in Kentucky
| Zip Code | % Employed | vs State | vs National | |
| 1. | 42356 | 100.0% | 6.0%(+94.0)#1 | 6.2%(+93.8)#2 |
| 2. | 41739 | 100.0% | 6.0%(+94.0)#2 | 6.2%(+93.8)#14 |
| 3. | 41819 | 81.6% | 6.0%(+75.6)#3 | 6.2%(+75.4)#20 |
| 4. | 41833 | 73.3% | 6.0%(+67.4)#4 | 6.2%(+67.1)#25 |
| 5. | 41760 | 47.0% | 6.0%(+41.1)#5 | 6.2%(+40.8)#90 |
| 6. | 41849 | 40.5% | 6.0%(+34.5)#6 | 6.2%(+34.3)#129 |
| 7. | 41861 | 40.0% | 6.0%(+34.0)#7 | 6.2%(+33.8)#130 |
| 8. | 40997 | 38.6% | 6.0%(+32.7)#8 | 6.2%(+32.4)#141 |
| 9. | 41645 | 38.3% | 6.0%(+32.3)#9 | 6.2%(+32.1)#144 |
| 10. | 41832 | 37.7% | 6.0%(+31.7)#10 | 6.2%(+31.5)#149 |
| 11. | 41631 | 35.4% | 6.0%(+29.4)#11 | 6.2%(+29.2)#176 |
| 12. | 41605 | 35.3% | 6.0%(+29.4)#12 | 6.2%(+29.1)#178 |
| 13. | 41622 | 34.8% | 6.0%(+28.8)#13 | 6.2%(+28.6)#187 |
| 14. | 40178 | 34.5% | 6.0%(+28.5)#14 | 6.2%(+28.3)#192 |
| 15. | 41360 | 31.6% | 6.0%(+25.7)#15 | 6.2%(+25.5)#238 |
| 16. | 40940 | 31.6% | 6.0%(+25.6)#16 | 6.2%(+25.4)#239 |
| 17. | 41568 | 28.7% | 6.0%(+22.8)#17 | 6.2%(+22.5)#279 |
| 18. | 41264 | 27.7% | 6.0%(+21.7)#18 | 6.2%(+21.5)#303 |
| 19. | 40927 | 27.2% | 6.0%(+21.2)#19 | 6.2%(+21.0)#310 |
| 20. | 40061 | 25.9% | 6.0%(+19.9)#20 | 6.2%(+19.7)#344 |
| 21. | 41224 | 25.2% | 6.0%(+19.2)#21 | 6.2%(+19.0)#356 |
| 22. | 40855 | 23.8% | 6.0%(+17.9)#22 | 6.2%(+17.6)#419 |
| 23. | 41651 | 23.5% | 6.0%(+17.6)#23 | 6.2%(+17.3)#434 |
| 24. | 42131 | 23.3% | 6.0%(+17.4)#24 | 6.2%(+17.1)#448 |
| 25. | 41254 | 22.5% | 6.0%(+16.6)#25 | 6.2%(+16.4)#491 |
| 26. | 40526 | 21.7% | 6.0%(+15.7)#26 | 6.2%(+15.5)#527 |
| 27. | 42742 | 21.2% | 6.0%(+15.2)#27 | 6.2%(+15.0)#562 |
| 28. | 41559 | 20.8% | 6.0%(+14.9)#28 | 6.2%(+14.6)#580 |
| 29. | 41642 | 19.9% | 6.0%(+13.9)#29 | 6.2%(+13.7)#662 |
| 30. | 41231 | 19.6% | 6.0%(+13.6)#30 | 6.2%(+13.4)#682 |
| 31. | 42275 | 18.1% | 6.0%(+12.2)#31 | 6.2%(+12.0)#821 |
| 32. | 41844 | 17.3% | 6.0%(+11.4)#32 | 6.2%(+11.2)#909 |
| 33. | 42370 | 17.0% | 6.0%(+11.1)#33 | 6.2%(+10.8)#941 |
| 34. | 40923 | 16.9% | 6.0%(+10.9)#34 | 6.2%(+10.7)#962 |
| 35. | 41408 | 16.9% | 6.0%(+10.9)#35 | 6.2%(+10.7)#963 |
| 36. | 41174 | 16.8% | 6.0%(+10.9)#36 | 6.2%(+10.6)#971 |
| 37. | 41265 | 16.7% | 6.0%(+10.8)#37 | 6.2%(+10.6)#983 |
| 38. | 40982 | 16.7% | 6.0%(+10.7)#38 | 6.2%(+10.5)#996 |
| 39. | 41085 | 16.1% | 6.0%(+10.2)#39 | 6.2%(+9.96)#1,075 |
| 40. | 41855 | 16.1% | 6.0%(+10.2)#40 | 6.2%(+9.93)#1,083 |
| 41. | 40868 | 14.7% | 6.0%(+8.73)#41 | 6.2%(+8.50)#1,349 |
| 42. | 42286 | 14.6% | 6.0%(+8.67)#42 | 6.2%(+8.44)#1,356 |
| 43. | 41519 | 14.4% | 6.0%(+8.41)#43 | 6.2%(+8.18)#1,427 |
| 44. | 40988 | 14.3% | 6.0%(+8.33)#44 | 6.2%(+8.10)#1,452 |
| 45. | 41421 | 14.0% | 6.0%(+8.02)#45 | 6.2%(+7.80)#1,544 |
| 46. | 41348 | 13.8% | 6.0%(+7.85)#46 | 6.2%(+7.62)#1,605 |
| 47. | 41255 | 13.7% | 6.0%(+7.75)#47 | 6.2%(+7.52)#1,641 |
| 48. | 42232 | 13.6% | 6.0%(+7.65)#48 | 6.2%(+7.42)#1,674 |
| 49. | 41667 | 13.5% | 6.0%(+7.57)#49 | 6.2%(+7.34)#1,702 |
| 50. | 41033 | 13.5% | 6.0%(+7.50)#50 | 6.2%(+7.27)#1,724 |
| 51. | 41135 | 13.3% | 6.0%(+7.38)#51 | 6.2%(+7.15)#1,776 |
| 52. | 41257 | 13.3% | 6.0%(+7.32)#52 | 6.2%(+7.10)#1,790 |
| 53. | 40313 | 13.1% | 6.0%(+7.15)#53 | 6.2%(+6.92)#1,862 |
| 54. | 41317 | 13.1% | 6.0%(+7.14)#54 | 6.2%(+6.91)#1,866 |
| 55. | 41749 | 13.1% | 6.0%(+7.13)#55 | 6.2%(+6.90)#1,869 |
| 56. | 41649 | 13.0% | 6.0%(+7.06)#56 | 6.2%(+6.83)#1,897 |
| 57. | 42122 | 12.8% | 6.0%(+6.79)#57 | 6.2%(+6.57)#1,995 |
| 58. | 41731 | 12.7% | 6.0%(+6.77)#58 | 6.2%(+6.54)#2,004 |
| 59. | 42516 | 12.7% | 6.0%(+6.77)#59 | 6.2%(+6.54)#2,005 |
| 60. | 42533 | 12.7% | 6.0%(+6.75)#60 | 6.2%(+6.52)#2,021 |
| 61. | 41839 | 12.6% | 6.0%(+6.66)#61 | 6.2%(+6.43)#2,068 |
| 62. | 41539 | 12.6% | 6.0%(+6.64)#62 | 6.2%(+6.41)#2,072 |
| 63. | 41339 | 12.6% | 6.0%(+6.62)#63 | 6.2%(+6.40)#2,082 |
| 64. | 42044 | 12.6% | 6.0%(+6.60)#64 | 6.2%(+6.37)#2,091 |
| 65. | 40481 | 12.5% | 6.0%(+6.54)#65 | 6.2%(+6.32)#2,124 |
| 66. | 40502 | 12.5% | 6.0%(+6.51)#66 | 6.2%(+6.28)#2,146 |
| 67. | 42541 | 12.4% | 6.0%(+6.42)#67 | 6.2%(+6.20)#2,183 |
| 68. | 41712 | 12.3% | 6.0%(+6.39)#68 | 6.2%(+6.16)#2,210 |
| 69. | 42321 | 12.2% | 6.0%(+6.24)#69 | 6.2%(+6.01)#2,286 |
| 70. | 41766 | 12.0% | 6.0%(+6.09)#70 | 6.2%(+5.86)#2,359 |
| 71. | 40503 | 11.9% | 6.0%(+5.97)#71 | 6.2%(+5.74)#2,424 |
| 72. | 41566 | 11.9% | 6.0%(+5.93)#72 | 6.2%(+5.70)#2,453 |
| 73. | 41238 | 11.9% | 6.0%(+5.90)#73 | 6.2%(+5.67)#2,470 |
| 74. | 42565 | 11.8% | 6.0%(+5.88)#74 | 6.2%(+5.66)#2,480 |
| 75. | 41144 | 11.7% | 6.0%(+5.76)#75 | 6.2%(+5.54)#2,555 |
| 76. | 42031 | 11.7% | 6.0%(+5.75)#76 | 6.2%(+5.53)#2,565 |
| 77. | 41501 | 11.7% | 6.0%(+5.73)#77 | 6.2%(+5.51)#2,578 |
| 78. | 40516 | 11.7% | 6.0%(+5.71)#78 | 6.2%(+5.48)#2,595 |
| 79. | 40351 | 11.5% | 6.0%(+5.51)#79 | 6.2%(+5.29)#2,725 |
| 80. | 40489 | 11.4% | 6.0%(+5.43)#80 | 6.2%(+5.20)#2,799 |
| 81. | 40456 | 11.3% | 6.0%(+5.31)#81 | 6.2%(+5.08)#2,878 |
| 82. | 42020 | 11.2% | 6.0%(+5.23)#82 | 6.2%(+5.00)#2,926 |
| 83. | 40346 | 11.0% | 6.0%(+5.02)#83 | 6.2%(+4.79)#3,072 |
| 84. | 40845 | 10.9% | 6.0%(+4.98)#84 | 6.2%(+4.75)#3,106 |
| 85. | 40461 | 10.9% | 6.0%(+4.94)#85 | 6.2%(+4.71)#3,140 |
| 86. | 42464 | 10.8% | 6.0%(+4.86)#86 | 6.2%(+4.64)#3,191 |
| 87. | 40508 | 10.7% | 6.0%(+4.79)#87 | 6.2%(+4.56)#3,243 |
| 88. | 42032 | 10.7% | 6.0%(+4.71)#88 | 6.2%(+4.48)#3,306 |
| 89. | 41230 | 10.7% | 6.0%(+4.69)#89 | 6.2%(+4.47)#3,314 |
| 90. | 42361 | 10.6% | 6.0%(+4.63)#90 | 6.2%(+4.40)#3,375 |
| 91. | 41034 | 10.5% | 6.0%(+4.50)#91 | 6.2%(+4.27)#3,498 |
| 92. | 42753 | 10.4% | 6.0%(+4.47)#92 | 6.2%(+4.24)#3,530 |
| 93. | 41615 | 10.4% | 6.0%(+4.44)#93 | 6.2%(+4.22)#3,553 |
| 94. | 42372 | 10.3% | 6.0%(+4.33)#94 | 6.2%(+4.11)#3,655 |
| 95. | 40769 | 10.2% | 6.0%(+4.26)#95 | 6.2%(+4.03)#3,722 |
| 96. | 41059 | 10.2% | 6.0%(+4.25)#96 | 6.2%(+4.02)#3,733 |
| 97. | 42058 | 10.0% | 6.0%(+4.03)#97 | 6.2%(+3.81)#3,945 |
| 98. | 42027 | 10.0% | 6.0%(+4.01)#98 | 6.2%(+3.79)#3,963 |
| 99. | 41837 | 10.0% | 6.0%(+4.01)#99 | 6.2%(+3.78)#3,971 |
| 100. | 42647 | 9.9% | 6.0%(+3.96)#100 | 6.2%(+3.73)#4,040 |
Common Questions
What are the Top 10 Zip Codes with the Highest Percentage of Population Employed in Education Instruction & Library in Kentucky?
Top 10 Zip Codes with the Highest Percentage of Population Employed in Education Instruction & Library in Kentucky are:
What zip code has the Highest Percentage of Population Employed in Education Instruction & Library in Kentucky?
42356 has the Highest Percentage of Population Employed in Education Instruction & Library in Kentucky with 100.0%.
What is the Percentage of Population Employed in Education Instruction & Library in the State of Kentucky?
Percentage of Population Employed in Education Instruction & Library in Kentucky is 6.0%.
What is the Percentage of Population Employed in Education Instruction & Library in the United States?
Percentage of Population Employed in Education Instruction & Library in the United States is 6.2%.