Zip Codes with the Highest Percentage of Families with Income Below $10,000 in Kentucky
RELATED REPORTS & OPTIONS
Family Income | $0-10k
Kentucky
Compare Zip Codes
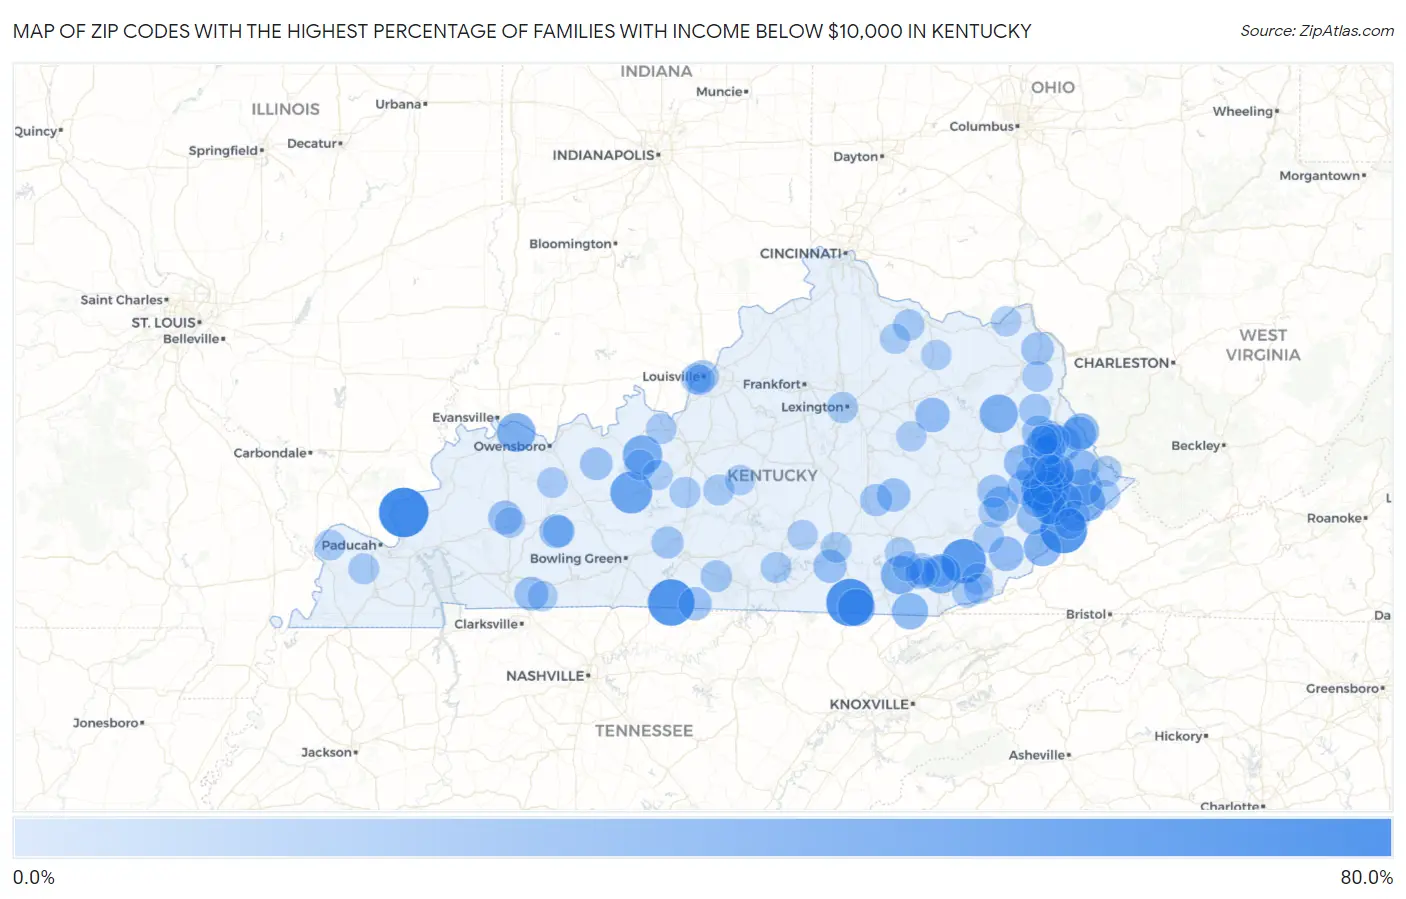
Map of Zip Codes with the Highest Percentage of Families with Income Below $10,000 in Kentucky
0.0%
80.0%
Zip Codes with the Highest Percentage of Families with Income Below $10,000 in Kentucky
| Zip Code | Families with Income < $10k | vs State | vs National | |
| 1. | 42047 | 68.8% | 4.2%(+64.6)#1 | 3.1%(+65.7)#26 |
| 2. | 42638 | 61.8% | 4.2%(+57.6)#2 | 3.1%(+58.7)#38 |
| 3. | 41651 | 60.4% | 4.2%(+56.2)#3 | 3.1%(+57.3)#42 |
| 4. | 41517 | 60.0% | 4.2%(+55.8)#4 | 3.1%(+56.9)#43 |
| 5. | 42153 | 59.1% | 4.2%(+54.9)#5 | 3.1%(+56.0)#46 |
| 6. | 40874 | 53.3% | 4.2%(+49.1)#6 | 3.1%(+50.2)#53 |
| 7. | 42762 | 45.5% | 4.2%(+41.3)#7 | 3.1%(+42.4)#81 |
| 8. | 40140 | 37.6% | 4.2%(+33.4)#8 | 3.1%(+34.5)#126 |
| 9. | 40997 | 37.2% | 4.2%(+33.0)#9 | 3.1%(+34.1)#130 |
| 10. | 42451 | 35.5% | 4.2%(+31.3)#10 | 3.1%(+32.4)#141 |
| 11. | 41421 | 34.7% | 4.2%(+30.5)#11 | 3.1%(+31.6)#147 |
| 12. | 40771 | 34.6% | 4.2%(+30.4)#12 | 3.1%(+31.5)#148 |
| 13. | 41559 | 33.3% | 4.2%(+29.1)#13 | 3.1%(+30.2)#157 |
| 14. | 42649 | 31.5% | 4.2%(+27.3)#14 | 3.1%(+28.4)#173 |
| 15. | 40826 | 31.3% | 4.2%(+27.1)#15 | 3.1%(+28.2)#178 |
| 16. | 41615 | 30.1% | 4.2%(+25.9)#16 | 3.1%(+27.0)#192 |
| 17. | 41557 | 29.6% | 4.2%(+25.4)#17 | 3.1%(+26.5)#200 |
| 18. | 41214 | 28.4% | 4.2%(+24.2)#18 | 3.1%(+25.3)#221 |
| 19. | 40940 | 28.4% | 4.2%(+24.2)#19 | 3.1%(+25.3)#222 |
| 20. | 41650 | 27.0% | 4.2%(+22.8)#20 | 3.1%(+23.9)#249 |
| 21. | 41267 | 26.4% | 4.2%(+22.2)#21 | 3.1%(+23.3)#266 |
| 22. | 41663 | 26.4% | 4.2%(+22.2)#22 | 3.1%(+23.3)#269 |
| 23. | 41216 | 25.7% | 4.2%(+21.5)#23 | 3.1%(+22.6)#286 |
| 24. | 41571 | 25.3% | 4.2%(+21.1)#24 | 3.1%(+22.2)#297 |
| 25. | 41640 | 23.8% | 4.2%(+19.6)#25 | 3.1%(+20.7)#340 |
| 26. | 41464 | 23.4% | 4.2%(+19.2)#26 | 3.1%(+20.3)#357 |
| 27. | 41712 | 23.3% | 4.2%(+19.1)#27 | 3.1%(+20.2)#360 |
| 28. | 40346 | 23.2% | 4.2%(+19.0)#28 | 3.1%(+20.1)#364 |
| 29. | 41203 | 23.2% | 4.2%(+19.0)#29 | 3.1%(+20.1)#365 |
| 30. | 41735 | 23.1% | 4.2%(+18.9)#30 | 3.1%(+20.0)#371 |
| 31. | 41271 | 22.0% | 4.2%(+17.8)#31 | 3.1%(+18.9)#405 |
| 32. | 41843 | 21.9% | 4.2%(+17.7)#32 | 3.1%(+18.8)#409 |
| 33. | 42321 | 21.2% | 4.2%(+17.0)#33 | 3.1%(+18.1)#431 |
| 34. | 42410 | 21.1% | 4.2%(+16.9)#34 | 3.1%(+18.0)#432 |
| 35. | 42286 | 21.0% | 4.2%(+16.8)#35 | 3.1%(+17.9)#436 |
| 36. | 41560 | 21.0% | 4.2%(+16.8)#36 | 3.1%(+17.9)#439 |
| 37. | 41274 | 20.9% | 4.2%(+16.7)#37 | 3.1%(+17.8)#441 |
| 38. | 41642 | 20.5% | 4.2%(+16.3)#38 | 3.1%(+17.4)#455 |
| 39. | 41666 | 20.0% | 4.2%(+15.8)#39 | 3.1%(+16.9)#472 |
| 40. | 40481 | 20.0% | 4.2%(+15.8)#40 | 3.1%(+16.9)#477 |
| 41. | 41606 | 19.9% | 4.2%(+15.7)#41 | 3.1%(+16.8)#489 |
| 42. | 42518 | 19.6% | 4.2%(+15.4)#42 | 3.1%(+16.5)#498 |
| 43. | 42140 | 19.5% | 4.2%(+15.3)#43 | 3.1%(+16.4)#505 |
| 44. | 41317 | 19.1% | 4.2%(+14.9)#44 | 3.1%(+16.0)#523 |
| 45. | 41121 | 17.8% | 4.2%(+13.6)#45 | 3.1%(+14.7)#596 |
| 46. | 42343 | 17.7% | 4.2%(+13.5)#46 | 3.1%(+14.6)#602 |
| 47. | 41619 | 17.7% | 4.2%(+13.5)#47 | 3.1%(+14.6)#605 |
| 48. | 40203 | 16.9% | 4.2%(+12.7)#48 | 3.1%(+13.8)#675 |
| 49. | 40460 | 16.7% | 4.2%(+12.5)#49 | 3.1%(+13.6)#688 |
| 50. | 41124 | 16.3% | 4.2%(+12.1)#50 | 3.1%(+13.2)#730 |
| 51. | 42160 | 16.2% | 4.2%(+12.0)#51 | 3.1%(+13.1)#736 |
| 52. | 41204 | 15.4% | 4.2%(+11.2)#52 | 3.1%(+12.3)#815 |
| 53. | 41861 | 15.2% | 4.2%(+11.0)#53 | 3.1%(+12.1)#847 |
| 54. | 42323 | 15.1% | 4.2%(+10.9)#54 | 3.1%(+12.0)#859 |
| 55. | 42124 | 14.7% | 4.2%(+10.5)#55 | 3.1%(+11.6)#901 |
| 56. | 41044 | 14.2% | 4.2%(+10.00)#56 | 3.1%(+11.1)#956 |
| 57. | 41602 | 13.9% | 4.2%(+9.70)#57 | 3.1%(+10.8)#991 |
| 58. | 41653 | 13.8% | 4.2%(+9.60)#58 | 3.1%(+10.7)#999 |
| 59. | 41265 | 13.6% | 4.2%(+9.40)#59 | 3.1%(+10.5)#1,036 |
| 60. | 40504 | 13.5% | 4.2%(+9.30)#60 | 3.1%(+10.4)#1,043 |
| 61. | 40923 | 13.5% | 4.2%(+9.30)#61 | 3.1%(+10.4)#1,053 |
| 62. | 42784 | 13.1% | 4.2%(+8.90)#62 | 3.1%(+10.00)#1,106 |
| 63. | 41260 | 12.9% | 4.2%(+8.70)#63 | 3.1%(+9.80)#1,145 |
| 64. | 42629 | 12.8% | 4.2%(+8.60)#64 | 3.1%(+9.70)#1,157 |
| 65. | 41240 | 12.7% | 4.2%(+8.50)#65 | 3.1%(+9.60)#1,183 |
| 66. | 40935 | 12.4% | 4.2%(+8.20)#66 | 3.1%(+9.30)#1,242 |
| 67. | 42716 | 12.4% | 4.2%(+8.20)#67 | 3.1%(+9.30)#1,243 |
| 68. | 42069 | 12.4% | 4.2%(+8.20)#68 | 3.1%(+9.30)#1,245 |
| 69. | 42533 | 12.4% | 4.2%(+8.20)#69 | 3.1%(+9.30)#1,247 |
| 70. | 41616 | 12.4% | 4.2%(+8.20)#70 | 3.1%(+9.30)#1,251 |
| 71. | 40854 | 12.3% | 4.2%(+8.10)#71 | 3.1%(+9.20)#1,269 |
| 72. | 40145 | 12.3% | 4.2%(+8.10)#72 | 3.1%(+9.20)#1,270 |
| 73. | 41534 | 12.2% | 4.2%(+8.00)#73 | 3.1%(+9.10)#1,295 |
| 74. | 41531 | 12.1% | 4.2%(+7.90)#74 | 3.1%(+9.00)#1,307 |
| 75. | 41132 | 12.1% | 4.2%(+7.90)#75 | 3.1%(+9.00)#1,309 |
| 76. | 41764 | 12.1% | 4.2%(+7.90)#76 | 3.1%(+9.00)#1,310 |
| 77. | 40211 | 12.0% | 4.2%(+7.80)#77 | 3.1%(+8.90)#1,317 |
| 78. | 42024 | 12.0% | 4.2%(+7.80)#78 | 3.1%(+8.90)#1,330 |
| 79. | 40915 | 12.0% | 4.2%(+7.80)#79 | 3.1%(+8.90)#1,331 |
| 80. | 41563 | 12.0% | 4.2%(+7.80)#80 | 3.1%(+8.90)#1,335 |
| 81. | 40117 | 11.8% | 4.2%(+7.60)#81 | 3.1%(+8.70)#1,377 |
| 82. | 42352 | 11.7% | 4.2%(+7.50)#82 | 3.1%(+8.60)#1,404 |
| 83. | 41601 | 11.7% | 4.2%(+7.50)#83 | 3.1%(+8.60)#1,411 |
| 84. | 40863 | 11.6% | 4.2%(+7.40)#84 | 3.1%(+8.50)#1,435 |
| 85. | 40906 | 11.5% | 4.2%(+7.30)#85 | 3.1%(+8.40)#1,451 |
| 86. | 40740 | 11.4% | 4.2%(+7.20)#86 | 3.1%(+8.30)#1,482 |
| 87. | 42712 | 11.3% | 4.2%(+7.10)#87 | 3.1%(+8.20)#1,513 |
| 88. | 42440 | 11.3% | 4.2%(+7.10)#88 | 3.1%(+8.20)#1,519 |
| 89. | 40210 | 11.2% | 4.2%(+7.00)#89 | 3.1%(+8.10)#1,532 |
| 90. | 41524 | 11.1% | 4.2%(+6.90)#90 | 3.1%(+8.00)#1,575 |
| 91. | 41701 | 11.0% | 4.2%(+6.80)#91 | 3.1%(+7.90)#1,585 |
| 92. | 40312 | 11.0% | 4.2%(+6.80)#92 | 3.1%(+7.90)#1,591 |
| 93. | 40831 | 10.9% | 4.2%(+6.70)#93 | 3.1%(+7.80)#1,619 |
| 94. | 42234 | 10.9% | 4.2%(+6.70)#94 | 3.1%(+7.80)#1,624 |
| 95. | 41166 | 10.9% | 4.2%(+6.70)#95 | 3.1%(+7.80)#1,630 |
| 96. | 41041 | 10.8% | 4.2%(+6.60)#96 | 3.1%(+7.70)#1,652 |
| 97. | 40734 | 10.8% | 4.2%(+6.60)#97 | 3.1%(+7.70)#1,656 |
| 98. | 40060 | 10.8% | 4.2%(+6.60)#98 | 3.1%(+7.70)#1,664 |
| 99. | 42565 | 10.8% | 4.2%(+6.60)#99 | 3.1%(+7.70)#1,667 |
| 100. | 41064 | 10.6% | 4.2%(+6.40)#100 | 3.1%(+7.50)#1,716 |
Common Questions
What are the Top 10 Zip Codes with the Highest Percentage of Families with Income Below $10,000 in Kentucky?
Top 10 Zip Codes with the Highest Percentage of Families with Income Below $10,000 in Kentucky are:
What zip code has the Highest Percentage of Families with Income Below $10,000 in Kentucky?
42047 has the Highest Percentage of Families with Income Below $10,000 in Kentucky with 68.8%.
What is the Percentage of Families with Income Below $10,000 in the State of Kentucky?
Percentage of Families with Income Below $10,000 in Kentucky is 4.2%.
What is the Percentage of Families with Income Below $10,000 in the United States?
Percentage of Families with Income Below $10,000 in the United States is 3.1%.