Zip Codes with the Highest Percentage of Self-Employed / Not Incorporated in Kentucky
RELATED REPORTS & OPTIONS
Self-Employed / Not Incorporated
Kentucky
Compare Zip Codes
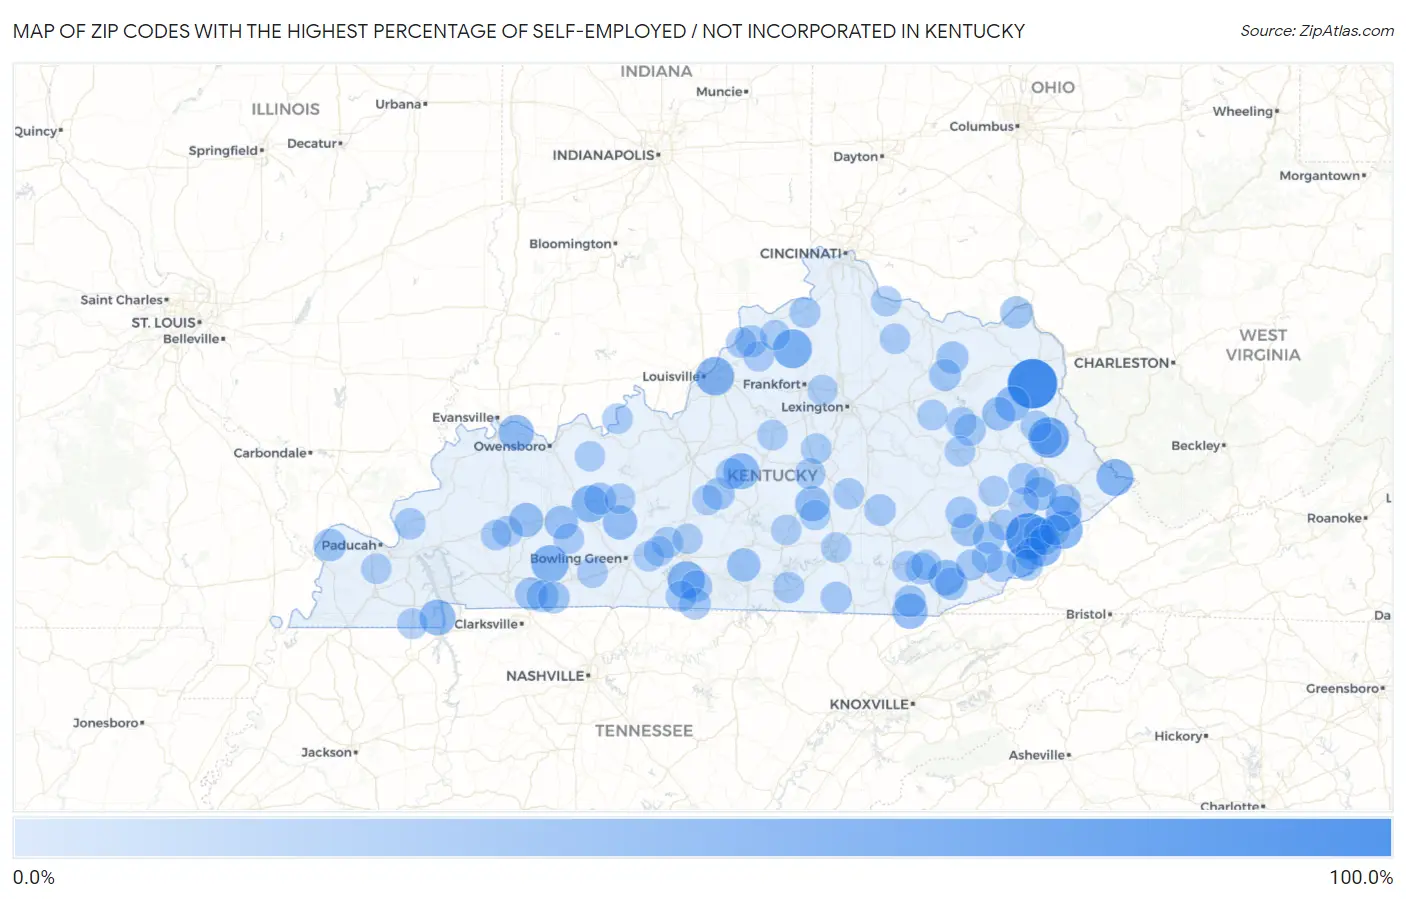
Map of Zip Codes with the Highest Percentage of Self-Employed / Not Incorporated in Kentucky
0.0%
100.0%
Zip Codes with the Highest Percentage of Self-Employed / Not Incorporated in Kentucky
| Zip Code | % Self-Employed / Not Incorporated | vs State | vs National | |
| 1. | 41181 | 100.0% | 5.1%(+94.9)#1 | 5.8%(+94.2)#20 |
| 2. | 41845 | 83.0% | 5.1%(+77.9)#2 | 5.8%(+77.2)#71 |
| 3. | 41271 | 57.1% | 5.1%(+52.0)#3 | 5.8%(+51.3)#154 |
| 4. | 40036 | 50.9% | 5.1%(+45.8)#4 | 5.8%(+45.1)#210 |
| 5. | 40041 | 47.1% | 5.1%(+41.9)#5 | 5.8%(+41.2)#264 |
| 6. | 41517 | 45.5% | 5.1%(+40.3)#6 | 5.8%(+39.6)#296 |
| 7. | 40826 | 45.0% | 5.1%(+39.9)#7 | 5.8%(+39.2)#303 |
| 8. | 42131 | 43.3% | 5.1%(+38.2)#8 | 5.8%(+37.5)#329 |
| 9. | 42280 | 42.7% | 5.1%(+37.6)#9 | 5.8%(+36.9)#346 |
| 10. | 41528 | 40.8% | 5.1%(+35.6)#10 | 5.8%(+35.0)#393 |
| 11. | 42333 | 40.5% | 5.1%(+35.3)#11 | 5.8%(+34.6)#398 |
| 12. | 40062 | 37.0% | 5.1%(+31.9)#12 | 5.8%(+31.2)#491 |
| 13. | 42076 | 36.7% | 5.1%(+31.5)#13 | 5.8%(+30.9)#499 |
| 14. | 41538 | 35.9% | 5.1%(+30.7)#14 | 5.8%(+30.1)#533 |
| 15. | 40940 | 34.2% | 5.1%(+29.1)#15 | 5.8%(+28.4)#575 |
| 16. | 40902 | 33.8% | 5.1%(+28.6)#16 | 5.8%(+27.9)#585 |
| 17. | 42451 | 33.7% | 5.1%(+28.6)#17 | 5.8%(+27.9)#586 |
| 18. | 41149 | 33.3% | 5.1%(+28.2)#18 | 5.8%(+27.5)#599 |
| 19. | 42541 | 31.4% | 5.1%(+26.3)#19 | 5.8%(+25.6)#700 |
| 20. | 42252 | 29.6% | 5.1%(+24.5)#20 | 5.8%(+23.8)#794 |
| 21. | 42344 | 28.6% | 5.1%(+23.5)#21 | 5.8%(+22.8)#847 |
| 22. | 41421 | 25.8% | 5.1%(+20.7)#22 | 5.8%(+20.0)#1,066 |
| 23. | 42326 | 25.7% | 5.1%(+20.5)#23 | 5.8%(+19.9)#1,080 |
| 24. | 41666 | 25.6% | 5.1%(+20.4)#24 | 5.8%(+19.8)#1,094 |
| 25. | 42715 | 25.0% | 5.1%(+19.9)#25 | 5.8%(+19.2)#1,145 |
| 26. | 41815 | 22.6% | 5.1%(+17.5)#26 | 5.8%(+16.8)#1,403 |
| 27. | 42286 | 22.5% | 5.1%(+17.3)#27 | 5.8%(+16.7)#1,416 |
| 28. | 40958 | 21.9% | 5.1%(+16.7)#28 | 5.8%(+16.0)#1,498 |
| 29. | 41766 | 21.7% | 5.1%(+16.6)#29 | 5.8%(+15.9)#1,518 |
| 30. | 42024 | 21.5% | 5.1%(+16.3)#30 | 5.8%(+15.7)#1,562 |
| 31. | 41093 | 20.5% | 5.1%(+15.3)#31 | 5.8%(+14.7)#1,727 |
| 32. | 41174 | 20.1% | 5.1%(+15.0)#32 | 5.8%(+14.3)#1,779 |
| 33. | 42764 | 20.0% | 5.1%(+14.9)#33 | 5.8%(+14.2)#1,811 |
| 34. | 42349 | 19.7% | 5.1%(+14.5)#34 | 5.8%(+13.9)#1,878 |
| 35. | 42234 | 19.0% | 5.1%(+13.8)#35 | 5.8%(+13.2)#2,042 |
| 36. | 41049 | 18.9% | 5.1%(+13.7)#36 | 5.8%(+13.1)#2,069 |
| 37. | 42157 | 18.9% | 5.1%(+13.7)#37 | 5.8%(+13.0)#2,074 |
| 38. | 41764 | 18.3% | 5.1%(+13.2)#38 | 5.8%(+12.5)#2,216 |
| 39. | 40055 | 18.3% | 5.1%(+13.2)#39 | 5.8%(+12.5)#2,226 |
| 40. | 40763 | 18.2% | 5.1%(+13.0)#40 | 5.8%(+12.4)#2,262 |
| 41. | 41260 | 18.1% | 5.1%(+12.9)#41 | 5.8%(+12.3)#2,291 |
| 42. | 42204 | 18.0% | 5.1%(+12.8)#42 | 5.8%(+12.2)#2,318 |
| 43. | 41560 | 17.9% | 5.1%(+12.7)#43 | 5.8%(+12.0)#2,352 |
| 44. | 41721 | 17.6% | 5.1%(+12.5)#44 | 5.8%(+11.8)#2,426 |
| 45. | 40923 | 17.6% | 5.1%(+12.4)#45 | 5.8%(+11.8)#2,447 |
| 46. | 40807 | 17.4% | 5.1%(+12.3)#46 | 5.8%(+11.6)#2,482 |
| 47. | 42140 | 17.3% | 5.1%(+12.1)#47 | 5.8%(+11.5)#2,537 |
| 48. | 40862 | 17.2% | 5.1%(+12.1)#48 | 5.8%(+11.4)#2,567 |
| 49. | 40445 | 17.2% | 5.1%(+12.1)#49 | 5.8%(+11.4)#2,570 |
| 50. | 42647 | 16.8% | 5.1%(+11.7)#50 | 5.8%(+11.0)#2,691 |
| 51. | 41425 | 16.8% | 5.1%(+11.6)#51 | 5.8%(+11.0)#2,702 |
| 52. | 41632 | 16.4% | 5.1%(+11.2)#52 | 5.8%(+10.5)#2,849 |
| 53. | 40855 | 16.2% | 5.1%(+11.0)#53 | 5.8%(+10.4)#2,914 |
| 54. | 42028 | 16.1% | 5.1%(+10.9)#54 | 5.8%(+10.2)#2,950 |
| 55. | 42133 | 15.7% | 5.1%(+10.5)#55 | 5.8%(+9.85)#3,134 |
| 56. | 40870 | 15.4% | 5.1%(+10.3)#56 | 5.8%(+9.62)#3,219 |
| 57. | 40808 | 15.4% | 5.1%(+10.2)#57 | 5.8%(+9.57)#3,246 |
| 58. | 42160 | 15.3% | 5.1%(+10.2)#58 | 5.8%(+9.53)#3,262 |
| 59. | 40052 | 15.3% | 5.1%(+10.2)#59 | 5.8%(+9.49)#3,280 |
| 60. | 41255 | 15.0% | 5.1%(+9.86)#60 | 5.8%(+9.18)#3,421 |
| 61. | 42603 | 14.9% | 5.1%(+9.77)#61 | 5.8%(+9.09)#3,464 |
| 62. | 40387 | 14.8% | 5.1%(+9.71)#62 | 5.8%(+9.03)#3,500 |
| 63. | 40419 | 14.8% | 5.1%(+9.64)#63 | 5.8%(+8.96)#3,527 |
| 64. | 41086 | 14.5% | 5.1%(+9.37)#64 | 5.8%(+8.69)#3,652 |
| 65. | 40440 | 14.4% | 5.1%(+9.22)#65 | 5.8%(+8.54)#3,714 |
| 66. | 40840 | 14.1% | 5.1%(+8.98)#66 | 5.8%(+8.30)#3,845 |
| 67. | 42442 | 13.8% | 5.1%(+8.65)#67 | 5.8%(+7.97)#4,023 |
| 68. | 40734 | 13.7% | 5.1%(+8.56)#68 | 5.8%(+7.89)#4,066 |
| 69. | 42049 | 13.4% | 5.1%(+8.30)#69 | 5.8%(+7.62)#4,225 |
| 70. | 42339 | 13.4% | 5.1%(+8.28)#70 | 5.8%(+7.61)#4,232 |
| 71. | 42721 | 13.4% | 5.1%(+8.25)#71 | 5.8%(+7.57)#4,254 |
| 72. | 42206 | 13.2% | 5.1%(+8.04)#72 | 5.8%(+7.36)#4,408 |
| 73. | 40346 | 13.2% | 5.1%(+8.02)#73 | 5.8%(+7.34)#4,420 |
| 74. | 41751 | 13.2% | 5.1%(+8.02)#74 | 5.8%(+7.34)#4,423 |
| 75. | 40078 | 13.1% | 5.1%(+7.98)#75 | 5.8%(+7.30)#4,447 |
| 76. | 41317 | 13.1% | 5.1%(+7.96)#76 | 5.8%(+7.28)#4,459 |
| 77. | 40068 | 12.9% | 5.1%(+7.74)#77 | 5.8%(+7.06)#4,600 |
| 78. | 42453 | 12.8% | 5.1%(+7.68)#78 | 5.8%(+7.00)#4,650 |
| 79. | 41645 | 12.7% | 5.1%(+7.52)#79 | 5.8%(+6.84)#4,756 |
| 80. | 41064 | 12.6% | 5.1%(+7.48)#80 | 5.8%(+6.81)#4,782 |
| 81. | 41301 | 12.6% | 5.1%(+7.46)#81 | 5.8%(+6.78)#4,806 |
| 82. | 40170 | 12.6% | 5.1%(+7.44)#82 | 5.8%(+6.76)#4,824 |
| 83. | 42159 | 12.5% | 5.1%(+7.36)#83 | 5.8%(+6.68)#4,876 |
| 84. | 40310 | 12.5% | 5.1%(+7.31)#84 | 5.8%(+6.64)#4,926 |
| 85. | 41831 | 12.4% | 5.1%(+7.27)#85 | 5.8%(+6.60)#4,954 |
| 86. | 41043 | 12.4% | 5.1%(+7.27)#86 | 5.8%(+6.59)#4,963 |
| 87. | 40077 | 12.3% | 5.1%(+7.21)#87 | 5.8%(+6.53)#5,002 |
| 88. | 41837 | 12.3% | 5.1%(+7.19)#88 | 5.8%(+6.52)#5,013 |
| 89. | 42528 | 12.1% | 5.1%(+6.97)#89 | 5.8%(+6.29)#5,198 |
| 90. | 42027 | 12.0% | 5.1%(+6.91)#90 | 5.8%(+6.23)#5,253 |
| 91. | 41810 | 11.9% | 5.1%(+6.73)#91 | 5.8%(+6.05)#5,387 |
| 92. | 42533 | 11.8% | 5.1%(+6.67)#92 | 5.8%(+5.99)#5,444 |
| 93. | 42171 | 11.8% | 5.1%(+6.63)#93 | 5.8%(+5.95)#5,481 |
| 94. | 42566 | 11.7% | 5.1%(+6.53)#94 | 5.8%(+5.85)#5,566 |
| 95. | 42368 | 11.6% | 5.1%(+6.46)#95 | 5.8%(+5.79)#5,618 |
| 96. | 42757 | 11.6% | 5.1%(+6.46)#96 | 5.8%(+5.78)#5,621 |
| 97. | 42127 | 11.5% | 5.1%(+6.38)#97 | 5.8%(+5.71)#5,678 |
| 98. | 40347 | 11.5% | 5.1%(+6.36)#98 | 5.8%(+5.69)#5,700 |
| 99. | 40953 | 11.5% | 5.1%(+6.35)#99 | 5.8%(+5.68)#5,708 |
| 100. | 40011 | 11.5% | 5.1%(+6.31)#100 | 5.8%(+5.64)#5,757 |
Common Questions
What are the Top 10 Zip Codes with the Highest Percentage of Self-Employed / Not Incorporated in Kentucky?
Top 10 Zip Codes with the Highest Percentage of Self-Employed / Not Incorporated in Kentucky are:
What zip code has the Highest Percentage of Self-Employed / Not Incorporated in Kentucky?
41181 has the Highest Percentage of Self-Employed / Not Incorporated in Kentucky with 100.0%.
What is the Percentage of Self-Employed / Not Incorporated in the State of Kentucky?
Percentage of Self-Employed / Not Incorporated in Kentucky is 5.1%.
What is the Percentage of Self-Employed / Not Incorporated in the United States?
Percentage of Self-Employed / Not Incorporated in the United States is 5.8%.