Zip Codes with the Highest Percentage of Population with a Degree in Social Sciences in Kentucky
RELATED REPORTS & OPTIONS
Social Sciences
Kentucky
Compare Zip Codes
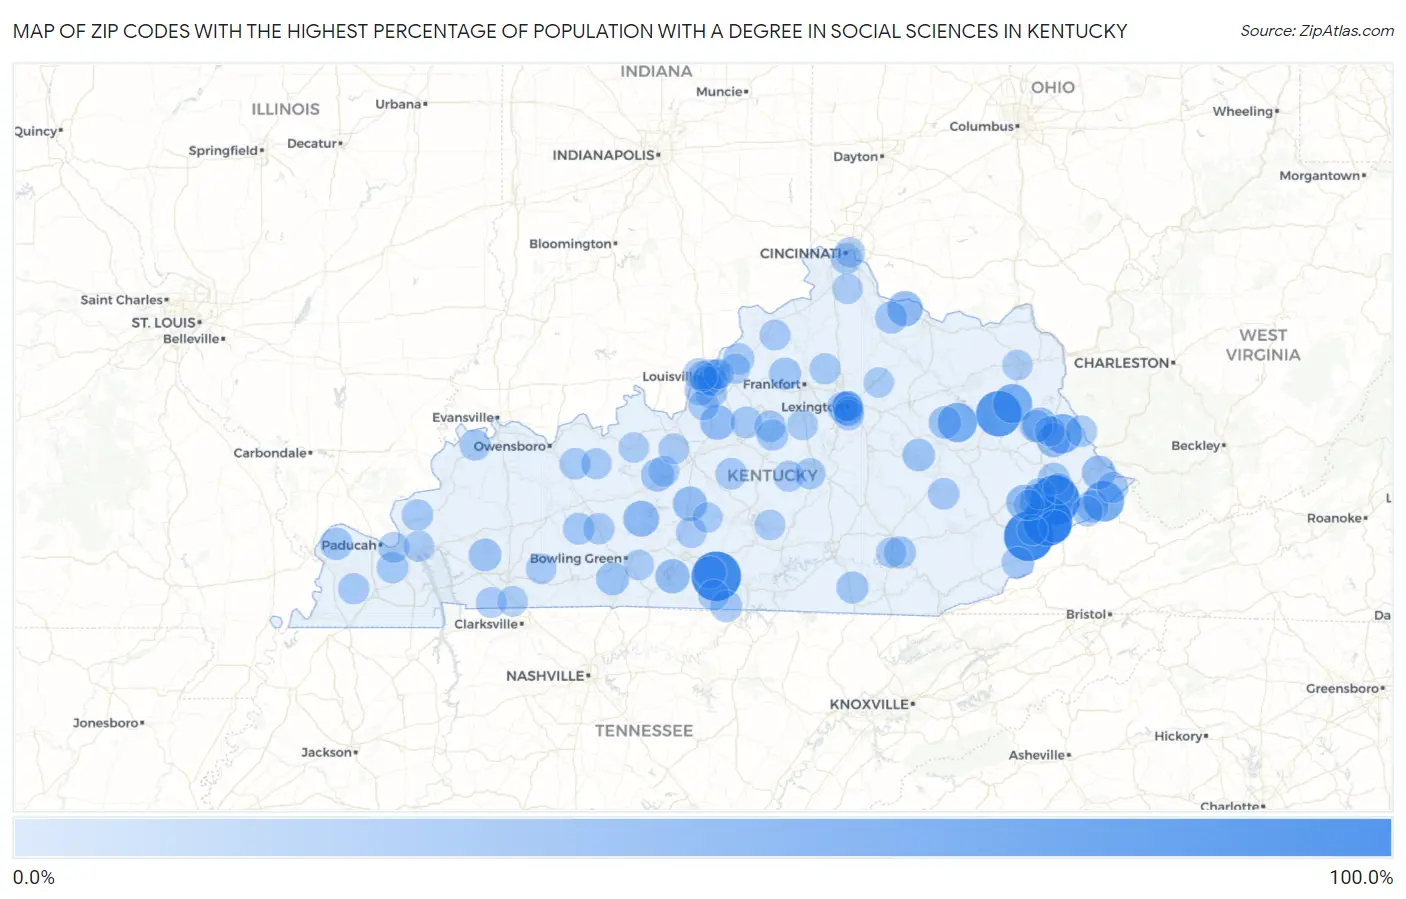
Map of Zip Codes with the Highest Percentage of Population with a Degree in Social Sciences in Kentucky
0.0%
100.0%
Zip Codes with the Highest Percentage of Population with a Degree in Social Sciences in Kentucky
| Zip Code | % Graduates | vs State | vs National | |
| 1. | 41604 | 100.0% | 6.0%(+94.0)#1 | 8.1%(+91.9)#11 |
| 2. | 41845 | 100.0% | 6.0%(+94.0)#2 | 8.1%(+91.9)#14 |
| 3. | 41812 | 100.0% | 6.0%(+94.0)#3 | 8.1%(+91.9)#28 |
| 4. | 42124 | 100.0% | 6.0%(+94.0)#4 | 8.1%(+91.9)#38 |
| 5. | 41421 | 80.3% | 6.0%(+74.3)#5 | 8.1%(+72.3)#63 |
| 6. | 41548 | 57.1% | 6.0%(+51.1)#6 | 8.1%(+49.1)#108 |
| 7. | 41262 | 50.0% | 6.0%(+44.0)#7 | 8.1%(+41.9)#138 |
| 8. | 41149 | 50.0% | 6.0%(+44.0)#8 | 8.1%(+41.9)#142 |
| 9. | 40316 | 50.0% | 6.0%(+44.0)#9 | 8.1%(+41.9)#144 |
| 10. | 42285 | 33.9% | 6.0%(+27.9)#10 | 8.1%(+25.8)#333 |
| 11. | 41002 | 31.9% | 6.0%(+25.9)#11 | 8.1%(+23.8)#383 |
| 12. | 41861 | 30.6% | 6.0%(+24.6)#12 | 8.1%(+22.5)#418 |
| 13. | 41831 | 30.3% | 6.0%(+24.3)#13 | 8.1%(+22.2)#425 |
| 14. | 41257 | 29.8% | 6.0%(+23.8)#14 | 8.1%(+21.7)#435 |
| 15. | 40110 | 28.6% | 6.0%(+22.6)#15 | 8.1%(+20.5)#472 |
| 16. | 42713 | 27.2% | 6.0%(+21.2)#16 | 8.1%(+19.1)#530 |
| 17. | 42156 | 26.8% | 6.0%(+20.8)#17 | 8.1%(+18.7)#549 |
| 18. | 41204 | 25.3% | 6.0%(+19.3)#18 | 8.1%(+17.2)#618 |
| 19. | 41535 | 25.0% | 6.0%(+19.0)#19 | 8.1%(+16.9)#631 |
| 20. | 42712 | 21.4% | 6.0%(+15.4)#20 | 8.1%(+13.3)#852 |
| 21. | 42170 | 20.4% | 6.0%(+14.4)#21 | 8.1%(+12.3)#928 |
| 22. | 40526 | 20.0% | 6.0%(+14.0)#22 | 8.1%(+11.9)#960 |
| 23. | 41835 | 19.6% | 6.0%(+13.6)#23 | 8.1%(+11.6)#1,007 |
| 24. | 42215 | 19.1% | 6.0%(+13.1)#24 | 8.1%(+11.0)#1,074 |
| 25. | 40322 | 19.0% | 6.0%(+13.0)#25 | 8.1%(+10.9)#1,089 |
| 26. | 42166 | 18.9% | 6.0%(+12.9)#26 | 8.1%(+10.9)#1,092 |
| 27. | 40472 | 18.8% | 6.0%(+12.8)#27 | 8.1%(+10.8)#1,109 |
| 28. | 41255 | 18.1% | 6.0%(+12.1)#28 | 8.1%(+10.0)#1,224 |
| 29. | 42056 | 18.0% | 6.0%(+12.1)#29 | 8.1%(+9.98)#1,231 |
| 30. | 41513 | 17.6% | 6.0%(+11.7)#30 | 8.1%(+9.58)#1,298 |
| 31. | 40003 | 17.1% | 6.0%(+11.1)#31 | 8.1%(+9.01)#1,380 |
| 32. | 41004 | 16.7% | 6.0%(+10.7)#32 | 8.1%(+8.62)#1,458 |
| 33. | 40740 | 16.3% | 6.0%(+10.3)#33 | 8.1%(+8.23)#1,562 |
| 34. | 42653 | 16.0% | 6.0%(+10.0)#34 | 8.1%(+7.93)#1,633 |
| 35. | 41615 | 15.7% | 6.0%(+9.74)#35 | 8.1%(+7.66)#1,719 |
| 36. | 42273 | 14.6% | 6.0%(+8.59)#36 | 8.1%(+6.51)#2,110 |
| 37. | 42151 | 14.6% | 6.0%(+8.59)#37 | 8.1%(+6.51)#2,112 |
| 38. | 41267 | 14.3% | 6.0%(+8.29)#38 | 8.1%(+6.21)#2,203 |
| 39. | 40020 | 14.3% | 6.0%(+8.29)#39 | 8.1%(+6.21)#2,228 |
| 40. | 40823 | 14.2% | 6.0%(+8.25)#40 | 8.1%(+6.17)#2,256 |
| 41. | 40012 | 14.0% | 6.0%(+8.04)#41 | 8.1%(+5.96)#2,337 |
| 42. | 40052 | 13.7% | 6.0%(+7.73)#42 | 8.1%(+5.65)#2,465 |
| 43. | 41314 | 13.7% | 6.0%(+7.71)#43 | 8.1%(+5.63)#2,478 |
| 44. | 42082 | 13.7% | 6.0%(+7.71)#44 | 8.1%(+5.63)#2,479 |
| 45. | 40219 | 13.7% | 6.0%(+7.70)#45 | 8.1%(+5.62)#2,483 |
| 46. | 41666 | 13.6% | 6.0%(+7.64)#46 | 8.1%(+5.57)#2,516 |
| 47. | 41553 | 13.6% | 6.0%(+7.61)#47 | 8.1%(+5.53)#2,546 |
| 48. | 40078 | 13.0% | 6.0%(+7.02)#48 | 8.1%(+4.95)#2,820 |
| 49. | 42078 | 12.9% | 6.0%(+6.94)#49 | 8.1%(+4.86)#2,863 |
| 50. | 42261 | 12.7% | 6.0%(+6.75)#50 | 8.1%(+4.68)#2,978 |
| 51. | 42378 | 12.7% | 6.0%(+6.71)#51 | 8.1%(+4.64)#3,002 |
| 52. | 41635 | 12.4% | 6.0%(+6.45)#52 | 8.1%(+4.37)#3,184 |
| 53. | 42039 | 12.3% | 6.0%(+6.26)#53 | 8.1%(+4.18)#3,318 |
| 54. | 42167 | 12.2% | 6.0%(+6.25)#54 | 8.1%(+4.18)#3,321 |
| 55. | 40010 | 12.2% | 6.0%(+6.25)#55 | 8.1%(+4.17)#3,326 |
| 56. | 40206 | 12.1% | 6.0%(+6.12)#56 | 8.1%(+4.05)#3,412 |
| 57. | 40440 | 11.8% | 6.0%(+5.77)#57 | 8.1%(+3.69)#3,684 |
| 58. | 40212 | 11.5% | 6.0%(+5.55)#58 | 8.1%(+3.48)#3,880 |
| 59. | 42406 | 11.5% | 6.0%(+5.52)#59 | 8.1%(+3.44)#3,908 |
| 60. | 40504 | 11.5% | 6.0%(+5.46)#60 | 8.1%(+3.39)#3,946 |
| 61. | 42343 | 11.2% | 6.0%(+5.22)#61 | 8.1%(+3.14)#4,159 |
| 62. | 40379 | 11.2% | 6.0%(+5.16)#62 | 8.1%(+3.09)#4,211 |
| 63. | 42058 | 11.1% | 6.0%(+5.12)#63 | 8.1%(+3.04)#4,260 |
| 64. | 41014 | 10.9% | 6.0%(+4.89)#64 | 8.1%(+2.81)#4,487 |
| 65. | 42732 | 10.8% | 6.0%(+4.84)#65 | 8.1%(+2.76)#4,551 |
| 66. | 42045 | 10.7% | 6.0%(+4.70)#66 | 8.1%(+2.63)#4,699 |
| 67. | 40328 | 10.7% | 6.0%(+4.67)#67 | 8.1%(+2.60)#4,742 |
| 68. | 40204 | 10.6% | 6.0%(+4.63)#68 | 8.1%(+2.55)#4,791 |
| 69. | 40508 | 10.5% | 6.0%(+4.50)#69 | 8.1%(+2.43)#4,943 |
| 70. | 41824 | 10.4% | 6.0%(+4.44)#70 | 8.1%(+2.36)#5,029 |
| 71. | 40011 | 10.2% | 6.0%(+4.23)#71 | 8.1%(+2.16)#5,270 |
| 72. | 40517 | 10.2% | 6.0%(+4.21)#72 | 8.1%(+2.13)#5,303 |
| 73. | 40207 | 10.2% | 6.0%(+4.20)#73 | 8.1%(+2.13)#5,305 |
| 74. | 40162 | 10.2% | 6.0%(+4.16)#74 | 8.1%(+2.08)#5,353 |
| 75. | 42749 | 10.1% | 6.0%(+4.14)#75 | 8.1%(+2.06)#5,385 |
| 76. | 42254 | 10.0% | 6.0%(+4.01)#76 | 8.1%(+1.93)#5,588 |
| 77. | 40214 | 9.8% | 6.0%(+3.77)#77 | 8.1%(+1.70)#5,853 |
| 78. | 42220 | 9.6% | 6.0%(+3.60)#78 | 8.1%(+1.52)#6,086 |
| 79. | 40372 | 9.6% | 6.0%(+3.57)#79 | 8.1%(+1.49)#6,138 |
| 80. | 40217 | 9.6% | 6.0%(+3.56)#80 | 8.1%(+1.49)#6,140 |
| 81. | 40109 | 9.4% | 6.0%(+3.37)#81 | 8.1%(+1.29)#6,411 |
| 82. | 42103 | 9.3% | 6.0%(+3.32)#82 | 8.1%(+1.24)#6,471 |
| 83. | 40205 | 9.2% | 6.0%(+3.20)#83 | 8.1%(+1.12)#6,637 |
| 84. | 41254 | 9.2% | 6.0%(+3.19)#84 | 8.1%(+1.11)#6,653 |
| 85. | 40744 | 9.1% | 6.0%(+3.11)#85 | 8.1%(+1.03)#6,774 |
| 86. | 42753 | 9.1% | 6.0%(+3.10)#86 | 8.1%(+1.02)#6,806 |
| 87. | 40056 | 9.0% | 6.0%(+3.03)#87 | 8.1%(+0.950)#6,923 |
| 88. | 41063 | 9.0% | 6.0%(+2.97)#88 | 8.1%(+0.892)#7,010 |
| 89. | 41817 | 8.9% | 6.0%(+2.93)#89 | 8.1%(+0.857)#7,072 |
| 90. | 42262 | 8.9% | 6.0%(+2.89)#90 | 8.1%(+0.814)#7,143 |
| 91. | 41522 | 8.8% | 6.0%(+2.82)#91 | 8.1%(+0.747)#7,230 |
| 92. | 40144 | 8.8% | 6.0%(+2.81)#92 | 8.1%(+0.729)#7,272 |
| 93. | 40222 | 8.6% | 6.0%(+2.65)#93 | 8.1%(+0.572)#7,530 |
| 94. | 41143 | 8.6% | 6.0%(+2.58)#94 | 8.1%(+0.505)#7,663 |
| 95. | 40507 | 8.5% | 6.0%(+2.48)#95 | 8.1%(+0.405)#7,853 |
| 96. | 40203 | 8.4% | 6.0%(+2.44)#96 | 8.1%(+0.361)#7,945 |
| 97. | 40502 | 8.4% | 6.0%(+2.39)#97 | 8.1%(+0.313)#8,026 |
| 98. | 40361 | 8.4% | 6.0%(+2.37)#98 | 8.1%(+0.289)#8,067 |
| 99. | 41073 | 8.2% | 6.0%(+2.25)#99 | 8.1%(+0.174)#8,273 |
| 100. | 42722 | 8.2% | 6.0%(+2.22)#100 | 8.1%(+0.148)#8,325 |
Common Questions
What are the Top 10 Zip Codes with the Highest Percentage of Population with a Degree in Social Sciences in Kentucky?
Top 10 Zip Codes with the Highest Percentage of Population with a Degree in Social Sciences in Kentucky are:
What zip code has the Highest Percentage of Population with a Degree in Social Sciences in Kentucky?
41604 has the Highest Percentage of Population with a Degree in Social Sciences in Kentucky with 100.0%.
What is the Percentage of Population with a Degree in Social Sciences in the State of Kentucky?
Percentage of Population with a Degree in Social Sciences in Kentucky is 6.0%.
What is the Percentage of Population with a Degree in Social Sciences in the United States?
Percentage of Population with a Degree in Social Sciences in the United States is 8.1%.