Zip Codes with the Highest Percentage of Self-Employed / Not Incorporated in South Carolina
RELATED REPORTS & OPTIONS
Self-Employed / Not Incorporated
South Carolina
Compare Zip Codes
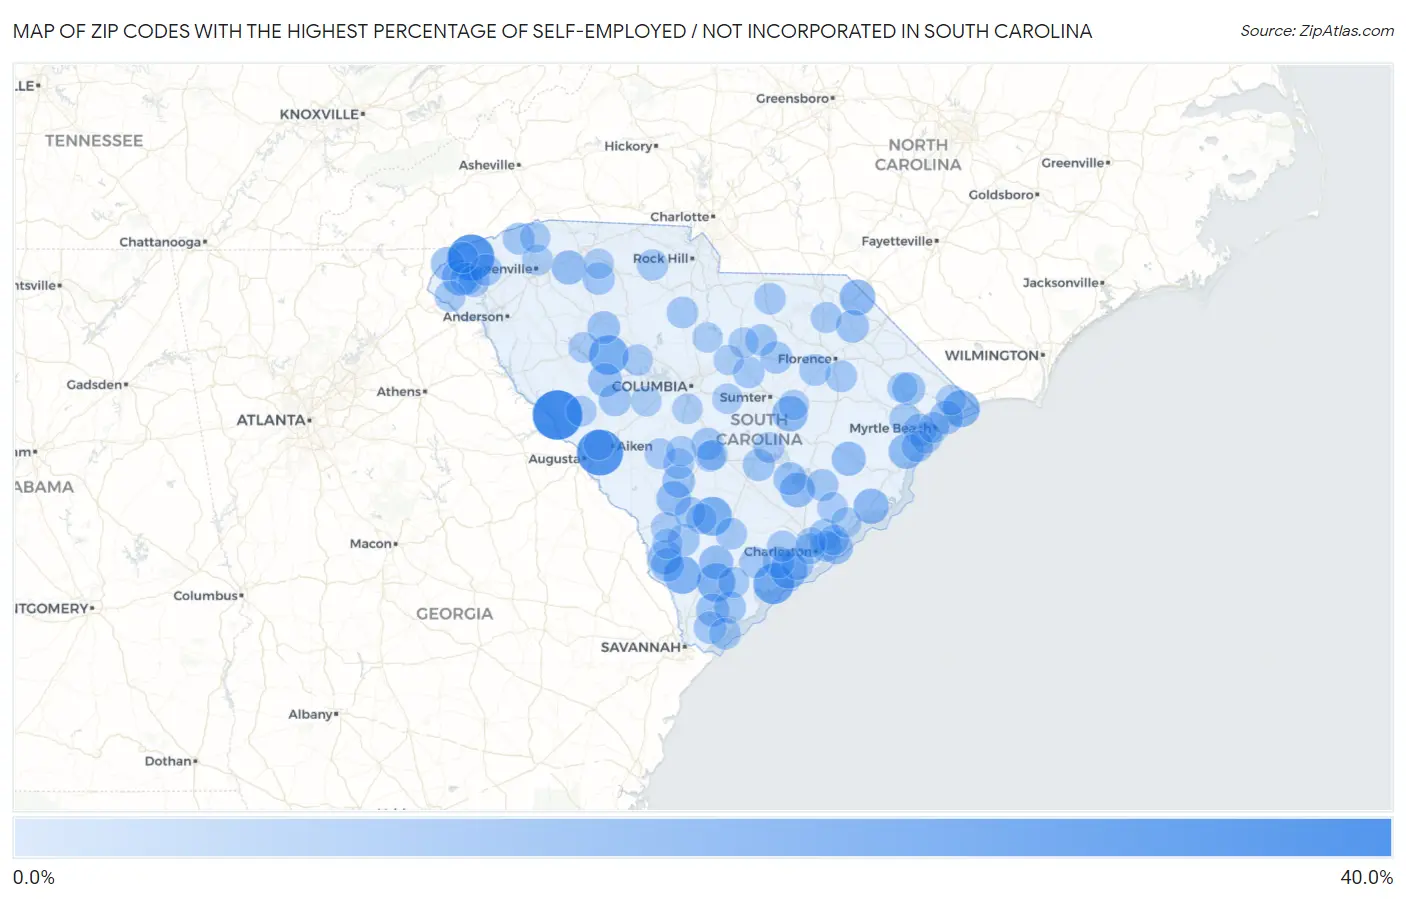
Map of Zip Codes with the Highest Percentage of Self-Employed / Not Incorporated in South Carolina
0.0%
40.0%
Zip Codes with the Highest Percentage of Self-Employed / Not Incorporated in South Carolina
| Zip Code | % Self-Employed / Not Incorporated | vs State | vs National | |
| 1. | 29844 | 32.7% | 5.5%(+27.1)#1 | 5.8%(+26.8)#647 |
| 2. | 29676 | 28.2% | 5.5%(+22.6)#2 | 5.8%(+22.3)#882 |
| 3. | 29834 | 28.1% | 5.5%(+22.6)#3 | 5.8%(+22.3)#889 |
| 4. | 29438 | 20.7% | 5.5%(+15.2)#4 | 5.8%(+14.9)#1,687 |
| 5. | 29145 | 19.1% | 5.5%(+13.6)#5 | 5.8%(+13.3)#1,998 |
| 6. | 29493 | 18.4% | 5.5%(+12.9)#6 | 5.8%(+12.6)#2,194 |
| 7. | 29941 | 17.4% | 5.5%(+11.9)#7 | 5.8%(+11.6)#2,504 |
| 8. | 29934 | 16.7% | 5.5%(+11.2)#8 | 5.8%(+10.9)#2,714 |
| 9. | 29487 | 16.5% | 5.5%(+10.9)#9 | 5.8%(+10.7)#2,811 |
| 10. | 29582 | 15.8% | 5.5%(+10.3)#10 | 5.8%(+9.98)#3,072 |
| 11. | 29691 | 14.7% | 5.5%(+9.20)#11 | 5.8%(+8.92)#3,548 |
| 12. | 29594 | 14.3% | 5.5%(+8.75)#12 | 5.8%(+8.47)#3,755 |
| 13. | 29001 | 13.9% | 5.5%(+8.40)#13 | 5.8%(+8.12)#3,933 |
| 14. | 29458 | 13.7% | 5.5%(+8.12)#14 | 5.8%(+7.84)#4,094 |
| 15. | 29585 | 13.4% | 5.5%(+7.91)#15 | 5.8%(+7.63)#4,217 |
| 16. | 29843 | 12.9% | 5.5%(+7.38)#16 | 5.8%(+7.10)#4,574 |
| 17. | 29469 | 12.9% | 5.5%(+7.37)#17 | 5.8%(+7.09)#4,581 |
| 18. | 29918 | 12.2% | 5.5%(+6.69)#18 | 5.8%(+6.41)#5,094 |
| 19. | 29945 | 12.2% | 5.5%(+6.67)#19 | 5.8%(+6.39)#5,111 |
| 20. | 29375 | 12.1% | 5.5%(+6.59)#20 | 5.8%(+6.31)#5,190 |
| 21. | 29510 | 12.1% | 5.5%(+6.56)#21 | 5.8%(+6.28)#5,210 |
| 22. | 29138 | 11.5% | 5.5%(+6.01)#22 | 5.8%(+5.73)#5,658 |
| 23. | 29572 | 11.5% | 5.5%(+5.96)#23 | 5.8%(+5.68)#5,711 |
| 24. | 29939 | 11.4% | 5.5%(+5.83)#24 | 5.8%(+5.55)#5,840 |
| 25. | 29664 | 11.2% | 5.5%(+5.65)#25 | 5.8%(+5.37)#6,013 |
| 26. | 29451 | 11.1% | 5.5%(+5.61)#26 | 5.8%(+5.32)#6,063 |
| 27. | 29436 | 10.8% | 5.5%(+5.23)#27 | 5.8%(+4.95)#6,464 |
| 28. | 29909 | 10.7% | 5.5%(+5.18)#28 | 5.8%(+4.90)#6,512 |
| 29. | 29511 | 10.6% | 5.5%(+5.11)#29 | 5.8%(+4.83)#6,613 |
| 30. | 29042 | 10.6% | 5.5%(+5.05)#30 | 5.8%(+4.76)#6,672 |
| 31. | 29351 | 10.6% | 5.5%(+5.03)#31 | 5.8%(+4.74)#6,701 |
| 32. | 29516 | 10.5% | 5.5%(+4.94)#32 | 5.8%(+4.66)#6,793 |
| 33. | 29588 | 10.2% | 5.5%(+4.69)#33 | 5.8%(+4.41)#7,102 |
| 34. | 29455 | 10.0% | 5.5%(+4.42)#34 | 5.8%(+4.14)#7,406 |
| 35. | 29166 | 9.9% | 5.5%(+4.41)#35 | 5.8%(+4.13)#7,437 |
| 36. | 29910 | 9.9% | 5.5%(+4.37)#36 | 5.8%(+4.09)#7,478 |
| 37. | 29374 | 9.8% | 5.5%(+4.30)#37 | 5.8%(+4.02)#7,569 |
| 38. | 29696 | 9.8% | 5.5%(+4.26)#38 | 5.8%(+3.98)#7,637 |
| 39. | 29163 | 9.7% | 5.5%(+4.16)#39 | 5.8%(+3.88)#7,753 |
| 40. | 29010 | 9.6% | 5.5%(+4.10)#40 | 5.8%(+3.82)#7,851 |
| 41. | 29902 | 9.5% | 5.5%(+3.97)#41 | 5.8%(+3.69)#8,014 |
| 42. | 29118 | 9.4% | 5.5%(+3.91)#42 | 5.8%(+3.63)#8,083 |
| 43. | 29492 | 9.4% | 5.5%(+3.89)#43 | 5.8%(+3.61)#8,121 |
| 44. | 29431 | 9.4% | 5.5%(+3.86)#44 | 5.8%(+3.58)#8,158 |
| 45. | 29661 | 9.2% | 5.5%(+3.68)#45 | 5.8%(+3.40)#8,439 |
| 46. | 29924 | 9.2% | 5.5%(+3.62)#46 | 5.8%(+3.34)#8,539 |
| 47. | 29575 | 9.1% | 5.5%(+3.58)#47 | 5.8%(+3.30)#8,592 |
| 48. | 29032 | 9.1% | 5.5%(+3.54)#48 | 5.8%(+3.25)#8,673 |
| 49. | 29576 | 9.0% | 5.5%(+3.51)#49 | 5.8%(+3.23)#8,710 |
| 50. | 29928 | 9.0% | 5.5%(+3.46)#50 | 5.8%(+3.18)#8,779 |
| 51. | 29672 | 9.0% | 5.5%(+3.46)#51 | 5.8%(+3.18)#8,780 |
| 52. | 29014 | 9.0% | 5.5%(+3.44)#52 | 5.8%(+3.16)#8,821 |
| 53. | 29541 | 9.0% | 5.5%(+3.42)#53 | 5.8%(+3.14)#8,854 |
| 54. | 29682 | 8.9% | 5.5%(+3.38)#54 | 5.8%(+3.10)#8,919 |
| 55. | 29449 | 8.9% | 5.5%(+3.38)#55 | 5.8%(+3.09)#8,939 |
| 56. | 29686 | 8.9% | 5.5%(+3.37)#56 | 5.8%(+3.08)#8,956 |
| 57. | 29718 | 8.9% | 5.5%(+3.32)#57 | 5.8%(+3.04)#9,046 |
| 58. | 29161 | 8.8% | 5.5%(+3.25)#58 | 5.8%(+2.97)#9,170 |
| 59. | 29488 | 8.8% | 5.5%(+3.25)#59 | 5.8%(+2.97)#9,172 |
| 60. | 29128 | 8.7% | 5.5%(+3.19)#60 | 5.8%(+2.91)#9,284 |
| 61. | 29452 | 8.5% | 5.5%(+3.01)#61 | 5.8%(+2.73)#9,566 |
| 62. | 29464 | 8.5% | 5.5%(+2.94)#62 | 5.8%(+2.66)#9,694 |
| 63. | 29742 | 8.4% | 5.5%(+2.87)#63 | 5.8%(+2.59)#9,838 |
| 64. | 29081 | 8.4% | 5.5%(+2.84)#64 | 5.8%(+2.56)#9,902 |
| 65. | 29527 | 8.3% | 5.5%(+2.74)#65 | 5.8%(+2.46)#10,093 |
| 66. | 29940 | 8.2% | 5.5%(+2.70)#66 | 5.8%(+2.42)#10,174 |
| 67. | 29593 | 8.2% | 5.5%(+2.66)#67 | 5.8%(+2.38)#10,238 |
| 68. | 29470 | 8.2% | 5.5%(+2.66)#68 | 5.8%(+2.38)#10,254 |
| 69. | 29407 | 8.1% | 5.5%(+2.59)#69 | 5.8%(+2.31)#10,394 |
| 70. | 29693 | 8.1% | 5.5%(+2.56)#70 | 5.8%(+2.28)#10,457 |
| 71. | 29127 | 8.1% | 5.5%(+2.55)#71 | 5.8%(+2.27)#10,476 |
| 72. | 29113 | 7.9% | 5.5%(+2.34)#72 | 5.8%(+2.06)#10,902 |
| 73. | 29577 | 7.9% | 5.5%(+2.32)#73 | 5.8%(+2.04)#10,933 |
| 74. | 29115 | 7.9% | 5.5%(+2.32)#74 | 5.8%(+2.04)#10,946 |
| 75. | 29148 | 7.8% | 5.5%(+2.31)#75 | 5.8%(+2.03)#10,953 |
| 76. | 29082 | 7.8% | 5.5%(+2.31)#76 | 5.8%(+2.03)#10,971 |
| 77. | 29332 | 7.8% | 5.5%(+2.31)#77 | 5.8%(+2.03)#10,973 |
| 78. | 29146 | 7.8% | 5.5%(+2.28)#78 | 5.8%(+2.00)#11,042 |
| 79. | 29450 | 7.7% | 5.5%(+2.19)#79 | 5.8%(+1.91)#11,253 |
| 80. | 29827 | 7.7% | 5.5%(+2.18)#80 | 5.8%(+1.90)#11,274 |
| 81. | 29609 | 7.7% | 5.5%(+2.15)#81 | 5.8%(+1.87)#11,342 |
| 82. | 29690 | 7.6% | 5.5%(+2.09)#82 | 5.8%(+1.81)#11,473 |
| 83. | 29824 | 7.6% | 5.5%(+2.06)#83 | 5.8%(+1.78)#11,557 |
| 84. | 29117 | 7.6% | 5.5%(+2.04)#84 | 5.8%(+1.76)#11,596 |
| 85. | 29466 | 7.5% | 5.5%(+1.97)#85 | 5.8%(+1.69)#11,774 |
| 86. | 29070 | 7.5% | 5.5%(+1.92)#86 | 5.8%(+1.64)#11,895 |
| 87. | 29020 | 7.4% | 5.5%(+1.89)#87 | 5.8%(+1.61)#11,951 |
| 88. | 29053 | 7.4% | 5.5%(+1.89)#88 | 5.8%(+1.61)#11,970 |
| 89. | 29923 | 7.4% | 5.5%(+1.87)#89 | 5.8%(+1.59)#12,021 |
| 90. | 29044 | 7.4% | 5.5%(+1.86)#90 | 5.8%(+1.58)#12,049 |
| 91. | 29107 | 7.4% | 5.5%(+1.82)#91 | 5.8%(+1.54)#12,159 |
| 92. | 29051 | 7.3% | 5.5%(+1.80)#92 | 5.8%(+1.52)#12,209 |
| 93. | 29302 | 7.3% | 5.5%(+1.79)#93 | 5.8%(+1.51)#12,228 |
| 94. | 29568 | 7.3% | 5.5%(+1.78)#94 | 5.8%(+1.50)#12,242 |
| 95. | 29405 | 7.3% | 5.5%(+1.76)#95 | 5.8%(+1.48)#12,289 |
| 96. | 29544 | 7.3% | 5.5%(+1.74)#96 | 5.8%(+1.46)#12,336 |
| 97. | 29078 | 7.3% | 5.5%(+1.73)#97 | 5.8%(+1.45)#12,350 |
| 98. | 29829 | 7.3% | 5.5%(+1.73)#98 | 5.8%(+1.45)#12,366 |
| 99. | 29130 | 7.2% | 5.5%(+1.70)#99 | 5.8%(+1.42)#12,425 |
| 100. | 29429 | 7.2% | 5.5%(+1.68)#100 | 5.8%(+1.40)#12,472 |
Common Questions
What are the Top 10 Zip Codes with the Highest Percentage of Self-Employed / Not Incorporated in South Carolina?
Top 10 Zip Codes with the Highest Percentage of Self-Employed / Not Incorporated in South Carolina are:
What zip code has the Highest Percentage of Self-Employed / Not Incorporated in South Carolina?
29844 has the Highest Percentage of Self-Employed / Not Incorporated in South Carolina with 32.7%.
What is the Percentage of Self-Employed / Not Incorporated in the State of South Carolina?
Percentage of Self-Employed / Not Incorporated in South Carolina is 5.5%.
What is the Percentage of Self-Employed / Not Incorporated in the United States?
Percentage of Self-Employed / Not Incorporated in the United States is 5.8%.