Zip Codes with the Highest Percentage of Self-Employed / Not Incorporated in Hawaii
RELATED REPORTS & OPTIONS
Self-Employed / Not Incorporated
Hawaii
Compare Zip Codes
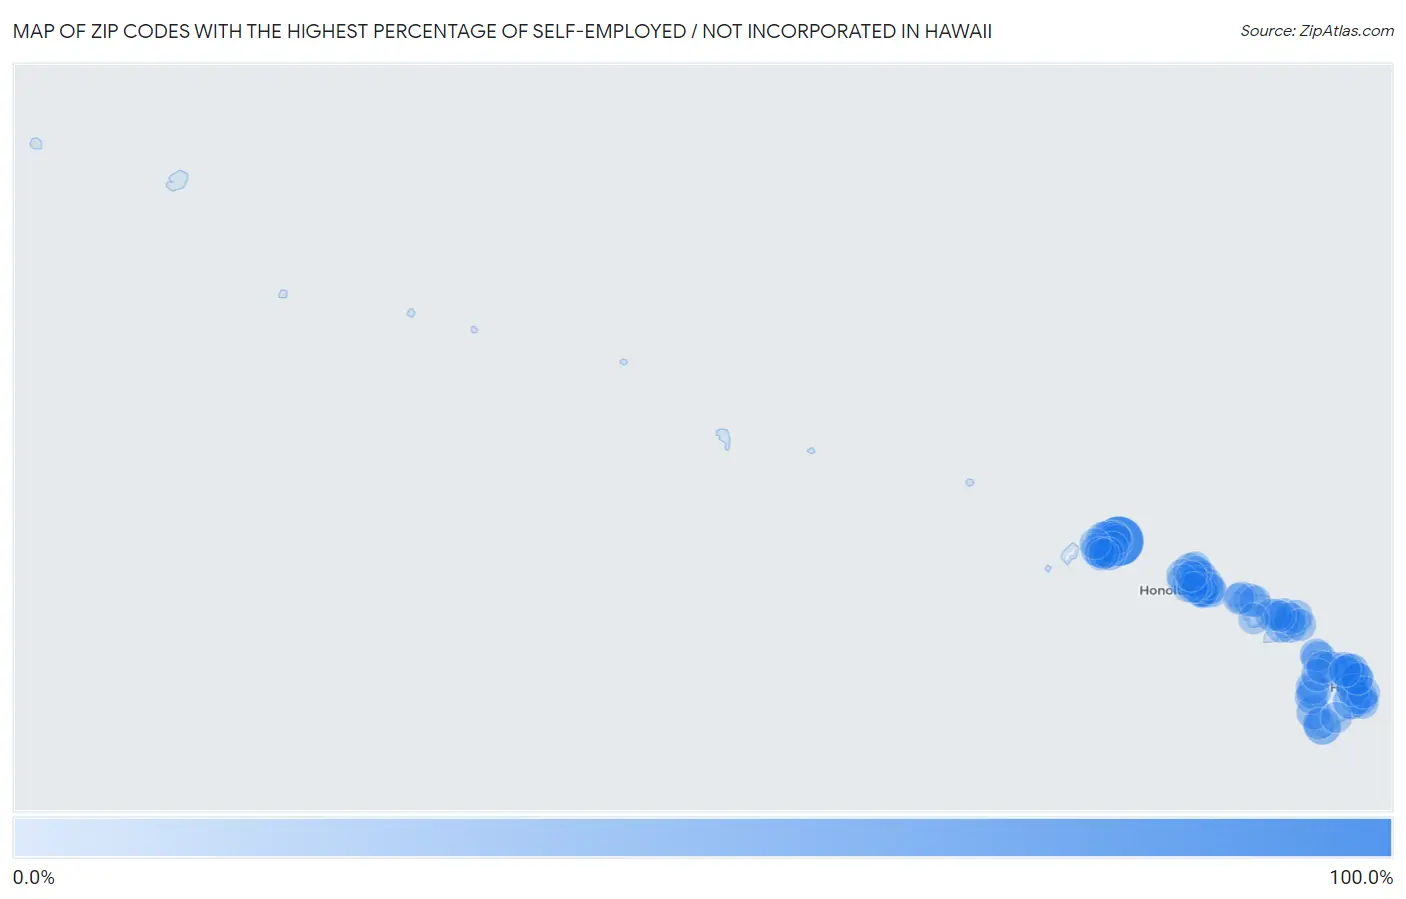
Map of Zip Codes with the Highest Percentage of Self-Employed / Not Incorporated in Hawaii
0.0%
100.0%
Zip Codes with the Highest Percentage of Self-Employed / Not Incorporated in Hawaii
| Zip Code | % Self-Employed / Not Incorporated | vs State | vs National | |
| 1. | 96751 | 83.2% | 6.3%(+76.9)#1 | 5.8%(+77.4)#69 |
| 2. | 96772 | 28.0% | 6.3%(+21.7)#2 | 5.8%(+22.2)#893 |
| 3. | 96722 | 26.1% | 6.3%(+19.8)#3 | 5.8%(+20.3)#1,033 |
| 4. | 96785 | 25.0% | 6.3%(+18.6)#4 | 5.8%(+19.2)#1,157 |
| 5. | 96780 | 21.5% | 6.3%(+15.1)#5 | 5.8%(+15.7)#1,561 |
| 6. | 96773 | 19.0% | 6.3%(+12.6)#6 | 5.8%(+13.1)#2,045 |
| 7. | 96755 | 18.6% | 6.3%(+12.3)#7 | 5.8%(+12.8)#2,131 |
| 8. | 96727 | 17.2% | 6.3%(+10.8)#8 | 5.8%(+11.3)#2,584 |
| 9. | 96714 | 17.2% | 6.3%(+10.8)#9 | 5.8%(+11.3)#2,585 |
| 10. | 96760 | 17.0% | 6.3%(+10.7)#10 | 5.8%(+11.2)#2,641 |
| 11. | 96704 | 16.6% | 6.3%(+10.2)#11 | 5.8%(+10.8)#2,782 |
| 12. | 96725 | 15.9% | 6.3%(+9.62)#12 | 5.8%(+10.1)#2,996 |
| 13. | 96754 | 15.6% | 6.3%(+9.29)#13 | 5.8%(+9.80)#3,154 |
| 14. | 96741 | 15.0% | 6.3%(+8.70)#14 | 5.8%(+9.21)#3,411 |
| 15. | 96781 | 14.4% | 6.3%(+8.02)#15 | 5.8%(+8.54)#3,716 |
| 16. | 96712 | 13.9% | 6.3%(+7.60)#16 | 5.8%(+8.11)#3,936 |
| 17. | 96771 | 13.6% | 6.3%(+7.28)#17 | 5.8%(+7.79)#4,124 |
| 18. | 96776 | 13.2% | 6.3%(+6.90)#18 | 5.8%(+7.42)#4,361 |
| 19. | 96779 | 13.1% | 6.3%(+6.80)#19 | 5.8%(+7.32)#4,436 |
| 20. | 96716 | 12.9% | 6.3%(+6.53)#20 | 5.8%(+7.04)#4,614 |
| 21. | 96728 | 12.8% | 6.3%(+6.48)#21 | 5.8%(+6.99)#4,659 |
| 22. | 96746 | 12.4% | 6.3%(+6.08)#22 | 5.8%(+6.60)#4,953 |
| 23. | 96740 | 12.4% | 6.3%(+6.08)#23 | 5.8%(+6.59)#4,966 |
| 24. | 96796 | 12.3% | 6.3%(+5.94)#24 | 5.8%(+6.45)#5,064 |
| 25. | 96757 | 11.6% | 6.3%(+5.27)#25 | 5.8%(+5.79)#5,617 |
| 26. | 96790 | 11.6% | 6.3%(+5.24)#26 | 5.8%(+5.75)#5,645 |
| 27. | 96756 | 11.5% | 6.3%(+5.12)#27 | 5.8%(+5.63)#5,766 |
| 28. | 96753 | 11.1% | 6.3%(+4.75)#28 | 5.8%(+5.26)#6,130 |
| 29. | 96717 | 10.5% | 6.3%(+4.20)#29 | 5.8%(+4.72)#6,730 |
| 30. | 96703 | 10.5% | 6.3%(+4.17)#30 | 5.8%(+4.69)#6,767 |
| 31. | 96750 | 10.4% | 6.3%(+4.05)#31 | 5.8%(+4.57)#6,904 |
| 32. | 96719 | 10.2% | 6.3%(+3.85)#32 | 5.8%(+4.37)#7,133 |
| 33. | 96708 | 10.1% | 6.3%(+3.72)#33 | 5.8%(+4.23)#7,297 |
| 34. | 96738 | 10.0% | 6.3%(+3.65)#34 | 5.8%(+4.16)#7,389 |
| 35. | 96743 | 9.8% | 6.3%(+3.50)#35 | 5.8%(+4.02)#7,583 |
| 36. | 96778 | 9.3% | 6.3%(+3.01)#36 | 5.8%(+3.52)#8,255 |
| 37. | 96764 | 9.1% | 6.3%(+2.81)#37 | 5.8%(+3.33)#8,555 |
| 38. | 96761 | 9.0% | 6.3%(+2.71)#38 | 5.8%(+3.23)#8,703 |
| 39. | 96768 | 8.2% | 6.3%(+1.89)#39 | 5.8%(+2.40)#10,203 |
| 40. | 96720 | 8.1% | 6.3%(+1.75)#40 | 5.8%(+2.26)#10,482 |
| 41. | 96821 | 7.9% | 6.3%(+1.53)#41 | 5.8%(+2.04)#10,927 |
| 42. | 96825 | 7.8% | 6.3%(+1.49)#42 | 5.8%(+2.01)#11,019 |
| 43. | 96749 | 7.7% | 6.3%(+1.39)#43 | 5.8%(+1.90)#11,255 |
| 44. | 96731 | 7.7% | 6.3%(+1.35)#44 | 5.8%(+1.87)#11,346 |
| 45. | 96783 | 7.6% | 6.3%(+1.26)#45 | 5.8%(+1.78)#11,549 |
| 46. | 96713 | 7.6% | 6.3%(+1.25)#46 | 5.8%(+1.76)#11,589 |
| 47. | 96816 | 7.4% | 6.3%(+1.11)#47 | 5.8%(+1.62)#11,922 |
| 48. | 96791 | 7.4% | 6.3%(+1.06)#48 | 5.8%(+1.58)#12,060 |
| 49. | 96817 | 6.8% | 6.3%(+0.426)#49 | 5.8%(+0.942)#13,705 |
| 50. | 96774 | 6.7% | 6.3%(+0.335)#50 | 5.8%(+0.851)#13,949 |
| 51. | 96813 | 6.6% | 6.3%(+0.228)#51 | 5.8%(+0.744)#14,269 |
| 52. | 96822 | 6.5% | 6.3%(+0.156)#52 | 5.8%(+0.673)#14,503 |
| 53. | 96766 | 6.4% | 6.3%(+0.103)#53 | 5.8%(+0.619)#14,673 |
| 54. | 96737 | 6.1% | 6.3%(-0.244)#54 | 5.8%(+0.272)#15,770 |
| 55. | 96814 | 6.0% | 6.3%(-0.347)#55 | 5.8%(+0.169)#16,122 |
| 56. | 96729 | 5.9% | 6.3%(-0.426)#56 | 5.8%(+0.090)#16,371 |
| 57. | 96793 | 5.7% | 6.3%(-0.588)#57 | 5.8%(-0.072)#16,884 |
| 58. | 96819 | 5.5% | 6.3%(-0.786)#58 | 5.8%(-0.270)#17,622 |
| 59. | 96815 | 5.4% | 6.3%(-0.916)#59 | 5.8%(-0.399)#18,071 |
| 60. | 96744 | 5.4% | 6.3%(-0.974)#60 | 5.8%(-0.458)#18,298 |
| 61. | 96730 | 5.2% | 6.3%(-1.08)#61 | 5.8%(-0.566)#18,722 |
| 62. | 96826 | 5.2% | 6.3%(-1.14)#62 | 5.8%(-0.621)#18,937 |
| 63. | 96748 | 5.0% | 6.3%(-1.36)#63 | 5.8%(-0.845)#19,773 |
| 64. | 96770 | 4.9% | 6.3%(-1.39)#64 | 5.8%(-0.877)#19,899 |
| 65. | 96732 | 4.8% | 6.3%(-1.54)#65 | 5.8%(-1.02)#20,432 |
| 66. | 96782 | 4.8% | 6.3%(-1.55)#66 | 5.8%(-1.03)#20,477 |
| 67. | 96734 | 4.7% | 6.3%(-1.62)#67 | 5.8%(-1.10)#20,731 |
| 68. | 96707 | 4.7% | 6.3%(-1.68)#68 | 5.8%(-1.16)#20,962 |
| 69. | 96797 | 4.5% | 6.3%(-1.81)#69 | 5.8%(-1.30)#21,501 |
| 70. | 96701 | 4.3% | 6.3%(-2.04)#70 | 5.8%(-1.52)#22,341 |
| 71. | 96789 | 4.2% | 6.3%(-2.08)#71 | 5.8%(-1.57)#22,509 |
| 72. | 96795 | 3.8% | 6.3%(-2.51)#72 | 5.8%(-1.99)#23,990 |
| 73. | 96762 | 3.8% | 6.3%(-2.54)#73 | 5.8%(-2.03)#24,115 |
| 74. | 96777 | 3.4% | 6.3%(-2.96)#74 | 5.8%(-2.44)#25,388 |
| 75. | 96792 | 3.0% | 6.3%(-3.35)#75 | 5.8%(-2.83)#26,414 |
| 76. | 96765 | 3.0% | 6.3%(-3.37)#76 | 5.8%(-2.85)#26,469 |
| 77. | 96818 | 2.7% | 6.3%(-3.59)#77 | 5.8%(-3.08)#26,951 |
| 78. | 96706 | 2.7% | 6.3%(-3.60)#78 | 5.8%(-3.08)#26,973 |
| 79. | 96747 | 2.7% | 6.3%(-3.65)#79 | 5.8%(-3.13)#27,061 |
| 80. | 96786 | 2.6% | 6.3%(-3.76)#80 | 5.8%(-3.24)#27,293 |
| 81. | 96752 | 2.4% | 6.3%(-3.89)#81 | 5.8%(-3.37)#27,515 |
| 82. | 96705 | 2.2% | 6.3%(-4.13)#82 | 5.8%(-3.61)#27,945 |
| 83. | 96763 | 2.2% | 6.3%(-4.15)#83 | 5.8%(-3.64)#27,972 |
1
Common Questions
What are the Top 10 Zip Codes with the Highest Percentage of Self-Employed / Not Incorporated in Hawaii?
Top 10 Zip Codes with the Highest Percentage of Self-Employed / Not Incorporated in Hawaii are:
What zip code has the Highest Percentage of Self-Employed / Not Incorporated in Hawaii?
96751 has the Highest Percentage of Self-Employed / Not Incorporated in Hawaii with 83.2%.
What is the Percentage of Self-Employed / Not Incorporated in the State of Hawaii?
Percentage of Self-Employed / Not Incorporated in Hawaii is 6.3%.
What is the Percentage of Self-Employed / Not Incorporated in the United States?
Percentage of Self-Employed / Not Incorporated in the United States is 5.8%.