Zip Codes with the Highest Percentage of Self-Employed / Not Incorporated in Wisconsin
RELATED REPORTS & OPTIONS
Self-Employed / Not Incorporated
Wisconsin
Compare Zip Codes
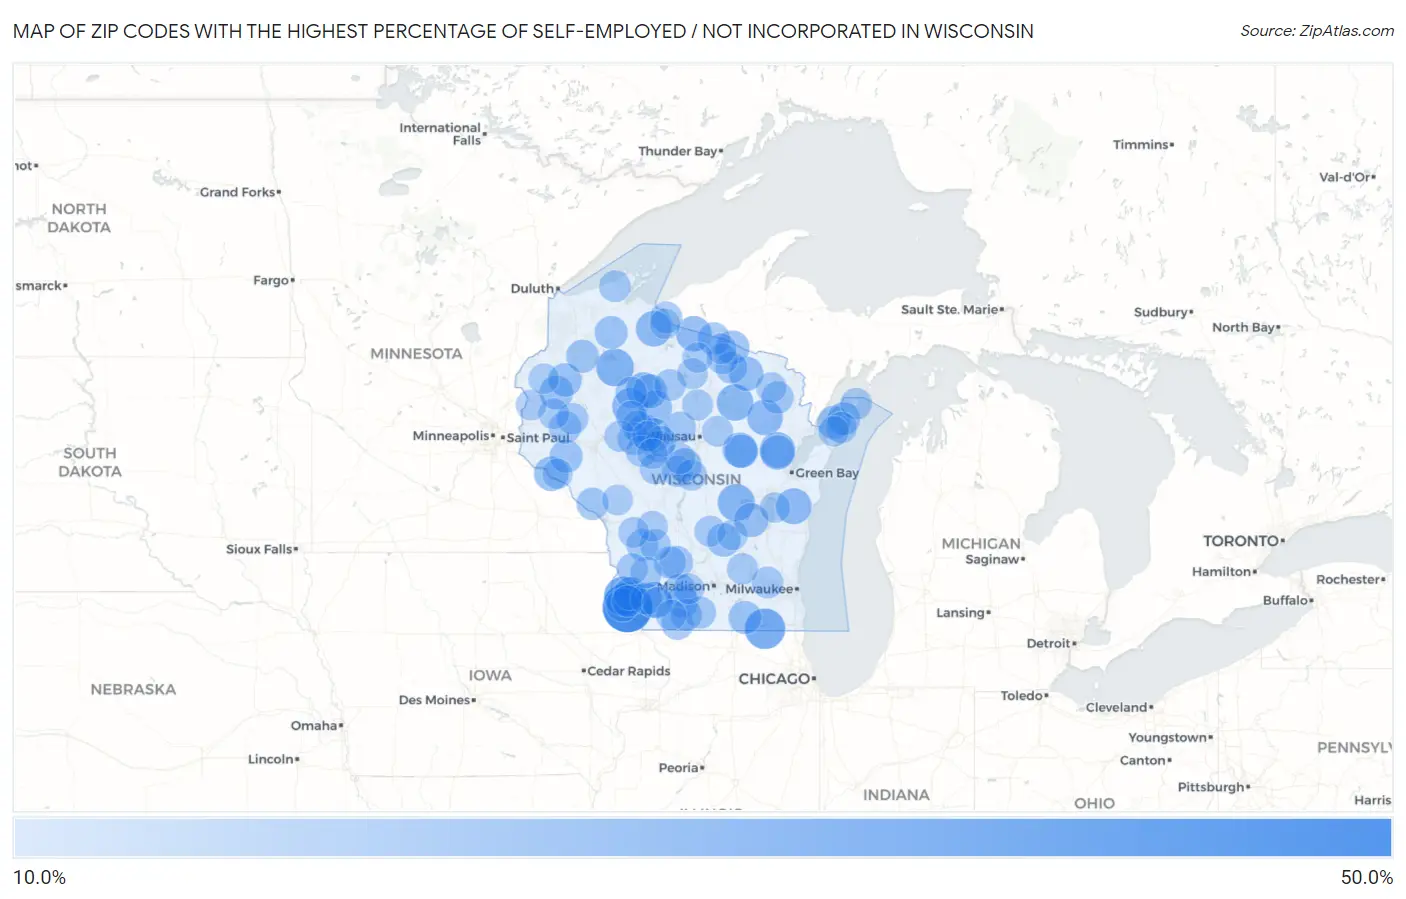
Map of Zip Codes with the Highest Percentage of Self-Employed / Not Incorporated in Wisconsin
10.0%
50.0%
Zip Codes with the Highest Percentage of Self-Employed / Not Incorporated in Wisconsin
| Zip Code | % Self-Employed / Not Incorporated | vs State | vs National | |
| 1. | 53802 | 41.4% | 5.1%(+36.3)#1 | 5.8%(+35.6)#374 |
| 2. | 53195 | 27.3% | 5.1%(+22.2)#2 | 5.8%(+21.5)#945 |
| 3. | 53817 | 25.9% | 5.1%(+20.9)#3 | 5.8%(+20.1)#1,048 |
| 4. | 54862 | 23.0% | 5.1%(+18.0)#4 | 5.8%(+17.2)#1,353 |
| 5. | 54967 | 22.2% | 5.1%(+17.1)#5 | 5.8%(+16.3)#1,456 |
| 6. | 54462 | 21.4% | 5.1%(+16.4)#6 | 5.8%(+15.6)#1,571 |
| 7. | 54207 | 20.5% | 5.1%(+15.4)#7 | 5.8%(+14.6)#1,731 |
| 8. | 53554 | 20.3% | 5.1%(+15.2)#8 | 5.8%(+14.5)#1,753 |
| 9. | 54766 | 20.2% | 5.1%(+15.1)#9 | 5.8%(+14.3)#1,778 |
| 10. | 54149 | 20.1% | 5.1%(+15.1)#10 | 5.8%(+14.3)#1,780 |
| 11. | 54127 | 20.0% | 5.1%(+14.9)#11 | 5.8%(+14.2)#1,825 |
| 12. | 54565 | 20.0% | 5.1%(+14.9)#12 | 5.8%(+14.2)#1,827 |
| 13. | 54557 | 19.7% | 5.1%(+14.6)#13 | 5.8%(+13.9)#1,880 |
| 14. | 54537 | 19.5% | 5.1%(+14.4)#14 | 5.8%(+13.7)#1,918 |
| 15. | 54978 | 18.9% | 5.1%(+13.8)#15 | 5.8%(+13.1)#2,057 |
| 16. | 54769 | 18.3% | 5.1%(+13.2)#16 | 5.8%(+12.5)#2,235 |
| 17. | 54498 | 18.2% | 5.1%(+13.2)#17 | 5.8%(+12.4)#2,249 |
| 18. | 54511 | 18.1% | 5.1%(+13.1)#18 | 5.8%(+12.3)#2,280 |
| 19. | 54137 | 18.1% | 5.1%(+13.0)#19 | 5.8%(+12.3)#2,286 |
| 20. | 54490 | 17.8% | 5.1%(+12.8)#20 | 5.8%(+12.0)#2,361 |
| 21. | 54515 | 17.8% | 5.1%(+12.7)#21 | 5.8%(+12.0)#2,372 |
| 22. | 54964 | 17.8% | 5.1%(+12.7)#22 | 5.8%(+11.9)#2,385 |
| 23. | 54422 | 17.7% | 5.1%(+12.7)#23 | 5.8%(+11.9)#2,389 |
| 24. | 54554 | 17.4% | 5.1%(+12.3)#24 | 5.8%(+11.5)#2,513 |
| 25. | 54826 | 17.2% | 5.1%(+12.1)#25 | 5.8%(+11.4)#2,582 |
| 26. | 53926 | 16.9% | 5.1%(+11.9)#26 | 5.8%(+11.1)#2,647 |
| 27. | 54212 | 16.9% | 5.1%(+11.8)#27 | 5.8%(+11.1)#2,664 |
| 28. | 54813 | 16.8% | 5.1%(+11.7)#28 | 5.8%(+11.0)#2,685 |
| 29. | 54454 | 16.7% | 5.1%(+11.6)#29 | 5.8%(+10.9)#2,721 |
| 30. | 54948 | 16.7% | 5.1%(+11.6)#30 | 5.8%(+10.9)#2,750 |
| 31. | 53943 | 16.5% | 5.1%(+11.4)#31 | 5.8%(+10.7)#2,801 |
| 32. | 53810 | 16.5% | 5.1%(+11.4)#32 | 5.8%(+10.6)#2,823 |
| 33. | 54234 | 16.3% | 5.1%(+11.2)#33 | 5.8%(+10.4)#2,878 |
| 34. | 54821 | 16.1% | 5.1%(+11.1)#34 | 5.8%(+10.3)#2,923 |
| 35. | 54737 | 16.1% | 5.1%(+11.0)#35 | 5.8%(+10.3)#2,930 |
| 36. | 53505 | 16.0% | 5.1%(+11.0)#36 | 5.8%(+10.2)#2,958 |
| 37. | 53816 | 16.0% | 5.1%(+11.0)#37 | 5.8%(+10.2)#2,965 |
| 38. | 54875 | 15.8% | 5.1%(+10.7)#38 | 5.8%(+9.97)#3,076 |
| 39. | 54540 | 15.7% | 5.1%(+10.6)#39 | 5.8%(+9.86)#3,133 |
| 40. | 53582 | 15.2% | 5.1%(+10.1)#40 | 5.8%(+9.39)#3,321 |
| 41. | 54725 | 15.2% | 5.1%(+10.1)#41 | 5.8%(+9.38)#3,330 |
| 42. | 54104 | 15.0% | 5.1%(+9.96)#42 | 5.8%(+9.21)#3,412 |
| 43. | 54771 | 15.0% | 5.1%(+9.88)#43 | 5.8%(+9.13)#3,443 |
| 44. | 53544 | 14.9% | 5.1%(+9.87)#44 | 5.8%(+9.12)#3,450 |
| 45. | 54625 | 14.9% | 5.1%(+9.82)#45 | 5.8%(+9.08)#3,473 |
| 46. | 53541 | 14.8% | 5.1%(+9.75)#46 | 5.8%(+9.01)#3,505 |
| 47. | 53570 | 14.7% | 5.1%(+9.61)#47 | 5.8%(+8.87)#3,575 |
| 48. | 54525 | 14.7% | 5.1%(+9.58)#48 | 5.8%(+8.84)#3,588 |
| 49. | 53937 | 14.6% | 5.1%(+9.53)#49 | 5.8%(+8.79)#3,607 |
| 50. | 53504 | 14.5% | 5.1%(+9.45)#50 | 5.8%(+8.71)#3,640 |
| 51. | 54639 | 14.4% | 5.1%(+9.37)#51 | 5.8%(+8.62)#3,680 |
| 52. | 54562 | 14.3% | 5.1%(+9.20)#52 | 5.8%(+8.45)#3,765 |
| 53. | 54411 | 14.2% | 5.1%(+9.13)#53 | 5.8%(+8.39)#3,800 |
| 54. | 54827 | 14.2% | 5.1%(+9.11)#54 | 5.8%(+8.36)#3,816 |
| 55. | 54634 | 14.2% | 5.1%(+9.08)#55 | 5.8%(+8.34)#3,826 |
| 56. | 54246 | 14.1% | 5.1%(+9.03)#56 | 5.8%(+8.29)#3,851 |
| 57. | 53825 | 14.1% | 5.1%(+8.99)#57 | 5.8%(+8.25)#3,870 |
| 58. | 53069 | 14.1% | 5.1%(+8.99)#58 | 5.8%(+8.24)#3,872 |
| 59. | 54763 | 14.0% | 5.1%(+8.96)#59 | 5.8%(+8.22)#3,883 |
| 60. | 54526 | 14.0% | 5.1%(+8.93)#60 | 5.8%(+8.19)#3,895 |
| 61. | 54513 | 14.0% | 5.1%(+8.89)#61 | 5.8%(+8.15)#3,915 |
| 62. | 53518 | 13.9% | 5.1%(+8.82)#62 | 5.8%(+8.07)#3,962 |
| 63. | 54410 | 13.7% | 5.1%(+8.63)#63 | 5.8%(+7.89)#4,063 |
| 64. | 53804 | 13.7% | 5.1%(+8.63)#64 | 5.8%(+7.89)#4,064 |
| 65. | 54202 | 13.7% | 5.1%(+8.58)#65 | 5.8%(+7.84)#4,095 |
| 66. | 54447 | 13.6% | 5.1%(+8.52)#66 | 5.8%(+7.78)#4,134 |
| 67. | 54631 | 13.6% | 5.1%(+8.48)#67 | 5.8%(+7.73)#4,156 |
| 68. | 54475 | 13.3% | 5.1%(+8.27)#68 | 5.8%(+7.53)#4,279 |
| 69. | 53579 | 13.3% | 5.1%(+8.27)#69 | 5.8%(+7.53)#4,282 |
| 70. | 54726 | 13.3% | 5.1%(+8.25)#70 | 5.8%(+7.51)#4,296 |
| 71. | 54488 | 13.3% | 5.1%(+8.19)#71 | 5.8%(+7.45)#4,337 |
| 72. | 54521 | 13.2% | 5.1%(+8.17)#72 | 5.8%(+7.43)#4,356 |
| 73. | 53953 | 13.2% | 5.1%(+8.16)#73 | 5.8%(+7.42)#4,364 |
| 74. | 53580 | 13.2% | 5.1%(+8.11)#74 | 5.8%(+7.37)#4,406 |
| 75. | 54442 | 13.2% | 5.1%(+8.09)#75 | 5.8%(+7.35)#4,412 |
| 76. | 54437 | 13.1% | 5.1%(+8.08)#76 | 5.8%(+7.33)#4,427 |
| 77. | 54436 | 13.1% | 5.1%(+8.04)#77 | 5.8%(+7.30)#4,451 |
| 78. | 54412 | 13.0% | 5.1%(+7.92)#78 | 5.8%(+7.18)#4,531 |
| 79. | 54433 | 13.0% | 5.1%(+7.89)#79 | 5.8%(+7.15)#4,553 |
| 80. | 54421 | 12.9% | 5.1%(+7.86)#80 | 5.8%(+7.11)#4,567 |
| 81. | 54519 | 12.9% | 5.1%(+7.79)#81 | 5.8%(+7.04)#4,613 |
| 82. | 54670 | 12.8% | 5.1%(+7.76)#82 | 5.8%(+7.02)#4,635 |
| 83. | 54005 | 12.8% | 5.1%(+7.75)#83 | 5.8%(+7.00)#4,646 |
| 84. | 54531 | 12.8% | 5.1%(+7.71)#84 | 5.8%(+6.97)#4,670 |
| 85. | 54009 | 12.8% | 5.1%(+7.70)#85 | 5.8%(+6.96)#4,672 |
| 86. | 54619 | 12.7% | 5.1%(+7.67)#86 | 5.8%(+6.93)#4,698 |
| 87. | 53946 | 12.7% | 5.1%(+7.63)#87 | 5.8%(+6.89)#4,727 |
| 88. | 54408 | 12.7% | 5.1%(+7.62)#88 | 5.8%(+6.88)#4,737 |
| 89. | 53517 | 12.6% | 5.1%(+7.54)#89 | 5.8%(+6.80)#4,791 |
| 90. | 54642 | 12.6% | 5.1%(+7.50)#90 | 5.8%(+6.76)#4,830 |
| 91. | 54460 | 12.5% | 5.1%(+7.44)#91 | 5.8%(+6.69)#4,870 |
| 92. | 54837 | 12.5% | 5.1%(+7.42)#92 | 5.8%(+6.68)#4,907 |
| 93. | 54446 | 12.4% | 5.1%(+7.37)#93 | 5.8%(+6.63)#4,936 |
| 94. | 53530 | 12.4% | 5.1%(+7.37)#94 | 5.8%(+6.63)#4,938 |
| 95. | 54125 | 12.3% | 5.1%(+7.27)#95 | 5.8%(+6.52)#5,009 |
| 96. | 54568 | 12.3% | 5.1%(+7.23)#96 | 5.8%(+6.49)#5,040 |
| 97. | 54209 | 12.3% | 5.1%(+7.22)#97 | 5.8%(+6.47)#5,050 |
| 98. | 54534 | 12.3% | 5.1%(+7.18)#98 | 5.8%(+6.44)#5,070 |
| 99. | 53088 | 12.2% | 5.1%(+7.17)#99 | 5.8%(+6.43)#5,081 |
| 100. | 54759 | 12.1% | 5.1%(+7.07)#100 | 5.8%(+6.33)#5,171 |
Common Questions
What are the Top 10 Zip Codes with the Highest Percentage of Self-Employed / Not Incorporated in Wisconsin?
Top 10 Zip Codes with the Highest Percentage of Self-Employed / Not Incorporated in Wisconsin are:
What zip code has the Highest Percentage of Self-Employed / Not Incorporated in Wisconsin?
53802 has the Highest Percentage of Self-Employed / Not Incorporated in Wisconsin with 41.4%.
What is the Percentage of Self-Employed / Not Incorporated in the State of Wisconsin?
Percentage of Self-Employed / Not Incorporated in Wisconsin is 5.1%.
What is the Percentage of Self-Employed / Not Incorporated in the United States?
Percentage of Self-Employed / Not Incorporated in the United States is 5.8%.