Zip Codes with the Highest Percentage of Self-Employed / Not Incorporated in Arizona
RELATED REPORTS & OPTIONS
Self-Employed / Not Incorporated
Arizona
Compare Zip Codes
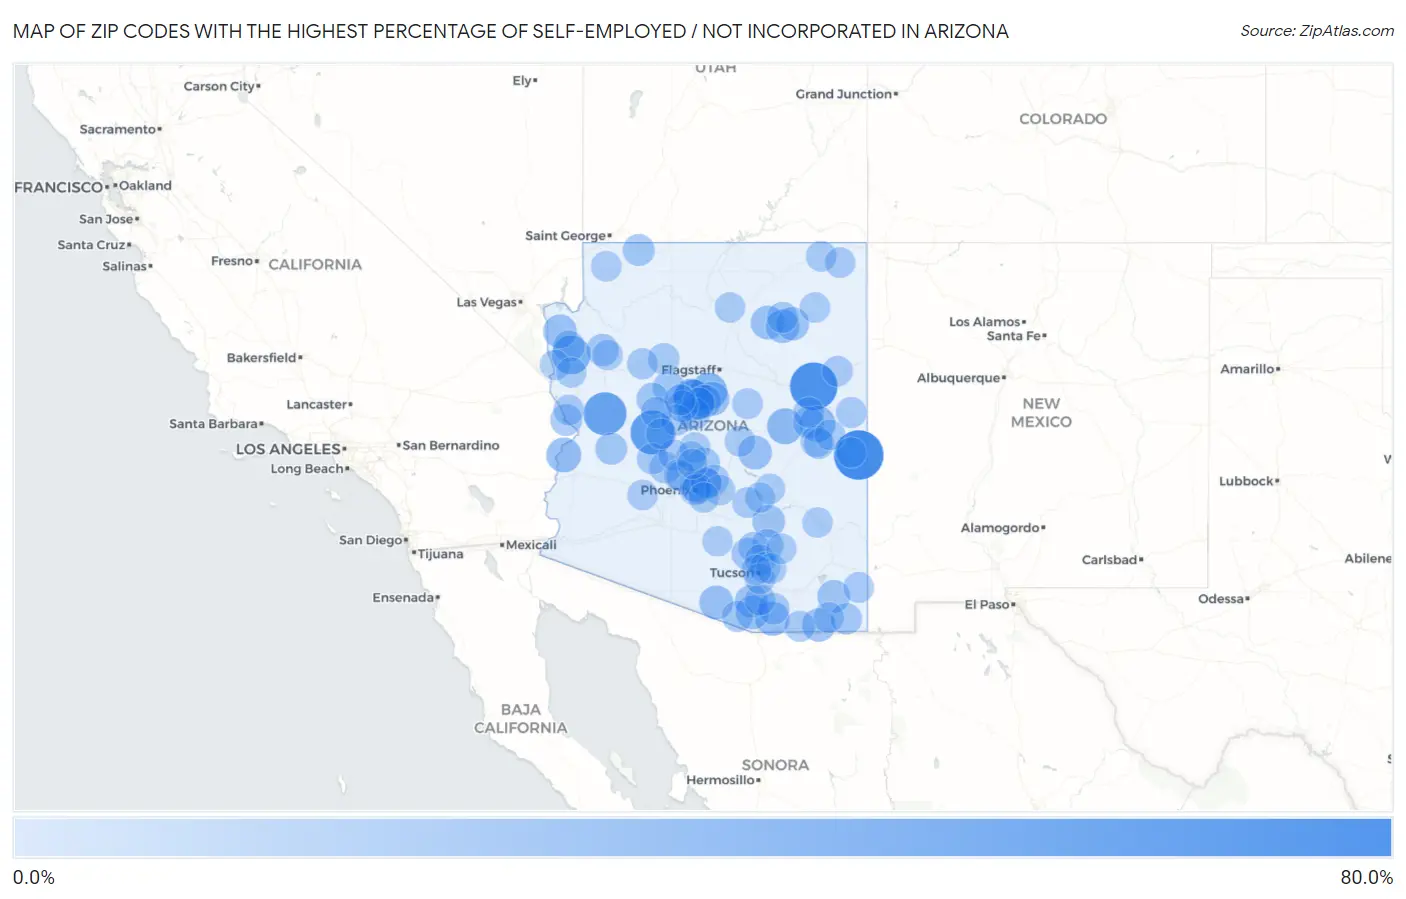
Map of Zip Codes with the Highest Percentage of Self-Employed / Not Incorporated in Arizona
0.0%
80.0%
Zip Codes with the Highest Percentage of Self-Employed / Not Incorporated in Arizona
| Zip Code | % Self-Employed / Not Incorporated | vs State | vs National | |
| 1. | 85932 | 72.7% | 5.9%(+66.9)#1 | 5.8%(+66.9)#91 |
| 2. | 86029 | 65.7% | 5.9%(+59.9)#2 | 5.8%(+59.9)#115 |
| 3. | 85362 | 53.7% | 5.9%(+47.8)#3 | 5.8%(+47.9)#179 |
| 4. | 85360 | 50.0% | 5.9%(+44.1)#4 | 5.8%(+44.2)#221 |
| 5. | 86331 | 40.8% | 5.9%(+35.0)#5 | 5.8%(+35.0)#391 |
| 6. | 86431 | 35.5% | 5.9%(+29.6)#6 | 5.8%(+29.7)#545 |
| 7. | 86336 | 29.1% | 5.9%(+23.2)#7 | 5.8%(+23.3)#821 |
| 8. | 85912 | 26.2% | 5.9%(+20.3)#8 | 5.8%(+20.4)#1,030 |
| 9. | 85933 | 26.1% | 5.9%(+20.2)#9 | 5.8%(+20.2)#1,037 |
| 10. | 86324 | 23.5% | 5.9%(+17.6)#10 | 5.8%(+17.7)#1,309 |
| 11. | 85371 | 22.5% | 5.9%(+16.6)#11 | 5.8%(+16.7)#1,417 |
| 12. | 85624 | 20.0% | 5.9%(+14.1)#12 | 5.8%(+14.2)#1,802 |
| 13. | 85639 | 19.4% | 5.9%(+13.5)#13 | 5.8%(+13.6)#1,932 |
| 14. | 86351 | 19.2% | 5.9%(+13.4)#14 | 5.8%(+13.4)#1,972 |
| 15. | 85554 | 19.2% | 5.9%(+13.3)#15 | 5.8%(+13.4)#1,982 |
| 16. | 85646 | 18.8% | 5.9%(+12.9)#16 | 5.8%(+12.9)#2,095 |
| 17. | 86030 | 18.4% | 5.9%(+12.5)#17 | 5.8%(+12.6)#2,207 |
| 18. | 86445 | 18.3% | 5.9%(+12.5)#18 | 5.8%(+12.5)#2,232 |
| 19. | 86043 | 18.2% | 5.9%(+12.4)#19 | 5.8%(+12.4)#2,255 |
| 20. | 85603 | 17.8% | 5.9%(+12.0)#20 | 5.8%(+12.0)#2,370 |
| 21. | 86042 | 17.1% | 5.9%(+11.3)#21 | 5.8%(+11.3)#2,597 |
| 22. | 85622 | 16.2% | 5.9%(+10.3)#22 | 5.8%(+10.4)#2,906 |
| 23. | 86325 | 15.7% | 5.9%(+9.80)#23 | 5.8%(+9.85)#3,135 |
| 24. | 85625 | 15.5% | 5.9%(+9.65)#24 | 5.8%(+9.69)#3,197 |
| 25. | 85135 | 15.3% | 5.9%(+9.42)#25 | 5.8%(+9.46)#3,292 |
| 26. | 85377 | 14.9% | 5.9%(+9.05)#26 | 5.8%(+9.09)#3,465 |
| 27. | 86327 | 14.7% | 5.9%(+8.81)#27 | 5.8%(+8.86)#3,579 |
| 28. | 86334 | 13.6% | 5.9%(+7.78)#28 | 5.8%(+7.83)#4,100 |
| 29. | 86411 | 13.5% | 5.9%(+7.67)#29 | 5.8%(+7.71)#4,170 |
| 30. | 86326 | 13.5% | 5.9%(+7.66)#30 | 5.8%(+7.70)#4,176 |
| 31. | 86305 | 13.3% | 5.9%(+7.39)#31 | 5.8%(+7.44)#4,347 |
| 32. | 85658 | 12.6% | 5.9%(+6.78)#32 | 5.8%(+6.82)#4,772 |
| 33. | 86021 | 12.6% | 5.9%(+6.77)#33 | 5.8%(+6.81)#4,778 |
| 34. | 85623 | 12.6% | 5.9%(+6.73)#34 | 5.8%(+6.78)#4,809 |
| 35. | 86403 | 12.6% | 5.9%(+6.70)#35 | 5.8%(+6.74)#4,842 |
| 36. | 85357 | 12.4% | 5.9%(+6.59)#36 | 5.8%(+6.63)#4,929 |
| 37. | 85939 | 12.3% | 5.9%(+6.42)#37 | 5.8%(+6.47)#5,056 |
| 38. | 85361 | 12.2% | 5.9%(+6.29)#38 | 5.8%(+6.34)#5,166 |
| 39. | 86441 | 12.1% | 5.9%(+6.19)#39 | 5.8%(+6.24)#5,250 |
| 40. | 85929 | 11.7% | 5.9%(+5.88)#40 | 5.8%(+5.92)#5,501 |
| 41. | 85637 | 11.7% | 5.9%(+5.84)#41 | 5.8%(+5.89)#5,542 |
| 42. | 85607 | 11.6% | 5.9%(+5.71)#42 | 5.8%(+5.75)#5,647 |
| 43. | 86315 | 11.5% | 5.9%(+5.67)#43 | 5.8%(+5.72)#5,672 |
| 44. | 85739 | 11.1% | 5.9%(+5.20)#44 | 5.8%(+5.24)#6,144 |
| 45. | 86303 | 11.0% | 5.9%(+5.11)#45 | 5.8%(+5.15)#6,235 |
| 46. | 86320 | 10.9% | 5.9%(+5.08)#46 | 5.8%(+5.12)#6,276 |
| 47. | 85601 | 10.7% | 5.9%(+4.81)#47 | 5.8%(+4.85)#6,582 |
| 48. | 85390 | 10.7% | 5.9%(+4.79)#48 | 5.8%(+4.84)#6,594 |
| 49. | 86338 | 10.4% | 5.9%(+4.54)#49 | 5.8%(+4.58)#6,895 |
| 50. | 86323 | 10.3% | 5.9%(+4.40)#50 | 5.8%(+4.45)#7,045 |
| 51. | 86039 | 10.1% | 5.9%(+4.27)#51 | 5.8%(+4.31)#7,197 |
| 52. | 85737 | 10.0% | 5.9%(+4.15)#52 | 5.8%(+4.19)#7,348 |
| 53. | 86337 | 9.8% | 5.9%(+3.95)#53 | 5.8%(+3.99)#7,610 |
| 54. | 85615 | 9.7% | 5.9%(+3.86)#54 | 5.8%(+3.90)#7,734 |
| 55. | 85632 | 9.5% | 5.9%(+3.60)#55 | 5.8%(+3.64)#8,067 |
| 56. | 85614 | 9.4% | 5.9%(+3.59)#56 | 5.8%(+3.63)#8,082 |
| 57. | 85013 | 9.3% | 5.9%(+3.45)#57 | 5.8%(+3.49)#8,296 |
| 58. | 86024 | 9.2% | 5.9%(+3.37)#58 | 5.8%(+3.42)#8,409 |
| 59. | 86404 | 9.2% | 5.9%(+3.32)#59 | 5.8%(+3.36)#8,499 |
| 60. | 85936 | 9.2% | 5.9%(+3.30)#60 | 5.8%(+3.34)#8,530 |
| 61. | 85173 | 9.0% | 5.9%(+3.19)#61 | 5.8%(+3.23)#8,699 |
| 62. | 85342 | 9.0% | 5.9%(+3.15)#62 | 5.8%(+3.20)#8,754 |
| 63. | 86535 | 9.0% | 5.9%(+3.14)#63 | 5.8%(+3.18)#8,771 |
| 64. | 85268 | 9.0% | 5.9%(+3.14)#64 | 5.8%(+3.18)#8,785 |
| 65. | 85617 | 9.0% | 5.9%(+3.13)#65 | 5.8%(+3.17)#8,796 |
| 66. | 86545 | 9.0% | 5.9%(+3.11)#66 | 5.8%(+3.15)#8,831 |
| 67. | 85750 | 9.0% | 5.9%(+3.10)#67 | 5.8%(+3.15)#8,837 |
| 68. | 85937 | 9.0% | 5.9%(+3.09)#68 | 5.8%(+3.14)#8,863 |
| 69. | 85706 | 8.9% | 5.9%(+3.09)#69 | 5.8%(+3.13)#8,866 |
| 70. | 85375 | 8.9% | 5.9%(+3.09)#70 | 5.8%(+3.13)#8,867 |
| 71. | 86502 | 8.9% | 5.9%(+3.06)#71 | 5.8%(+3.11)#8,915 |
| 72. | 85541 | 8.9% | 5.9%(+3.03)#72 | 5.8%(+3.07)#8,978 |
| 73. | 85378 | 8.8% | 5.9%(+2.94)#73 | 5.8%(+2.98)#9,145 |
| 74. | 85250 | 8.8% | 5.9%(+2.91)#74 | 5.8%(+2.95)#9,201 |
| 75. | 85258 | 8.7% | 5.9%(+2.88)#75 | 5.8%(+2.92)#9,257 |
| 76. | 86437 | 8.7% | 5.9%(+2.84)#76 | 5.8%(+2.88)#9,322 |
| 77. | 85003 | 8.7% | 5.9%(+2.82)#77 | 5.8%(+2.87)#9,341 |
| 78. | 85935 | 8.5% | 5.9%(+2.62)#78 | 5.8%(+2.67)#9,684 |
| 79. | 86432 | 8.4% | 5.9%(+2.57)#79 | 5.8%(+2.62)#9,782 |
| 80. | 85006 | 8.4% | 5.9%(+2.54)#80 | 5.8%(+2.58)#9,851 |
| 81. | 85940 | 8.4% | 5.9%(+2.53)#81 | 5.8%(+2.58)#9,855 |
| 82. | 85324 | 8.3% | 5.9%(+2.48)#82 | 5.8%(+2.53)#9,961 |
| 83. | 85749 | 8.3% | 5.9%(+2.42)#83 | 5.8%(+2.47)#10,090 |
| 84. | 85925 | 8.2% | 5.9%(+2.39)#84 | 5.8%(+2.43)#10,139 |
| 85. | 85631 | 8.2% | 5.9%(+2.35)#85 | 5.8%(+2.40)#10,210 |
| 86. | 85207 | 8.2% | 5.9%(+2.34)#86 | 5.8%(+2.39)#10,230 |
| 87. | 86332 | 8.2% | 5.9%(+2.33)#87 | 5.8%(+2.38)#10,258 |
| 88. | 85087 | 8.2% | 5.9%(+2.30)#88 | 5.8%(+2.34)#10,325 |
| 89. | 85705 | 8.0% | 5.9%(+2.19)#89 | 5.8%(+2.23)#10,538 |
| 90. | 85284 | 8.0% | 5.9%(+2.18)#90 | 5.8%(+2.22)#10,564 |
| 91. | 86429 | 8.0% | 5.9%(+2.16)#91 | 5.8%(+2.21)#10,586 |
| 92. | 86020 | 8.0% | 5.9%(+2.10)#92 | 5.8%(+2.14)#10,728 |
| 93. | 85354 | 8.0% | 5.9%(+2.09)#93 | 5.8%(+2.14)#10,730 |
| 94. | 86413 | 7.9% | 5.9%(+2.09)#94 | 5.8%(+2.13)#10,745 |
| 95. | 85086 | 7.9% | 5.9%(+2.04)#95 | 5.8%(+2.09)#10,836 |
| 96. | 86520 | 7.9% | 5.9%(+2.04)#96 | 5.8%(+2.08)#10,854 |
| 97. | 85123 | 7.9% | 5.9%(+2.02)#97 | 5.8%(+2.06)#10,898 |
| 98. | 85501 | 7.8% | 5.9%(+1.96)#98 | 5.8%(+2.01)#11,028 |
| 99. | 85539 | 7.8% | 5.9%(+1.95)#99 | 5.8%(+2.00)#11,050 |
| 100. | 85543 | 7.8% | 5.9%(+1.95)#100 | 5.8%(+2.00)#11,052 |
Common Questions
What are the Top 10 Zip Codes with the Highest Percentage of Self-Employed / Not Incorporated in Arizona?
Top 10 Zip Codes with the Highest Percentage of Self-Employed / Not Incorporated in Arizona are:
What zip code has the Highest Percentage of Self-Employed / Not Incorporated in Arizona?
85932 has the Highest Percentage of Self-Employed / Not Incorporated in Arizona with 72.7%.
What is the Percentage of Self-Employed / Not Incorporated in the State of Arizona?
Percentage of Self-Employed / Not Incorporated in Arizona is 5.9%.
What is the Percentage of Self-Employed / Not Incorporated in the United States?
Percentage of Self-Employed / Not Incorporated in the United States is 5.8%.