Zip Codes with the Highest Percentage of Self-Employed / Not Incorporated in Colorado
RELATED REPORTS & OPTIONS
Self-Employed / Not Incorporated
Colorado
Compare Zip Codes
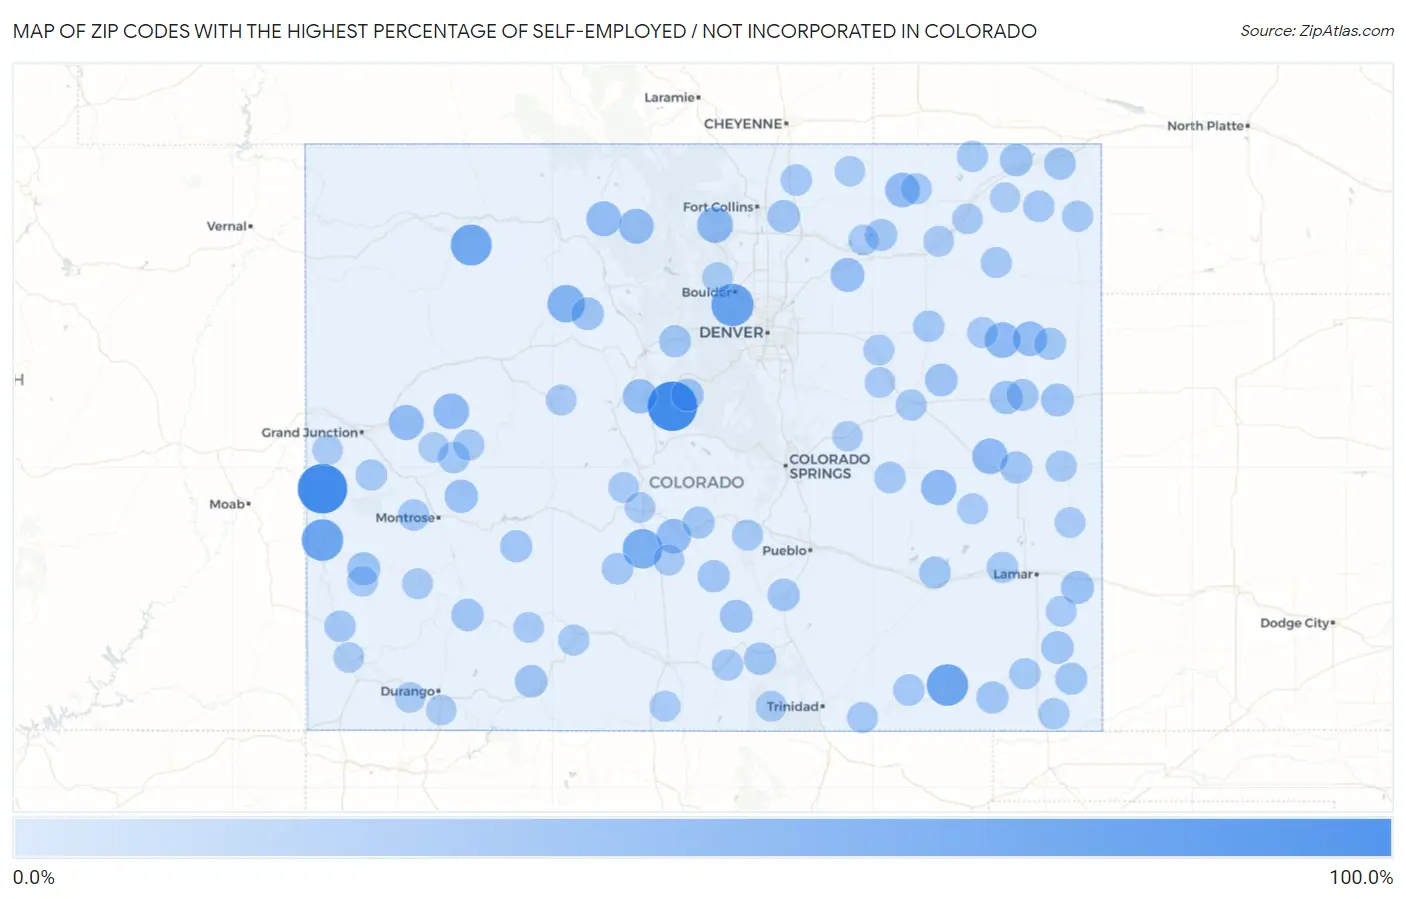
Map of Zip Codes with the Highest Percentage of Self-Employed / Not Incorporated in Colorado
0.0%
100.0%
Zip Codes with the Highest Percentage of Self-Employed / Not Incorporated in Colorado
| Zip Code | % Self-Employed / Not Incorporated | vs State | vs National | |
| 1. | 80432 | 100.0% | 6.1%(+93.9)#1 | 5.8%(+94.2)#7 |
| 2. | 81522 | 100.0% | 6.1%(+93.9)#2 | 5.8%(+94.2)#17 |
| 3. | 80025 | 66.7% | 6.1%(+60.6)#3 | 5.8%(+60.9)#111 |
| 4. | 81429 | 63.4% | 6.1%(+57.3)#4 | 5.8%(+57.6)#125 |
| 5. | 81049 | 63.1% | 6.1%(+57.0)#5 | 5.8%(+57.3)#126 |
| 6. | 81638 | 60.9% | 6.1%(+54.8)#6 | 5.8%(+55.1)#137 |
| 7. | 81155 | 54.1% | 6.1%(+48.0)#7 | 5.8%(+48.3)#178 |
| 8. | 80463 | 45.5% | 6.1%(+39.4)#8 | 5.8%(+39.6)#295 |
| 9. | 80532 | 37.4% | 6.1%(+31.3)#9 | 5.8%(+31.6)#478 |
| 10. | 80812 | 36.6% | 6.1%(+30.5)#10 | 5.8%(+30.8)#501 |
| 11. | 81624 | 36.5% | 6.1%(+30.4)#11 | 5.8%(+30.7)#509 |
| 12. | 80862 | 36.4% | 6.1%(+30.3)#12 | 5.8%(+30.5)#516 |
| 13. | 80823 | 35.5% | 6.1%(+29.4)#13 | 5.8%(+29.7)#546 |
| 14. | 81643 | 34.5% | 6.1%(+28.4)#14 | 5.8%(+28.7)#565 |
| 15. | 80430 | 33.3% | 6.1%(+27.2)#15 | 5.8%(+27.5)#606 |
| 16. | 80473 | 33.3% | 6.1%(+27.2)#16 | 5.8%(+27.5)#614 |
| 17. | 80742 | 32.5% | 6.1%(+26.4)#17 | 5.8%(+26.7)#651 |
| 18. | 81222 | 32.4% | 6.1%(+26.3)#18 | 5.8%(+26.6)#654 |
| 19. | 80822 | 31.8% | 6.1%(+25.7)#19 | 5.8%(+26.0)#679 |
| 20. | 80420 | 30.7% | 6.1%(+24.6)#20 | 5.8%(+24.9)#735 |
| 21. | 80652 | 29.0% | 6.1%(+22.9)#21 | 5.8%(+23.2)#824 |
| 22. | 81415 | 26.8% | 6.1%(+20.7)#22 | 5.8%(+20.9)#977 |
| 23. | 80834 | 25.9% | 6.1%(+19.8)#23 | 5.8%(+20.1)#1,057 |
| 24. | 81431 | 25.3% | 6.1%(+19.2)#24 | 5.8%(+19.5)#1,120 |
| 25. | 81047 | 25.0% | 6.1%(+18.9)#25 | 5.8%(+19.1)#1,158 |
| 26. | 81040 | 24.8% | 6.1%(+18.7)#26 | 5.8%(+18.9)#1,176 |
| 27. | 80805 | 24.7% | 6.1%(+18.6)#27 | 5.8%(+18.9)#1,182 |
| 28. | 80423 | 24.0% | 6.1%(+17.9)#28 | 5.8%(+18.2)#1,248 |
| 29. | 80546 | 23.8% | 6.1%(+17.7)#29 | 5.8%(+18.0)#1,271 |
| 30. | 80818 | 23.7% | 6.1%(+17.6)#30 | 5.8%(+17.9)#1,286 |
| 31. | 80456 | 23.4% | 6.1%(+17.3)#31 | 5.8%(+17.6)#1,318 |
| 32. | 80726 | 23.2% | 6.1%(+17.1)#32 | 5.8%(+17.4)#1,330 |
| 33. | 81147 | 23.2% | 6.1%(+17.1)#33 | 5.8%(+17.4)#1,332 |
| 34. | 81433 | 22.7% | 6.1%(+16.6)#34 | 5.8%(+16.9)#1,385 |
| 35. | 81084 | 22.7% | 6.1%(+16.6)#35 | 5.8%(+16.9)#1,389 |
| 36. | 81055 | 22.7% | 6.1%(+16.6)#36 | 5.8%(+16.9)#1,394 |
| 37. | 81019 | 22.5% | 6.1%(+16.4)#37 | 5.8%(+16.7)#1,418 |
| 38. | 81252 | 22.1% | 6.1%(+16.0)#38 | 5.8%(+16.3)#1,468 |
| 39. | 80825 | 21.9% | 6.1%(+15.8)#39 | 5.8%(+16.1)#1,481 |
| 40. | 81064 | 21.7% | 6.1%(+15.6)#40 | 5.8%(+15.9)#1,519 |
| 41. | 81243 | 21.4% | 6.1%(+15.3)#41 | 5.8%(+15.6)#1,575 |
| 42. | 80824 | 20.7% | 6.1%(+14.6)#42 | 5.8%(+14.8)#1,701 |
| 43. | 81223 | 20.6% | 6.1%(+14.5)#43 | 5.8%(+14.8)#1,702 |
| 44. | 81090 | 20.6% | 6.1%(+14.5)#44 | 5.8%(+14.8)#1,709 |
| 45. | 80861 | 20.5% | 6.1%(+14.5)#45 | 5.8%(+14.7)#1,720 |
| 46. | 80653 | 20.5% | 6.1%(+14.4)#46 | 5.8%(+14.7)#1,725 |
| 47. | 80476 | 20.4% | 6.1%(+14.3)#47 | 5.8%(+14.6)#1,745 |
| 48. | 81030 | 20.0% | 6.1%(+13.9)#48 | 5.8%(+14.2)#1,819 |
| 49. | 80744 | 19.9% | 6.1%(+13.8)#49 | 5.8%(+14.1)#1,847 |
| 50. | 81419 | 19.1% | 6.1%(+13.0)#50 | 5.8%(+13.3)#2,005 |
| 51. | 81149 | 19.0% | 6.1%(+12.9)#51 | 5.8%(+13.2)#2,031 |
| 52. | 81027 | 18.8% | 6.1%(+12.7)#52 | 5.8%(+12.9)#2,100 |
| 53. | 81425 | 18.6% | 6.1%(+12.5)#53 | 5.8%(+12.8)#2,149 |
| 54. | 80833 | 18.5% | 6.1%(+12.4)#54 | 5.8%(+12.7)#2,169 |
| 55. | 80731 | 18.5% | 6.1%(+12.4)#55 | 5.8%(+12.7)#2,177 |
| 56. | 80757 | 18.2% | 6.1%(+12.1)#56 | 5.8%(+12.4)#2,267 |
| 57. | 81073 | 18.1% | 6.1%(+12.0)#57 | 5.8%(+12.2)#2,301 |
| 58. | 81320 | 17.9% | 6.1%(+11.8)#58 | 5.8%(+12.0)#2,349 |
| 59. | 80648 | 17.6% | 6.1%(+11.5)#59 | 5.8%(+11.8)#2,440 |
| 60. | 81029 | 17.5% | 6.1%(+11.4)#60 | 5.8%(+11.7)#2,452 |
| 61. | 81057 | 17.5% | 6.1%(+11.4)#61 | 5.8%(+11.7)#2,455 |
| 62. | 80734 | 17.5% | 6.1%(+11.4)#62 | 5.8%(+11.6)#2,477 |
| 63. | 81527 | 17.4% | 6.1%(+11.3)#63 | 5.8%(+11.6)#2,480 |
| 64. | 81428 | 17.3% | 6.1%(+11.2)#64 | 5.8%(+11.5)#2,526 |
| 65. | 81133 | 17.1% | 6.1%(+11.0)#65 | 5.8%(+11.3)#2,609 |
| 66. | 80747 | 17.0% | 6.1%(+10.9)#66 | 5.8%(+11.2)#2,631 |
| 67. | 80828 | 16.7% | 6.1%(+10.6)#67 | 5.8%(+10.9)#2,719 |
| 68. | 80754 | 16.7% | 6.1%(+10.6)#68 | 5.8%(+10.9)#2,752 |
| 69. | 81244 | 16.5% | 6.1%(+10.4)#69 | 5.8%(+10.7)#2,807 |
| 70. | 80810 | 16.5% | 6.1%(+10.4)#70 | 5.8%(+10.7)#2,808 |
| 71. | 80743 | 16.4% | 6.1%(+10.3)#71 | 5.8%(+10.6)#2,840 |
| 72. | 81154 | 16.3% | 6.1%(+10.2)#72 | 5.8%(+10.5)#2,876 |
| 73. | 81081 | 16.2% | 6.1%(+10.1)#73 | 5.8%(+10.4)#2,898 |
| 74. | 81143 | 16.0% | 6.1%(+9.88)#74 | 5.8%(+10.2)#2,977 |
| 75. | 81141 | 16.0% | 6.1%(+9.86)#75 | 5.8%(+10.1)#2,988 |
| 76. | 81236 | 15.9% | 6.1%(+9.84)#76 | 5.8%(+10.1)#3,005 |
| 77. | 80801 | 15.9% | 6.1%(+9.81)#77 | 5.8%(+10.1)#3,018 |
| 78. | 80105 | 15.8% | 6.1%(+9.73)#78 | 5.8%(+10.0)#3,056 |
| 79. | 81045 | 15.8% | 6.1%(+9.69)#79 | 5.8%(+9.97)#3,084 |
| 80. | 81656 | 15.5% | 6.1%(+9.41)#80 | 5.8%(+9.69)#3,196 |
| 81. | 81091 | 15.5% | 6.1%(+9.39)#81 | 5.8%(+9.67)#3,206 |
| 82. | 81430 | 15.5% | 6.1%(+9.38)#82 | 5.8%(+9.66)#3,212 |
| 83. | 81041 | 15.4% | 6.1%(+9.26)#83 | 5.8%(+9.54)#3,257 |
| 84. | 81071 | 15.3% | 6.1%(+9.21)#84 | 5.8%(+9.49)#3,278 |
| 85. | 81423 | 15.2% | 6.1%(+9.15)#85 | 5.8%(+9.43)#3,306 |
| 86. | 80649 | 14.7% | 6.1%(+8.61)#86 | 5.8%(+8.89)#3,564 |
| 87. | 80733 | 14.7% | 6.1%(+8.58)#87 | 5.8%(+8.87)#3,574 |
| 88. | 81201 | 14.6% | 6.1%(+8.51)#88 | 5.8%(+8.79)#3,608 |
| 89. | 80722 | 14.6% | 6.1%(+8.50)#89 | 5.8%(+8.79)#3,611 |
| 90. | 81130 | 14.5% | 6.1%(+8.40)#90 | 5.8%(+8.68)#3,658 |
| 91. | 80101 | 14.4% | 6.1%(+8.32)#91 | 5.8%(+8.60)#3,695 |
| 92. | 80808 | 14.2% | 6.1%(+8.15)#92 | 5.8%(+8.43)#3,772 |
| 93. | 81326 | 14.2% | 6.1%(+8.09)#93 | 5.8%(+8.37)#3,813 |
| 94. | 81327 | 14.1% | 6.1%(+8.04)#94 | 5.8%(+8.33)#3,830 |
| 95. | 81523 | 13.9% | 6.1%(+7.80)#95 | 5.8%(+8.08)#3,956 |
| 96. | 80455 | 13.9% | 6.1%(+7.77)#96 | 5.8%(+8.05)#3,981 |
| 97. | 81303 | 13.9% | 6.1%(+7.76)#97 | 5.8%(+8.04)#3,985 |
| 98. | 81413 | 13.8% | 6.1%(+7.72)#98 | 5.8%(+8.01)#4,000 |
| 99. | 80728 | 13.6% | 6.1%(+7.52)#99 | 5.8%(+7.80)#4,120 |
| 100. | 80729 | 13.4% | 6.1%(+7.34)#100 | 5.8%(+7.62)#4,229 |
Common Questions
What are the Top 10 Zip Codes with the Highest Percentage of Self-Employed / Not Incorporated in Colorado?
Top 10 Zip Codes with the Highest Percentage of Self-Employed / Not Incorporated in Colorado are:
What zip code has the Highest Percentage of Self-Employed / Not Incorporated in Colorado?
80432 has the Highest Percentage of Self-Employed / Not Incorporated in Colorado with 100.0%.
What is the Percentage of Self-Employed / Not Incorporated in the State of Colorado?
Percentage of Self-Employed / Not Incorporated in Colorado is 6.1%.
What is the Percentage of Self-Employed / Not Incorporated in the United States?
Percentage of Self-Employed / Not Incorporated in the United States is 5.8%.