Zip Codes with the Highest Percentage of Self-Employed / Not Incorporated in South Dakota
RELATED REPORTS & OPTIONS
Self-Employed / Not Incorporated
South Dakota
Compare Zip Codes
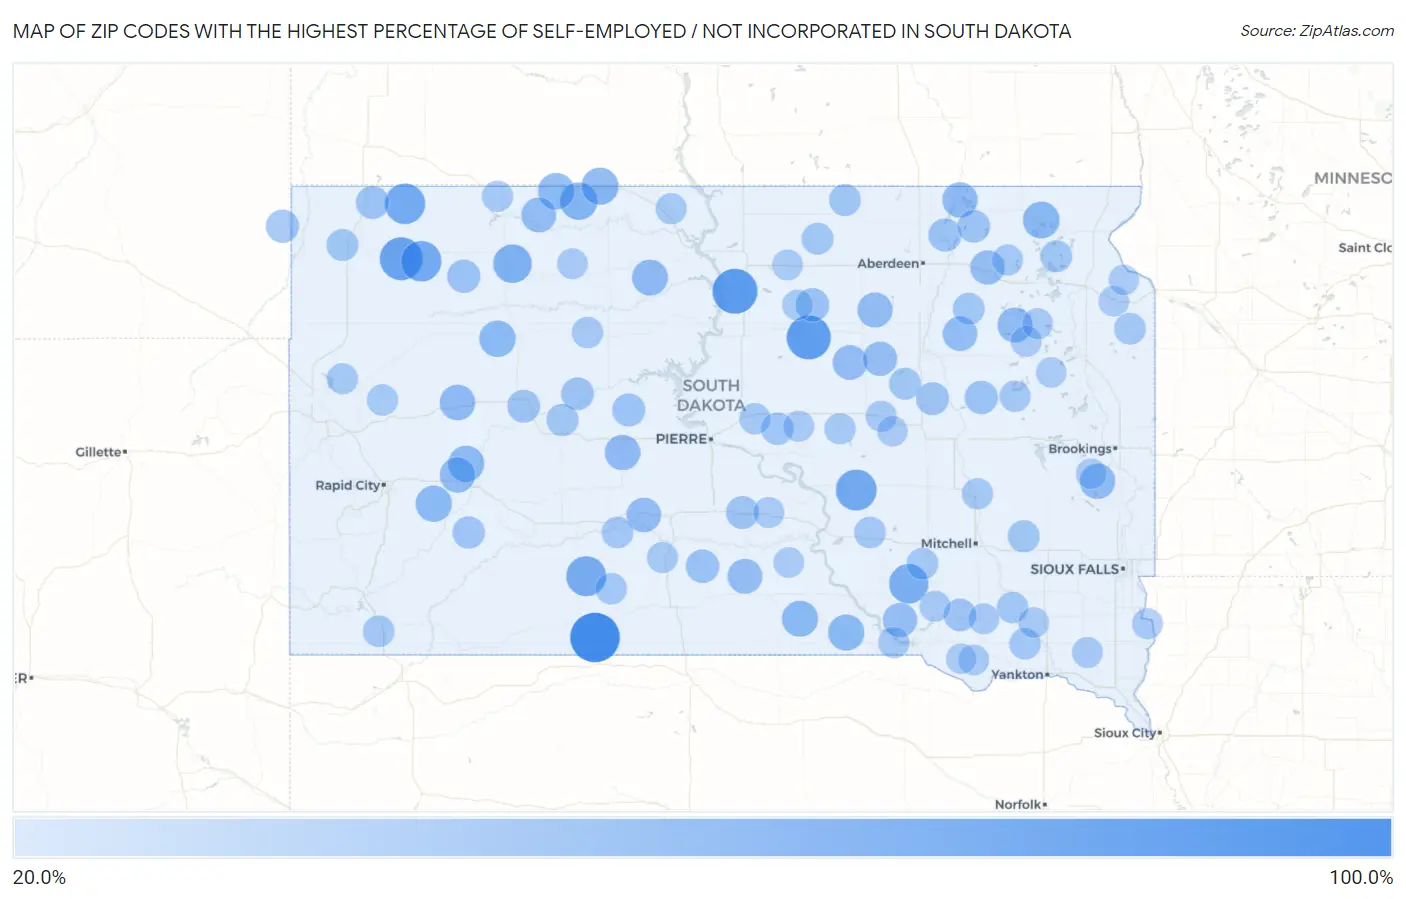
Map of Zip Codes with the Highest Percentage of Self-Employed / Not Incorporated in South Dakota
20.0%
100.0%
Zip Codes with the Highest Percentage of Self-Employed / Not Incorporated in South Dakota
| Zip Code | % Self-Employed / Not Incorporated | vs State | vs National | |
| 1. | 57574 | 100.0% | 7.8%(+92.2)#1 | 5.8%(+94.2)#18 |
| 2. | 57420 | 80.6% | 7.8%(+72.8)#2 | 5.8%(+74.8)#74 |
| 3. | 57473 | 77.5% | 7.8%(+69.7)#3 | 5.8%(+71.7)#81 |
| 4. | 57651 | 72.2% | 7.8%(+64.4)#4 | 5.8%(+66.4)#93 |
| 5. | 57341 | 63.9% | 7.8%(+56.1)#5 | 5.8%(+58.1)#122 |
| 6. | 57650 | 62.5% | 7.8%(+54.7)#6 | 5.8%(+56.7)#129 |
| 7. | 57649 | 62.2% | 7.8%(+54.4)#7 | 5.8%(+56.4)#130 |
| 8. | 57547 | 60.5% | 7.8%(+52.6)#8 | 5.8%(+54.7)#139 |
| 9. | 57344 | 57.7% | 7.8%(+49.8)#9 | 5.8%(+51.9)#151 |
| 10. | 57644 | 54.4% | 7.8%(+46.5)#10 | 5.8%(+48.6)#175 |
| 11. | 57660 | 50.0% | 7.8%(+42.2)#11 | 5.8%(+44.2)#216 |
| 12. | 57641 | 48.3% | 7.8%(+40.5)#12 | 5.8%(+42.5)#247 |
| 13. | 57247 | 47.1% | 7.8%(+39.2)#13 | 5.8%(+41.2)#265 |
| 14. | 57645 | 45.9% | 7.8%(+38.1)#14 | 5.8%(+40.1)#286 |
| 15. | 57626 | 45.5% | 7.8%(+37.7)#15 | 5.8%(+39.7)#294 |
| 16. | 57538 | 45.2% | 7.8%(+37.3)#16 | 5.8%(+39.4)#300 |
| 17. | 57725 | 44.9% | 7.8%(+37.1)#17 | 5.8%(+39.1)#305 |
| 18. | 57529 | 44.6% | 7.8%(+36.7)#18 | 5.8%(+38.7)#307 |
| 19. | 57791 | 44.4% | 7.8%(+36.6)#19 | 5.8%(+38.6)#310 |
| 20. | 57630 | 43.8% | 7.8%(+35.9)#20 | 5.8%(+37.9)#320 |
| 21. | 57787 | 42.8% | 7.8%(+34.9)#21 | 5.8%(+37.0)#344 |
| 22. | 57057 | 42.0% | 7.8%(+34.2)#22 | 5.8%(+36.2)#363 |
| 23. | 57767 | 41.9% | 7.8%(+34.1)#23 | 5.8%(+36.1)#364 |
| 24. | 57552 | 41.7% | 7.8%(+33.8)#24 | 5.8%(+35.9)#368 |
| 25. | 57446 | 41.4% | 7.8%(+33.6)#25 | 5.8%(+35.6)#373 |
| 26. | 57435 | 40.5% | 7.8%(+32.7)#26 | 5.8%(+34.7)#397 |
| 27. | 57217 | 40.2% | 7.8%(+32.4)#27 | 5.8%(+34.4)#402 |
| 28. | 57634 | 39.6% | 7.8%(+31.8)#28 | 5.8%(+33.8)#414 |
| 29. | 57584 | 39.4% | 7.8%(+31.5)#29 | 5.8%(+33.6)#424 |
| 30. | 57467 | 38.9% | 7.8%(+31.1)#30 | 5.8%(+33.1)#434 |
| 31. | 57477 | 38.8% | 7.8%(+30.9)#31 | 5.8%(+33.0)#441 |
| 32. | 57562 | 38.6% | 7.8%(+30.8)#32 | 5.8%(+32.8)#445 |
| 33. | 57422 | 37.5% | 7.8%(+29.7)#33 | 5.8%(+31.7)#473 |
| 34. | 57470 | 37.2% | 7.8%(+29.4)#34 | 5.8%(+31.4)#484 |
| 35. | 57342 | 37.1% | 7.8%(+29.2)#35 | 5.8%(+31.2)#489 |
| 36. | 57466 | 34.3% | 7.8%(+26.4)#36 | 5.8%(+28.5)#572 |
| 37. | 57585 | 34.1% | 7.8%(+26.3)#37 | 5.8%(+28.3)#576 |
| 38. | 57322 | 33.3% | 7.8%(+25.5)#38 | 5.8%(+27.5)#600 |
| 39. | 57620 | 33.0% | 7.8%(+25.2)#39 | 5.8%(+27.2)#629 |
| 40. | 57724 | 32.8% | 7.8%(+25.0)#40 | 5.8%(+27.0)#640 |
| 41. | 57755 | 32.5% | 7.8%(+24.7)#41 | 5.8%(+26.7)#652 |
| 42. | 57433 | 32.5% | 7.8%(+24.6)#42 | 5.8%(+26.7)#653 |
| 43. | 57537 | 32.0% | 7.8%(+24.2)#43 | 5.8%(+26.2)#672 |
| 44. | 57568 | 31.8% | 7.8%(+24.0)#44 | 5.8%(+26.0)#681 |
| 45. | 57348 | 31.7% | 7.8%(+23.8)#45 | 5.8%(+25.8)#687 |
| 46. | 57748 | 31.6% | 7.8%(+23.7)#46 | 5.8%(+25.8)#692 |
| 47. | 57622 | 30.8% | 7.8%(+22.9)#47 | 5.8%(+25.0)#726 |
| 48. | 57432 | 30.8% | 7.8%(+22.9)#48 | 5.8%(+25.0)#727 |
| 49. | 57330 | 30.4% | 7.8%(+22.5)#49 | 5.8%(+24.6)#748 |
| 50. | 57780 | 29.4% | 7.8%(+21.6)#50 | 5.8%(+23.6)#805 |
| 51. | 57536 | 29.4% | 7.8%(+21.5)#51 | 5.8%(+23.6)#808 |
| 52. | 57553 | 28.6% | 7.8%(+20.7)#52 | 5.8%(+22.8)#855 |
| 53. | 57374 | 28.3% | 7.8%(+20.5)#53 | 5.8%(+22.5)#872 |
| 54. | 57239 | 28.1% | 7.8%(+20.3)#54 | 5.8%(+22.3)#890 |
| 55. | 57720 | 27.8% | 7.8%(+20.0)#55 | 5.8%(+22.0)#904 |
| 56. | 57434 | 27.5% | 7.8%(+19.6)#56 | 5.8%(+21.6)#928 |
| 57. | 57476 | 27.5% | 7.8%(+19.6)#57 | 5.8%(+21.6)#929 |
| 58. | 57457 | 27.5% | 7.8%(+19.6)#58 | 5.8%(+21.6)#930 |
| 59. | 57448 | 27.3% | 7.8%(+19.4)#59 | 5.8%(+21.5)#941 |
| 60. | 57521 | 26.9% | 7.8%(+19.1)#60 | 5.8%(+21.1)#959 |
| 61. | 57246 | 26.9% | 7.8%(+19.0)#61 | 5.8%(+21.1)#969 |
| 62. | 57763 | 26.8% | 7.8%(+19.0)#62 | 5.8%(+21.0)#972 |
| 63. | 57375 | 26.7% | 7.8%(+18.9)#63 | 5.8%(+20.9)#982 |
| 64. | 57355 | 26.7% | 7.8%(+18.8)#64 | 5.8%(+20.9)#988 |
| 65. | 57040 | 26.3% | 7.8%(+18.4)#65 | 5.8%(+20.4)#1,019 |
| 66. | 57560 | 25.9% | 7.8%(+18.1)#66 | 5.8%(+20.1)#1,047 |
| 67. | 57052 | 25.8% | 7.8%(+18.0)#67 | 5.8%(+20.0)#1,062 |
| 68. | 57522 | 25.5% | 7.8%(+17.7)#68 | 5.8%(+19.7)#1,104 |
| 69. | 57636 | 25.5% | 7.8%(+17.6)#69 | 5.8%(+19.7)#1,106 |
| 70. | 57788 | 25.4% | 7.8%(+17.5)#70 | 5.8%(+19.6)#1,113 |
| 71. | 57278 | 25.4% | 7.8%(+17.5)#71 | 5.8%(+19.6)#1,116 |
| 72. | 57371 | 25.2% | 7.8%(+17.4)#72 | 5.8%(+19.4)#1,128 |
| 73. | 57335 | 25.0% | 7.8%(+17.2)#73 | 5.8%(+19.2)#1,147 |
| 74. | 57314 | 24.7% | 7.8%(+16.8)#74 | 5.8%(+18.9)#1,185 |
| 75. | 57638 | 24.6% | 7.8%(+16.7)#75 | 5.8%(+18.8)#1,196 |
| 76. | 57468 | 24.4% | 7.8%(+16.6)#76 | 5.8%(+18.6)#1,216 |
| 77. | 57642 | 24.4% | 7.8%(+16.5)#77 | 5.8%(+18.6)#1,223 |
| 78. | 57373 | 24.4% | 7.8%(+16.5)#78 | 5.8%(+18.5)#1,225 |
| 79. | 57762 | 24.3% | 7.8%(+16.5)#79 | 5.8%(+18.5)#1,231 |
| 80. | 57579 | 24.1% | 7.8%(+16.2)#80 | 5.8%(+18.3)#1,241 |
| 81. | 57313 | 23.9% | 7.8%(+16.0)#81 | 5.8%(+18.1)#1,266 |
| 82. | 57544 | 23.8% | 7.8%(+15.9)#82 | 5.8%(+18.0)#1,276 |
| 83. | 57236 | 23.7% | 7.8%(+15.9)#83 | 5.8%(+17.9)#1,285 |
| 84. | 57540 | 23.6% | 7.8%(+15.7)#84 | 5.8%(+17.8)#1,297 |
| 85. | 57073 | 23.6% | 7.8%(+15.7)#85 | 5.8%(+17.7)#1,298 |
| 86. | 57272 | 23.5% | 7.8%(+15.6)#86 | 5.8%(+17.7)#1,312 |
| 87. | 57376 | 23.4% | 7.8%(+15.5)#87 | 5.8%(+17.6)#1,320 |
| 88. | 57428 | 23.3% | 7.8%(+15.4)#88 | 5.8%(+17.5)#1,323 |
| 89. | 57027 | 23.1% | 7.8%(+15.3)#89 | 5.8%(+17.3)#1,336 |
| 90. | 57045 | 22.9% | 7.8%(+15.1)#90 | 5.8%(+17.1)#1,360 |
| 91. | 57315 | 22.9% | 7.8%(+15.0)#91 | 5.8%(+17.0)#1,369 |
| 92. | 57633 | 22.8% | 7.8%(+15.0)#92 | 5.8%(+17.0)#1,373 |
| 93. | 57475 | 22.8% | 7.8%(+15.0)#93 | 5.8%(+17.0)#1,376 |
| 94. | 57534 | 22.4% | 7.8%(+14.6)#94 | 5.8%(+16.6)#1,420 |
| 95. | 57050 | 22.1% | 7.8%(+14.3)#95 | 5.8%(+16.3)#1,460 |
| 96. | 57269 | 22.0% | 7.8%(+14.2)#96 | 5.8%(+16.2)#1,472 |
| 97. | 57381 | 21.9% | 7.8%(+14.1)#97 | 5.8%(+16.1)#1,484 |
| 98. | 57329 | 21.8% | 7.8%(+13.9)#98 | 5.8%(+16.0)#1,511 |
| 99. | 57242 | 21.7% | 7.8%(+13.9)#99 | 5.8%(+15.9)#1,522 |
| 100. | 57227 | 21.7% | 7.8%(+13.9)#100 | 5.8%(+15.9)#1,524 |
Common Questions
What are the Top 10 Zip Codes with the Highest Percentage of Self-Employed / Not Incorporated in South Dakota?
Top 10 Zip Codes with the Highest Percentage of Self-Employed / Not Incorporated in South Dakota are:
What zip code has the Highest Percentage of Self-Employed / Not Incorporated in South Dakota?
57574 has the Highest Percentage of Self-Employed / Not Incorporated in South Dakota with 100.0%.
What is the Percentage of Self-Employed / Not Incorporated in the State of South Dakota?
Percentage of Self-Employed / Not Incorporated in South Dakota is 7.8%.
What is the Percentage of Self-Employed / Not Incorporated in the United States?
Percentage of Self-Employed / Not Incorporated in the United States is 5.8%.