Zip Codes with the Highest Percentage of Self-Employed / Not Incorporated in North Dakota
RELATED REPORTS & OPTIONS
Self-Employed / Not Incorporated
North Dakota
Compare Zip Codes
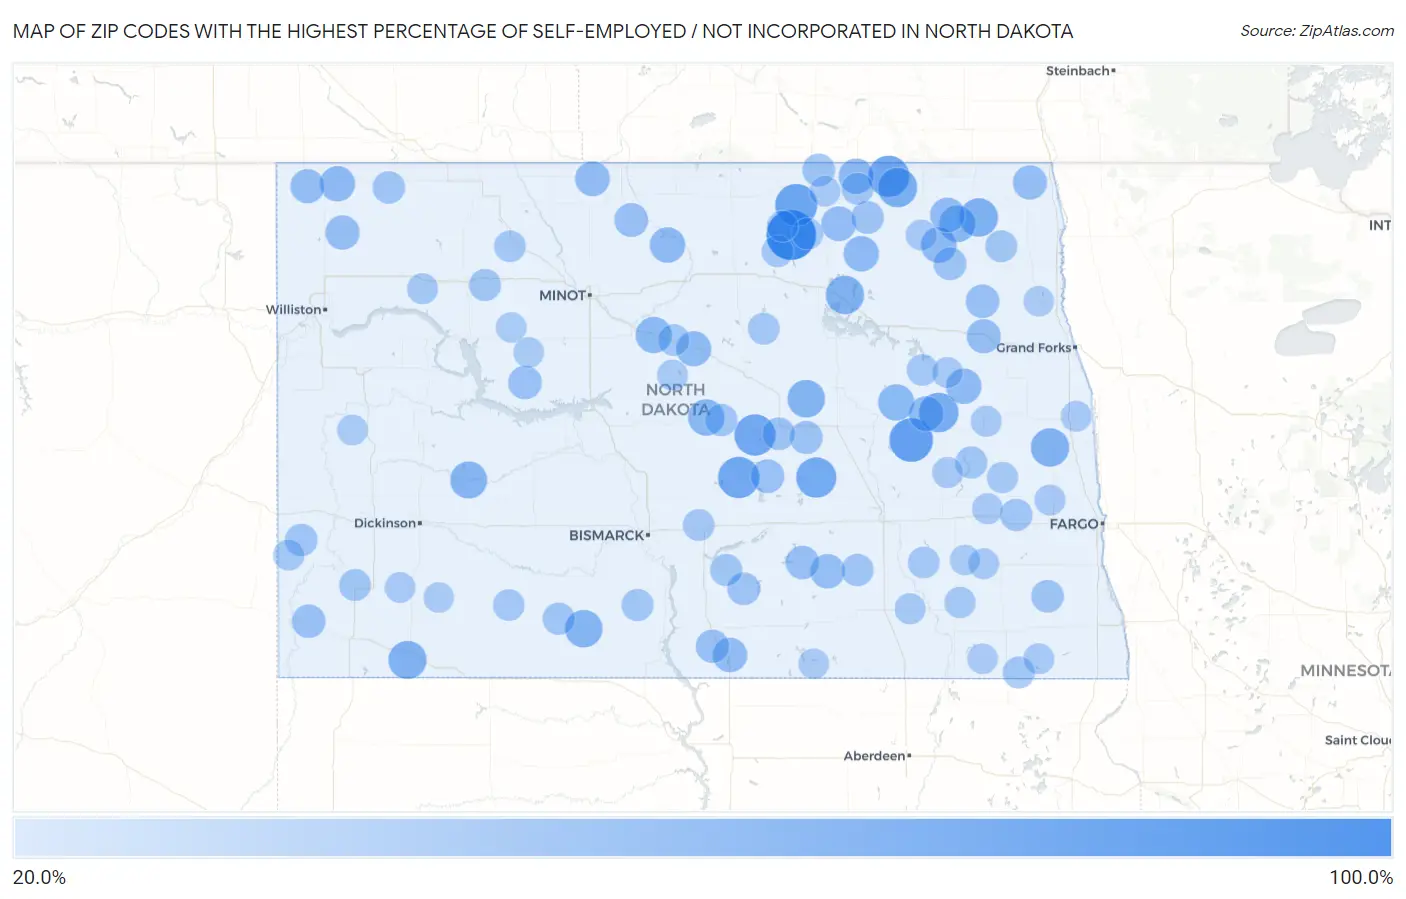
Map of Zip Codes with the Highest Percentage of Self-Employed / Not Incorporated in North Dakota
20.0%
100.0%
Zip Codes with the Highest Percentage of Self-Employed / Not Incorporated in North Dakota
| Zip Code | % Self-Employed / Not Incorporated | vs State | vs National | |
| 1. | 58310 | 100.0% | 7.2%(+92.8)#1 | 5.8%(+94.2)#45 |
| 2. | 58484 | 76.2% | 7.2%(+69.0)#2 | 5.8%(+70.4)#85 |
| 3. | 58363 | 70.2% | 7.2%(+63.0)#3 | 5.8%(+64.4)#99 |
| 4. | 58488 | 67.1% | 7.2%(+59.9)#4 | 5.8%(+61.3)#106 |
| 5. | 58423 | 66.7% | 7.2%(+59.5)#5 | 5.8%(+60.9)#109 |
| 6. | 58239 | 66.7% | 7.2%(+59.5)#6 | 5.8%(+60.9)#113 |
| 7. | 58496 | 62.9% | 7.2%(+55.7)#7 | 5.8%(+57.1)#127 |
| 8. | 58452 | 60.0% | 7.2%(+52.8)#8 | 5.8%(+54.2)#143 |
| 9. | 58281 | 59.4% | 7.2%(+52.2)#9 | 5.8%(+53.6)#147 |
| 10. | 58262 | 55.6% | 7.2%(+48.3)#10 | 5.8%(+49.7)#164 |
| 11. | 58009 | 55.0% | 7.2%(+47.8)#11 | 5.8%(+49.2)#169 |
| 12. | 58362 | 55.0% | 7.2%(+47.8)#12 | 5.8%(+49.2)#170 |
| 13. | 58649 | 54.2% | 7.2%(+47.0)#13 | 5.8%(+48.4)#176 |
| 14. | 58422 | 52.3% | 7.2%(+45.1)#14 | 5.8%(+46.5)#191 |
| 15. | 58564 | 52.2% | 7.2%(+45.0)#15 | 5.8%(+46.4)#194 |
| 16. | 58644 | 50.0% | 7.2%(+42.8)#16 | 5.8%(+44.2)#233 |
| 17. | 58260 | 48.3% | 7.2%(+41.1)#17 | 5.8%(+42.5)#246 |
| 18. | 58430 | 47.8% | 7.2%(+40.6)#18 | 5.8%(+42.0)#258 |
| 19. | 58792 | 47.0% | 7.2%(+39.8)#19 | 5.8%(+41.2)#268 |
| 20. | 58464 | 46.9% | 7.2%(+39.7)#20 | 5.8%(+41.1)#272 |
| 21. | 58229 | 45.0% | 7.2%(+37.8)#21 | 5.8%(+39.2)#304 |
| 22. | 58713 | 43.9% | 7.2%(+36.7)#22 | 5.8%(+38.1)#315 |
| 23. | 58212 | 43.9% | 7.2%(+36.7)#23 | 5.8%(+38.1)#317 |
| 24. | 58377 | 43.5% | 7.2%(+36.3)#24 | 5.8%(+37.7)#326 |
| 25. | 58372 | 43.3% | 7.2%(+36.1)#25 | 5.8%(+37.5)#330 |
| 26. | 58833 | 43.3% | 7.2%(+36.1)#26 | 5.8%(+37.5)#332 |
| 27. | 58736 | 42.8% | 7.2%(+35.6)#27 | 5.8%(+37.0)#343 |
| 28. | 58416 | 42.1% | 7.2%(+34.9)#28 | 5.8%(+36.3)#358 |
| 29. | 58711 | 41.3% | 7.2%(+34.1)#29 | 5.8%(+35.5)#378 |
| 30. | 58269 | 41.3% | 7.2%(+34.1)#30 | 5.8%(+35.5)#379 |
| 31. | 58331 | 41.2% | 7.2%(+34.0)#31 | 5.8%(+35.4)#383 |
| 32. | 58542 | 40.3% | 7.2%(+33.1)#32 | 5.8%(+34.4)#401 |
| 33. | 58442 | 40.1% | 7.2%(+32.9)#33 | 5.8%(+34.3)#403 |
| 34. | 58830 | 39.4% | 7.2%(+32.2)#34 | 5.8%(+33.6)#422 |
| 35. | 58844 | 39.0% | 7.2%(+31.8)#35 | 5.8%(+33.2)#431 |
| 36. | 58216 | 38.8% | 7.2%(+31.6)#36 | 5.8%(+33.0)#438 |
| 37. | 58266 | 38.8% | 7.2%(+31.5)#37 | 5.8%(+32.9)#442 |
| 38. | 58762 | 37.5% | 7.2%(+30.3)#38 | 5.8%(+31.7)#472 |
| 39. | 58483 | 37.0% | 7.2%(+29.8)#39 | 5.8%(+31.2)#493 |
| 40. | 58775 | 36.8% | 7.2%(+29.6)#40 | 5.8%(+31.0)#494 |
| 41. | 58478 | 36.8% | 7.2%(+29.6)#41 | 5.8%(+31.0)#495 |
| 42. | 58231 | 36.5% | 7.2%(+29.3)#42 | 5.8%(+30.7)#507 |
| 43. | 58651 | 36.3% | 7.2%(+29.1)#43 | 5.8%(+30.4)#519 |
| 44. | 58573 | 35.7% | 7.2%(+28.5)#44 | 5.8%(+29.9)#539 |
| 45. | 58486 | 34.3% | 7.2%(+27.1)#45 | 5.8%(+28.5)#570 |
| 46. | 58210 | 34.1% | 7.2%(+26.9)#46 | 5.8%(+28.3)#578 |
| 47. | 58352 | 33.6% | 7.2%(+26.4)#47 | 5.8%(+27.8)#591 |
| 48. | 58549 | 33.3% | 7.2%(+26.1)#48 | 5.8%(+27.5)#601 |
| 49. | 58339 | 33.3% | 7.2%(+26.1)#49 | 5.8%(+27.5)#618 |
| 50. | 58418 | 32.8% | 7.2%(+25.6)#50 | 5.8%(+27.0)#641 |
| 51. | 58057 | 32.8% | 7.2%(+25.6)#51 | 5.8%(+26.9)#643 |
| 52. | 58654 | 32.6% | 7.2%(+25.4)#52 | 5.8%(+26.8)#648 |
| 53. | 58765 | 32.3% | 7.2%(+25.1)#53 | 5.8%(+26.5)#657 |
| 54. | 58011 | 31.9% | 7.2%(+24.7)#54 | 5.8%(+26.1)#678 |
| 55. | 58444 | 31.7% | 7.2%(+24.5)#55 | 5.8%(+25.9)#684 |
| 56. | 58529 | 31.6% | 7.2%(+24.4)#56 | 5.8%(+25.8)#691 |
| 57. | 58454 | 31.4% | 7.2%(+24.2)#57 | 5.8%(+25.6)#703 |
| 58. | 58056 | 30.8% | 7.2%(+23.6)#58 | 5.8%(+25.0)#730 |
| 59. | 58524 | 30.8% | 7.2%(+23.6)#59 | 5.8%(+25.0)#732 |
| 60. | 58769 | 30.6% | 7.2%(+23.4)#60 | 5.8%(+24.8)#738 |
| 61. | 58570 | 30.3% | 7.2%(+23.1)#61 | 5.8%(+24.5)#750 |
| 62. | 58043 | 30.3% | 7.2%(+23.1)#62 | 5.8%(+24.5)#753 |
| 63. | 58243 | 30.0% | 7.2%(+22.8)#63 | 5.8%(+24.2)#764 |
| 64. | 58323 | 30.0% | 7.2%(+22.8)#64 | 5.8%(+24.2)#771 |
| 65. | 58620 | 29.7% | 7.2%(+22.5)#65 | 5.8%(+23.9)#786 |
| 66. | 58332 | 29.5% | 7.2%(+22.3)#66 | 5.8%(+23.7)#796 |
| 67. | 58572 | 29.4% | 7.2%(+22.2)#67 | 5.8%(+23.6)#803 |
| 68. | 58385 | 29.3% | 7.2%(+22.1)#68 | 5.8%(+23.5)#811 |
| 69. | 58734 | 28.8% | 7.2%(+21.6)#69 | 5.8%(+23.0)#835 |
| 70. | 58466 | 28.8% | 7.2%(+21.6)#70 | 5.8%(+22.9)#837 |
| 71. | 58562 | 28.7% | 7.2%(+21.5)#71 | 5.8%(+22.8)#844 |
| 72. | 58712 | 28.6% | 7.2%(+21.4)#72 | 5.8%(+22.8)#858 |
| 73. | 58361 | 28.4% | 7.2%(+21.2)#73 | 5.8%(+22.6)#865 |
| 74. | 58317 | 28.4% | 7.2%(+21.1)#74 | 5.8%(+22.5)#871 |
| 75. | 58353 | 27.5% | 7.2%(+20.3)#75 | 5.8%(+21.7)#924 |
| 76. | 58490 | 27.3% | 7.2%(+20.1)#76 | 5.8%(+21.5)#943 |
| 77. | 58064 | 27.1% | 7.2%(+19.9)#77 | 5.8%(+21.3)#951 |
| 78. | 58632 | 26.8% | 7.2%(+19.6)#78 | 5.8%(+21.0)#973 |
| 79. | 58415 | 26.7% | 7.2%(+19.5)#79 | 5.8%(+20.9)#990 |
| 80. | 58794 | 26.6% | 7.2%(+19.4)#80 | 5.8%(+20.8)#995 |
| 81. | 58429 | 26.5% | 7.2%(+19.3)#81 | 5.8%(+20.7)#998 |
| 82. | 58230 | 26.4% | 7.2%(+19.2)#82 | 5.8%(+20.6)#1,011 |
| 83. | 58355 | 26.3% | 7.2%(+19.1)#83 | 5.8%(+20.5)#1,016 |
| 84. | 58013 | 26.1% | 7.2%(+18.9)#84 | 5.8%(+20.3)#1,036 |
| 85. | 58004 | 26.0% | 7.2%(+18.8)#85 | 5.8%(+20.2)#1,038 |
| 86. | 58254 | 26.0% | 7.2%(+18.8)#86 | 5.8%(+20.2)#1,042 |
| 87. | 58063 | 26.0% | 7.2%(+18.8)#87 | 5.8%(+20.2)#1,043 |
| 88. | 58723 | 25.9% | 7.2%(+18.7)#88 | 5.8%(+20.1)#1,049 |
| 89. | 58223 | 25.8% | 7.2%(+18.5)#89 | 5.8%(+19.9)#1,074 |
| 90. | 58365 | 25.7% | 7.2%(+18.5)#90 | 5.8%(+19.9)#1,077 |
| 91. | 58062 | 25.7% | 7.2%(+18.5)#91 | 5.8%(+19.9)#1,082 |
| 92. | 58647 | 25.6% | 7.2%(+18.4)#92 | 5.8%(+19.8)#1,087 |
| 93. | 58634 | 25.5% | 7.2%(+18.3)#93 | 5.8%(+19.7)#1,102 |
| 94. | 58017 | 25.0% | 7.2%(+17.8)#94 | 5.8%(+19.2)#1,146 |
| 95. | 58413 | 24.9% | 7.2%(+17.6)#95 | 5.8%(+19.0)#1,171 |
| 96. | 58771 | 24.6% | 7.2%(+17.4)#96 | 5.8%(+18.8)#1,191 |
| 97. | 58779 | 24.6% | 7.2%(+17.3)#97 | 5.8%(+18.7)#1,203 |
| 98. | 58650 | 24.5% | 7.2%(+17.3)#98 | 5.8%(+18.7)#1,211 |
| 99. | 58049 | 24.4% | 7.2%(+17.2)#99 | 5.8%(+18.6)#1,220 |
| 100. | 58261 | 24.3% | 7.2%(+17.1)#100 | 5.8%(+18.5)#1,229 |
Common Questions
What are the Top 10 Zip Codes with the Highest Percentage of Self-Employed / Not Incorporated in North Dakota?
Top 10 Zip Codes with the Highest Percentage of Self-Employed / Not Incorporated in North Dakota are:
What zip code has the Highest Percentage of Self-Employed / Not Incorporated in North Dakota?
58310 has the Highest Percentage of Self-Employed / Not Incorporated in North Dakota with 100.0%.
What is the Percentage of Self-Employed / Not Incorporated in the State of North Dakota?
Percentage of Self-Employed / Not Incorporated in North Dakota is 7.2%.
What is the Percentage of Self-Employed / Not Incorporated in the United States?
Percentage of Self-Employed / Not Incorporated in the United States is 5.8%.