Zip Codes with the Highest Percentage of Self-Employed / Not Incorporated in Utah
RELATED REPORTS & OPTIONS
Self-Employed / Not Incorporated
Utah
Compare Zip Codes
Map of Zip Codes with the Highest Percentage of Self-Employed / Not Incorporated in Utah
0.0%
100.0%
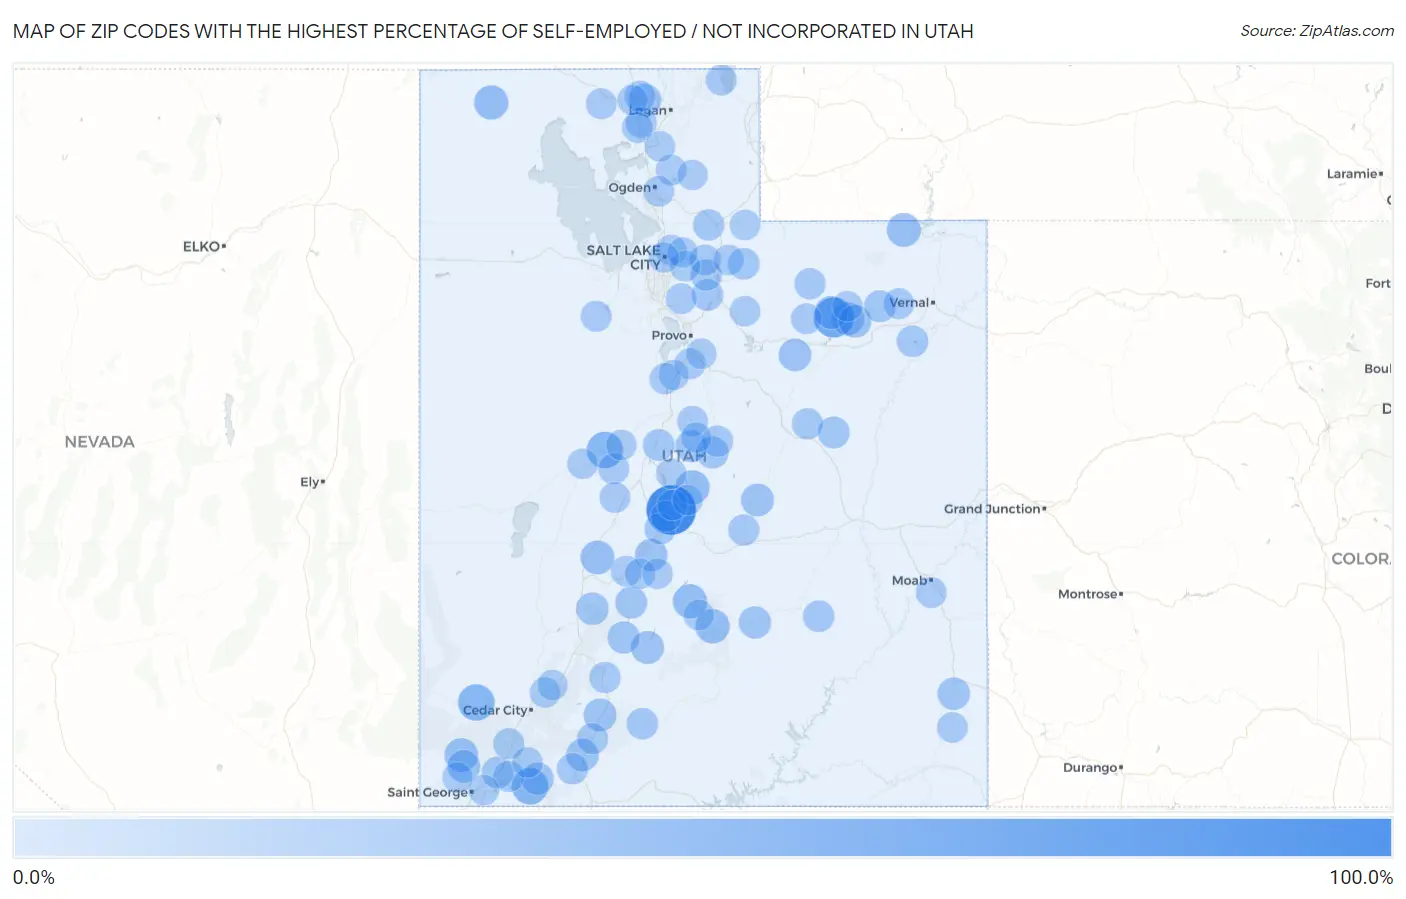
Zip Codes with the Highest Percentage of Self-Employed / Not Incorporated in Utah
| Zip Code | % Self-Employed / Not Incorporated | vs State | vs National | |
| 1. | 84621 | 100.0% | 4.9% (+95.1)#1 | 5.8% (+94.2)#31 |
| 2. | 84073 | 53.3% | 4.9% (+48.4)#2 | 5.8% (+47.5)#182 |
| 3. | 84763 | 35.9% | 4.9% (+31.0)#3 | 5.8% (+30.1)#532 |
| 4. | 84756 | 35.6% | 4.9% (+30.7)#4 | 5.8% (+29.8)#540 |
| 5. | 84640 | 35.6% | 4.9% (+30.7)#5 | 5.8% (+29.8)#542 |
| 6. | 84773 | 25.7% | 4.9% (+20.8)#6 | 5.8% (+19.9)#1,075 |
| 7. | 84665 | 25.0% | 4.9% (+20.1)#7 | 5.8% (+19.2)#1,140 |
| 8. | 84329 | 24.6% | 4.9% (+19.7)#8 | 5.8% (+18.8)#1,200 |
| 9. | 84747 | 24.5% | 4.9% (+19.6)#9 | 5.8% (+18.7)#1,209 |
| 10. | 84046 | 24.0% | 4.9% (+19.1)#10 | 5.8% (+18.2)#1,257 |
| 11. | 84637 | 22.9% | 4.9% (+18.0)#11 | 5.8% (+17.1)#1,366 |
| 12. | 84782 | 21.9% | 4.9% (+17.0)#12 | 5.8% (+16.1)#1,494 |
| 13. | 84001 | 19.5% | 4.9% (+14.6)#13 | 5.8% (+13.7)#1,911 |
| 14. | 84051 | 19.4% | 4.9% (+14.5)#14 | 5.8% (+13.6)#1,937 |
| 15. | 84735 | 18.6% | 4.9% (+13.7)#15 | 5.8% (+12.8)#2,142 |
| 16. | 84712 | 18.6% | 4.9% (+13.7)#16 | 5.8% (+12.8)#2,144 |
| 17. | 84516 | 18.2% | 4.9% (+13.3)#17 | 5.8% (+12.4)#2,271 |
| 18. | 84007 | 18.1% | 4.9% (+13.3)#18 | 5.8% (+12.3)#2,278 |
| 19. | 84783 | 17.5% | 4.9% (+12.6)#19 | 5.8% (+11.7)#2,462 |
| 20. | 84729 | 17.2% | 4.9% (+12.3)#20 | 5.8% (+11.4)#2,569 |
| 21. | 84730 | 17.1% | 4.9% (+12.2)#21 | 5.8% (+11.3)#2,600 |
| 22. | 84027 | 17.0% | 4.9% (+12.1)#22 | 5.8% (+11.2)#2,642 |
| 23. | 84535 | 16.7% | 4.9% (+11.8)#23 | 5.8% (+10.9)#2,727 |
| 24. | 84306 | 16.7% | 4.9% (+11.8)#24 | 5.8% (+10.9)#2,739 |
| 25. | 84713 | 16.5% | 4.9% (+11.6)#25 | 5.8% (+10.6)#2,819 |
| 26. | 84775 | 16.1% | 4.9% (+11.2)#26 | 5.8% (+10.3)#2,925 |
| 27. | 84767 | 15.7% | 4.9% (+10.8)#27 | 5.8% (+9.92)#3,102 |
| 28. | 84723 | 15.4% | 4.9% (+10.5)#28 | 5.8% (+9.57)#3,236 |
| 29. | 84662 | 14.5% | 4.9% (+9.60)#29 | 5.8% (+8.67)#3,660 |
| 30. | 84667 | 14.3% | 4.9% (+9.40)#30 | 5.8% (+8.47)#3,738 |
| 31. | 84750 | 14.0% | 4.9% (+9.13)#31 | 5.8% (+8.20)#3,888 |
| 32. | 84053 | 13.6% | 4.9% (+8.73)#32 | 5.8% (+7.81)#4,118 |
| 33. | 84539 | 13.4% | 4.9% (+8.53)#33 | 5.8% (+7.60)#4,238 |
| 34. | 84055 | 12.8% | 4.9% (+7.96)#34 | 5.8% (+7.03)#4,631 |
| 35. | 84746 | 12.8% | 4.9% (+7.95)#35 | 5.8% (+7.02)#4,637 |
| 36. | 84639 | 12.8% | 4.9% (+7.93)#36 | 5.8% (+7.00)#4,647 |
| 37. | 84049 | 12.8% | 4.9% (+7.87)#37 | 5.8% (+6.95)#4,683 |
| 38. | 84063 | 12.1% | 4.9% (+7.18)#38 | 5.8% (+6.25)#5,232 |
| 39. | 84734 | 12.0% | 4.9% (+7.11)#39 | 5.8% (+6.18)#5,296 |
| 40. | 84718 | 11.7% | 4.9% (+6.79)#40 | 5.8% (+5.86)#5,558 |
| 41. | 84758 | 11.2% | 4.9% (+6.36)#41 | 5.8% (+5.43)#5,954 |
| 42. | 84033 | 11.2% | 4.9% (+6.27)#42 | 5.8% (+5.34)#6,051 |
| 43. | 84060 | 11.1% | 4.9% (+6.26)#43 | 5.8% (+5.33)#6,058 |
| 44. | 84620 | 10.8% | 4.9% (+5.92)#44 | 5.8% (+4.99)#6,417 |
| 45. | 84542 | 10.7% | 4.9% (+5.81)#45 | 5.8% (+4.88)#6,546 |
| 46. | 84647 | 10.7% | 4.9% (+5.80)#46 | 5.8% (+4.87)#6,564 |
| 47. | 84031 | 10.6% | 4.9% (+5.75)#47 | 5.8% (+4.82)#6,615 |
| 48. | 84745 | 10.6% | 4.9% (+5.74)#48 | 5.8% (+4.82)#6,621 |
| 49. | 84522 | 10.3% | 4.9% (+5.40)#49 | 5.8% (+4.47)#7,022 |
| 50. | 84759 | 10.1% | 4.9% (+5.20)#50 | 5.8% (+4.27)#7,246 |
| 51. | 84710 | 9.9% | 4.9% (+4.97)#51 | 5.8% (+4.04)#7,534 |
| 52. | 84757 | 9.8% | 4.9% (+4.90)#52 | 5.8% (+3.97)#7,639 |
| 53. | 84098 | 9.7% | 4.9% (+4.84)#53 | 5.8% (+3.91)#7,728 |
| 54. | 84311 | 9.6% | 4.9% (+4.72)#54 | 5.8% (+3.79)#7,883 |
| 55. | 84652 | 9.6% | 4.9% (+4.70)#55 | 5.8% (+3.77)#7,908 |
| 56. | 84076 | 9.4% | 4.9% (+4.47)#56 | 5.8% (+3.54)#8,227 |
| 57. | 84633 | 9.3% | 4.9% (+4.38)#57 | 5.8% (+3.46)#8,345 |
| 58. | 84004 | 9.2% | 4.9% (+4.34)#58 | 5.8% (+3.41)#8,417 |
| 59. | 84649 | 9.1% | 4.9% (+4.20)#59 | 5.8% (+3.28)#8,636 |
| 60. | 84028 | 8.9% | 4.9% (+4.01)#60 | 5.8% (+3.08)#8,963 |
| 61. | 84069 | 8.9% | 4.9% (+4.00)#61 | 5.8% (+3.07)#8,983 |
| 62. | 84653 | 8.9% | 4.9% (+4.00)#62 | 5.8% (+3.07)#8,987 |
| 63. | 84636 | 8.8% | 4.9% (+3.90)#63 | 5.8% (+2.97)#9,169 |
| 64. | 84314 | 8.6% | 4.9% (+3.71)#64 | 5.8% (+2.78)#9,469 |
| 65. | 84316 | 8.5% | 4.9% (+3.65)#65 | 5.8% (+2.72)#9,593 |
| 66. | 84301 | 8.4% | 4.9% (+3.54)#66 | 5.8% (+2.61)#9,794 |
| 67. | 84532 | 8.4% | 4.9% (+3.53)#67 | 5.8% (+2.60)#9,804 |
| 68. | 84739 | 8.3% | 4.9% (+3.36)#68 | 5.8% (+2.44)#10,135 |
| 69. | 84632 | 8.1% | 4.9% (+3.22)#69 | 5.8% (+2.29)#10,418 |
| 70. | 84072 | 8.1% | 4.9% (+3.19)#70 | 5.8% (+2.26)#10,490 |
| 71. | 84310 | 7.8% | 4.9% (+2.91)#71 | 5.8% (+1.98)#11,074 |
| 72. | 84622 | 7.8% | 4.9% (+2.87)#72 | 5.8% (+1.95)#11,154 |
| 73. | 84061 | 7.7% | 4.9% (+2.84)#73 | 5.8% (+1.91)#11,230 |
| 74. | 84408 | 7.7% | 4.9% (+2.80)#74 | 5.8% (+1.88)#11,330 |
| 75. | 84511 | 7.7% | 4.9% (+2.80)#75 | 5.8% (+1.87)#11,339 |
| 76. | 84779 | 7.6% | 4.9% (+2.72)#76 | 5.8% (+1.79)#11,511 |
| 77. | 84715 | 7.5% | 4.9% (+2.62)#77 | 5.8% (+1.69)#11,754 |
| 78. | 84324 | 7.5% | 4.9% (+2.62)#78 | 5.8% (+1.69)#11,770 |
| 79. | 84780 | 7.5% | 4.9% (+2.57)#79 | 5.8% (+1.64)#11,876 |
| 80. | 84312 | 7.4% | 4.9% (+2.54)#80 | 5.8% (+1.61)#11,956 |
| 81. | 84772 | 7.4% | 4.9% (+2.52)#81 | 5.8% (+1.59)#12,019 |
| 82. | 84664 | 7.4% | 4.9% (+2.50)#82 | 5.8% (+1.57)#12,094 |
| 83. | 84017 | 7.4% | 4.9% (+2.47)#83 | 5.8% (+1.54)#12,149 |
| 84. | 84643 | 7.3% | 4.9% (+2.44)#84 | 5.8% (+1.51)#12,227 |
| 85. | 84103 | 7.3% | 4.9% (+2.41)#85 | 5.8% (+1.49)#12,282 |
| 86. | 84638 | 7.3% | 4.9% (+2.40)#86 | 5.8% (+1.47)#12,314 |
| 87. | 84738 | 7.2% | 4.9% (+2.34)#87 | 5.8% (+1.41)#12,438 |
| 88. | 84624 | 7.2% | 4.9% (+2.27)#88 | 5.8% (+1.35)#12,587 |
| 89. | 84032 | 7.1% | 4.9% (+2.23)#89 | 5.8% (+1.31)#12,701 |
| 90. | 84109 | 7.1% | 4.9% (+2.17)#90 | 5.8% (+1.25)#12,862 |
| 91. | 84630 | 7.0% | 4.9% (+2.09)#91 | 5.8% (+1.16)#13,115 |
| 92. | 84754 | 6.9% | 4.9% (+2.06)#92 | 5.8% (+1.13)#13,197 |
| 93. | 84744 | 6.9% | 4.9% (+2.06)#93 | 5.8% (+1.13)#13,200 |
| 94. | 84655 | 6.9% | 4.9% (+2.00)#94 | 5.8% (+1.07)#13,371 |
| 95. | 84646 | 6.8% | 4.9% (+1.90)#95 | 5.8% (+0.973)#13,616 |
| 96. | 84002 | 6.7% | 4.9% (+1.83)#96 | 5.8% (+0.907)#13,799 |
| 97. | 84108 | 6.7% | 4.9% (+1.82)#97 | 5.8% (+0.892)#13,842 |
| 98. | 84761 | 6.7% | 4.9% (+1.80)#98 | 5.8% (+0.876)#13,889 |
| 99. | 84317 | 6.6% | 4.9% (+1.70)#99 | 5.8% (+0.776)#14,159 |
| 100. | 84101 | 6.6% | 4.9% (+1.70)#100 | 5.8% (+0.772)#14,177 |
Common Questions
What are the Top 10 Zip Codes with the Highest Percentage of Self-Employed / Not Incorporated in Utah?
Top 10 Zip Codes with the Highest Percentage of Self-Employed / Not Incorporated in Utah are:
What zip code has the Highest Percentage of Self-Employed / Not Incorporated in Utah?
84621 has the Highest Percentage of Self-Employed / Not Incorporated in Utah with 100.0%.
What is the Percentage of Self-Employed / Not Incorporated in the State of Utah?
Percentage of Self-Employed / Not Incorporated in Utah is 4.9%.
What is the Percentage of Self-Employed / Not Incorporated in the United States?
Percentage of Self-Employed / Not Incorporated in the United States is 5.8%.