Zip Codes with the Highest Percentage of Self-Employed / Not Incorporated in New Hampshire
RELATED REPORTS & OPTIONS
Self-Employed / Not Incorporated
New Hampshire
Compare Zip Codes
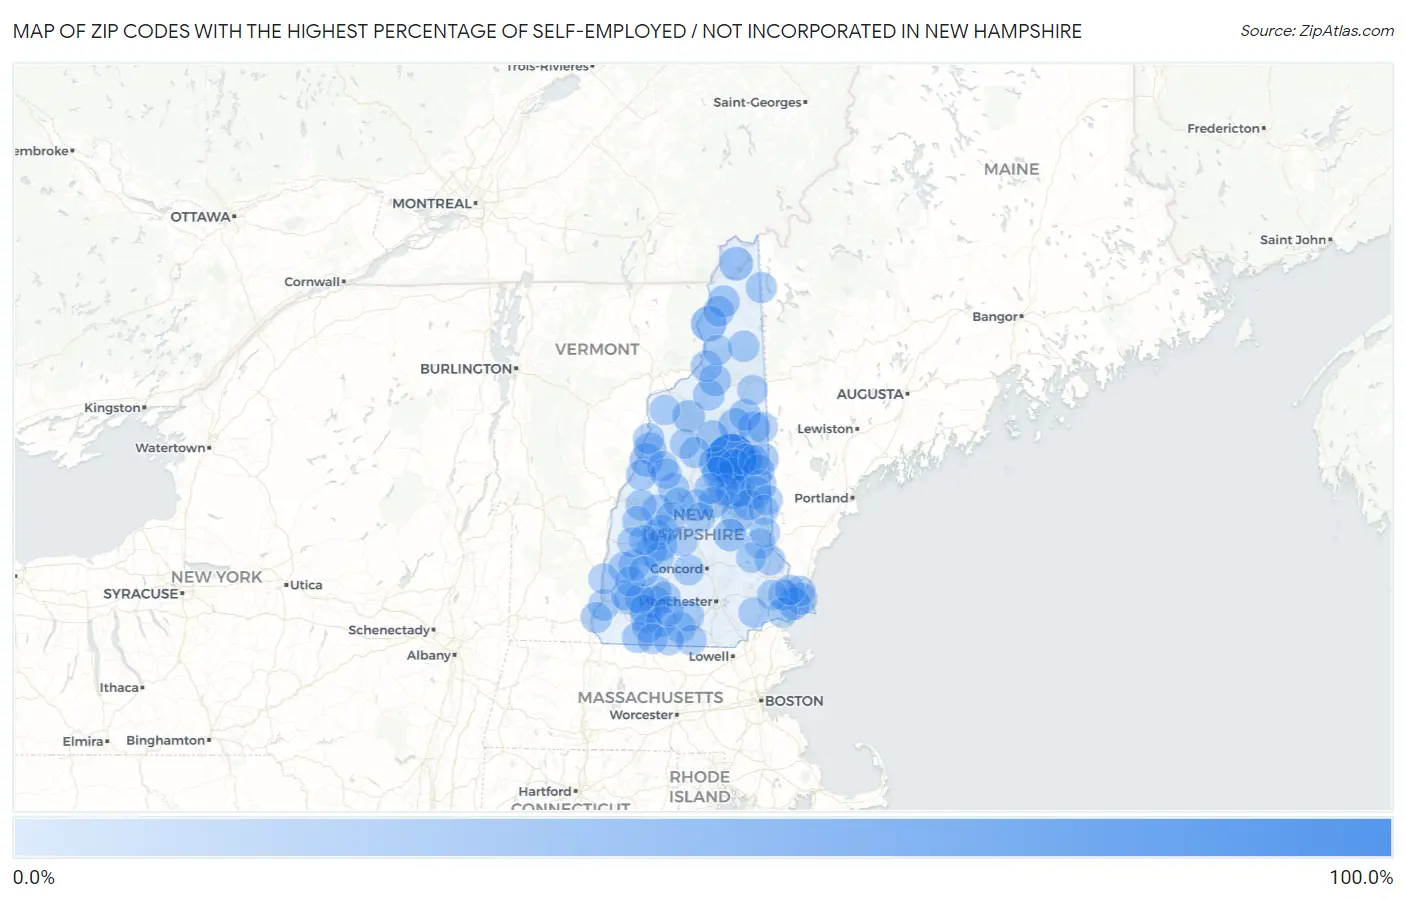
Map of Zip Codes with the Highest Percentage of Self-Employed / Not Incorporated in New Hampshire
0.0%
100.0%
Zip Codes with the Highest Percentage of Self-Employed / Not Incorporated in New Hampshire
| Zip Code | % Self-Employed / Not Incorporated | vs State | vs National | |
| 1. | 03897 | 100.0% | 6.2%(+93.8)#1 | 5.8%(+94.2)#50 |
| 2. | 03590 | 31.6% | 6.2%(+25.4)#2 | 5.8%(+25.8)#690 |
| 3. | 03850 | 31.4% | 6.2%(+25.2)#3 | 5.8%(+25.6)#702 |
| 4. | 03259 | 28.7% | 6.2%(+22.4)#4 | 5.8%(+22.9)#841 |
| 5. | 03592 | 24.3% | 6.2%(+18.1)#5 | 5.8%(+18.5)#1,227 |
| 6. | 03812 | 21.9% | 6.2%(+15.7)#6 | 5.8%(+16.1)#1,479 |
| 7. | 03777 | 21.7% | 6.2%(+15.5)#7 | 5.8%(+15.9)#1,530 |
| 8. | 03875 | 19.8% | 6.2%(+13.5)#8 | 5.8%(+14.0)#1,869 |
| 9. | 03810 | 19.7% | 6.2%(+13.5)#9 | 5.8%(+13.9)#1,877 |
| 10. | 03580 | 18.8% | 6.2%(+12.5)#10 | 5.8%(+13.0)#2,092 |
| 11. | 03837 | 18.7% | 6.2%(+12.5)#11 | 5.8%(+12.9)#2,117 |
| 12. | 03883 | 18.7% | 6.2%(+12.5)#12 | 5.8%(+12.9)#2,118 |
| 13. | 03779 | 18.3% | 6.2%(+12.0)#13 | 5.8%(+12.5)#2,240 |
| 14. | 03832 | 17.9% | 6.2%(+11.6)#14 | 5.8%(+12.0)#2,351 |
| 15. | 03845 | 17.6% | 6.2%(+11.3)#15 | 5.8%(+11.7)#2,451 |
| 16. | 03871 | 17.3% | 6.2%(+11.1)#16 | 5.8%(+11.5)#2,533 |
| 17. | 03215 | 17.1% | 6.2%(+10.9)#17 | 5.8%(+11.3)#2,606 |
| 18. | 03583 | 16.6% | 6.2%(+10.3)#18 | 5.8%(+10.7)#2,789 |
| 19. | 03886 | 16.3% | 6.2%(+10.1)#19 | 5.8%(+10.5)#2,855 |
| 20. | 03449 | 16.2% | 6.2%(+10.0)#20 | 5.8%(+10.4)#2,887 |
| 21. | 03864 | 16.2% | 6.2%(+9.95)#21 | 5.8%(+10.4)#2,910 |
| 22. | 03870 | 15.8% | 6.2%(+9.61)#22 | 5.8%(+10.0)#3,051 |
| 23. | 03846 | 15.3% | 6.2%(+9.02)#23 | 5.8%(+9.44)#3,300 |
| 24. | 03260 | 15.2% | 6.2%(+8.99)#24 | 5.8%(+9.41)#3,316 |
| 25. | 03576 | 15.1% | 6.2%(+8.89)#25 | 5.8%(+9.31)#3,360 |
| 26. | 03444 | 14.6% | 6.2%(+8.34)#26 | 5.8%(+8.76)#3,618 |
| 27. | 03816 | 14.4% | 6.2%(+8.17)#27 | 5.8%(+8.59)#3,699 |
| 28. | 03595 | 14.2% | 6.2%(+7.98)#28 | 5.8%(+8.40)#3,792 |
| 29. | 03584 | 13.9% | 6.2%(+7.65)#29 | 5.8%(+8.07)#3,974 |
| 30. | 03256 | 13.7% | 6.2%(+7.45)#30 | 5.8%(+7.87)#4,080 |
| 31. | 03254 | 13.7% | 6.2%(+7.43)#31 | 5.8%(+7.85)#4,089 |
| 32. | 03241 | 13.6% | 6.2%(+7.40)#32 | 5.8%(+7.82)#4,103 |
| 33. | 03588 | 13.4% | 6.2%(+7.12)#33 | 5.8%(+7.54)#4,270 |
| 34. | 03836 | 13.2% | 6.2%(+6.99)#34 | 5.8%(+7.40)#4,376 |
| 35. | 03227 | 13.2% | 6.2%(+6.96)#35 | 5.8%(+7.37)#4,402 |
| 36. | 03086 | 13.0% | 6.2%(+6.79)#36 | 5.8%(+7.21)#4,510 |
| 37. | 03445 | 13.0% | 6.2%(+6.76)#37 | 5.8%(+7.17)#4,533 |
| 38. | 03253 | 12.8% | 6.2%(+6.52)#38 | 5.8%(+6.93)#4,689 |
| 39. | 03255 | 12.7% | 6.2%(+6.51)#39 | 5.8%(+6.93)#4,693 |
| 40. | 03467 | 12.7% | 6.2%(+6.51)#40 | 5.8%(+6.92)#4,702 |
| 41. | 03442 | 12.6% | 6.2%(+6.41)#41 | 5.8%(+6.83)#4,766 |
| 42. | 03240 | 12.6% | 6.2%(+6.36)#42 | 5.8%(+6.77)#4,810 |
| 43. | 03765 | 12.4% | 6.2%(+6.21)#43 | 5.8%(+6.63)#4,932 |
| 44. | 03748 | 12.4% | 6.2%(+6.21)#44 | 5.8%(+6.63)#4,934 |
| 45. | 03579 | 12.4% | 6.2%(+6.18)#45 | 5.8%(+6.60)#4,957 |
| 46. | 03466 | 12.4% | 6.2%(+6.18)#46 | 5.8%(+6.59)#4,962 |
| 47. | 03226 | 12.1% | 6.2%(+5.82)#47 | 5.8%(+6.24)#5,244 |
| 48. | 03607 | 11.9% | 6.2%(+5.70)#48 | 5.8%(+6.12)#5,330 |
| 49. | 03597 | 11.8% | 6.2%(+5.59)#49 | 5.8%(+6.01)#5,418 |
| 50. | 03448 | 11.8% | 6.2%(+5.55)#50 | 5.8%(+5.97)#5,464 |
| 51. | 03894 | 11.7% | 6.2%(+5.45)#51 | 5.8%(+5.87)#5,557 |
| 52. | 03450 | 11.5% | 6.2%(+5.30)#52 | 5.8%(+5.71)#5,674 |
| 53. | 03057 | 11.5% | 6.2%(+5.22)#53 | 5.8%(+5.64)#5,755 |
| 54. | 03447 | 11.4% | 6.2%(+5.21)#54 | 5.8%(+5.63)#5,773 |
| 55. | 03605 | 11.4% | 6.2%(+5.19)#55 | 5.8%(+5.61)#5,793 |
| 56. | 03285 | 11.4% | 6.2%(+5.17)#56 | 5.8%(+5.59)#5,816 |
| 57. | 03452 | 11.3% | 6.2%(+5.08)#57 | 5.8%(+5.50)#5,886 |
| 58. | 03854 | 11.2% | 6.2%(+5.00)#58 | 5.8%(+5.41)#5,969 |
| 59. | 03229 | 11.1% | 6.2%(+4.88)#59 | 5.8%(+5.30)#6,079 |
| 60. | 03282 | 11.1% | 6.2%(+4.85)#60 | 5.8%(+5.27)#6,119 |
| 61. | 03440 | 11.1% | 6.2%(+4.82)#61 | 5.8%(+5.24)#6,146 |
| 62. | 03813 | 11.0% | 6.2%(+4.74)#62 | 5.8%(+5.16)#6,234 |
| 63. | 03840 | 11.0% | 6.2%(+4.73)#63 | 5.8%(+5.15)#6,238 |
| 64. | 03033 | 10.5% | 6.2%(+4.31)#64 | 5.8%(+4.73)#6,717 |
| 65. | 03609 | 10.5% | 6.2%(+4.29)#65 | 5.8%(+4.71)#6,741 |
| 66. | 03458 | 10.5% | 6.2%(+4.23)#66 | 5.8%(+4.65)#6,805 |
| 67. | 03266 | 10.4% | 6.2%(+4.20)#67 | 5.8%(+4.62)#6,853 |
| 68. | 03257 | 10.2% | 6.2%(+4.00)#68 | 5.8%(+4.41)#7,089 |
| 69. | 03856 | 10.2% | 6.2%(+3.94)#69 | 5.8%(+4.36)#7,149 |
| 70. | 03839 | 10.1% | 6.2%(+3.89)#70 | 5.8%(+4.31)#7,196 |
| 71. | 03287 | 10.1% | 6.2%(+3.87)#71 | 5.8%(+4.28)#7,236 |
| 72. | 03882 | 10.1% | 6.2%(+3.86)#72 | 5.8%(+4.28)#7,242 |
| 73. | 03071 | 10.1% | 6.2%(+3.85)#73 | 5.8%(+4.27)#7,248 |
| 74. | 03753 | 10.0% | 6.2%(+3.77)#74 | 5.8%(+4.19)#7,349 |
| 75. | 03230 | 9.9% | 6.2%(+3.71)#75 | 5.8%(+4.13)#7,435 |
| 76. | 03819 | 9.9% | 6.2%(+3.63)#76 | 5.8%(+4.05)#7,521 |
| 77. | 03768 | 9.8% | 6.2%(+3.55)#77 | 5.8%(+3.96)#7,658 |
| 78. | 03830 | 9.7% | 6.2%(+3.45)#78 | 5.8%(+3.87)#7,765 |
| 79. | 03457 | 9.7% | 6.2%(+3.45)#79 | 5.8%(+3.87)#7,772 |
| 80. | 03222 | 9.4% | 6.2%(+3.15)#80 | 5.8%(+3.57)#8,178 |
| 81. | 03221 | 9.3% | 6.2%(+3.08)#81 | 5.8%(+3.50)#8,288 |
| 82. | 03849 | 9.3% | 6.2%(+3.07)#82 | 5.8%(+3.49)#8,300 |
| 83. | 03461 | 9.3% | 6.2%(+3.05)#83 | 5.8%(+3.47)#8,330 |
| 84. | 03581 | 9.2% | 6.2%(+2.99)#84 | 5.8%(+3.41)#8,426 |
| 85. | 03835 | 9.2% | 6.2%(+2.96)#85 | 5.8%(+3.38)#8,468 |
| 86. | 03773 | 9.2% | 6.2%(+2.94)#86 | 5.8%(+3.36)#8,503 |
| 87. | 03585 | 9.2% | 6.2%(+2.94)#87 | 5.8%(+3.36)#8,507 |
| 88. | 03582 | 9.0% | 6.2%(+2.76)#88 | 5.8%(+3.18)#8,787 |
| 89. | 03268 | 8.9% | 6.2%(+2.66)#89 | 5.8%(+3.08)#8,962 |
| 90. | 03872 | 8.8% | 6.2%(+2.61)#90 | 5.8%(+3.02)#9,078 |
| 91. | 03844 | 8.8% | 6.2%(+2.60)#91 | 5.8%(+3.02)#9,092 |
| 92. | 03884 | 8.8% | 6.2%(+2.55)#92 | 5.8%(+2.97)#9,165 |
| 93. | 03269 | 8.7% | 6.2%(+2.49)#93 | 5.8%(+2.91)#9,286 |
| 94. | 03801 | 8.7% | 6.2%(+2.46)#94 | 5.8%(+2.88)#9,311 |
| 95. | 03456 | 8.7% | 6.2%(+2.42)#95 | 5.8%(+2.84)#9,371 |
| 96. | 03280 | 8.6% | 6.2%(+2.39)#96 | 5.8%(+2.81)#9,418 |
| 97. | 03782 | 8.6% | 6.2%(+2.38)#97 | 5.8%(+2.80)#9,433 |
| 98. | 03047 | 8.5% | 6.2%(+2.27)#98 | 5.8%(+2.69)#9,645 |
| 99. | 03851 | 8.5% | 6.2%(+2.26)#99 | 5.8%(+2.68)#9,661 |
| 100. | 03262 | 8.5% | 6.2%(+2.23)#100 | 5.8%(+2.65)#9,721 |
Common Questions
What are the Top 10 Zip Codes with the Highest Percentage of Self-Employed / Not Incorporated in New Hampshire?
Top 10 Zip Codes with the Highest Percentage of Self-Employed / Not Incorporated in New Hampshire are:
What zip code has the Highest Percentage of Self-Employed / Not Incorporated in New Hampshire?
03897 has the Highest Percentage of Self-Employed / Not Incorporated in New Hampshire with 100.0%.
What is the Percentage of Self-Employed / Not Incorporated in the State of New Hampshire?
Percentage of Self-Employed / Not Incorporated in New Hampshire is 6.2%.
What is the Percentage of Self-Employed / Not Incorporated in the United States?
Percentage of Self-Employed / Not Incorporated in the United States is 5.8%.