Zip Codes with the Highest Percentage of Self-Employed / Not Incorporated in Minnesota
RELATED REPORTS & OPTIONS
Self-Employed / Not Incorporated
Minnesota
Compare Zip Codes
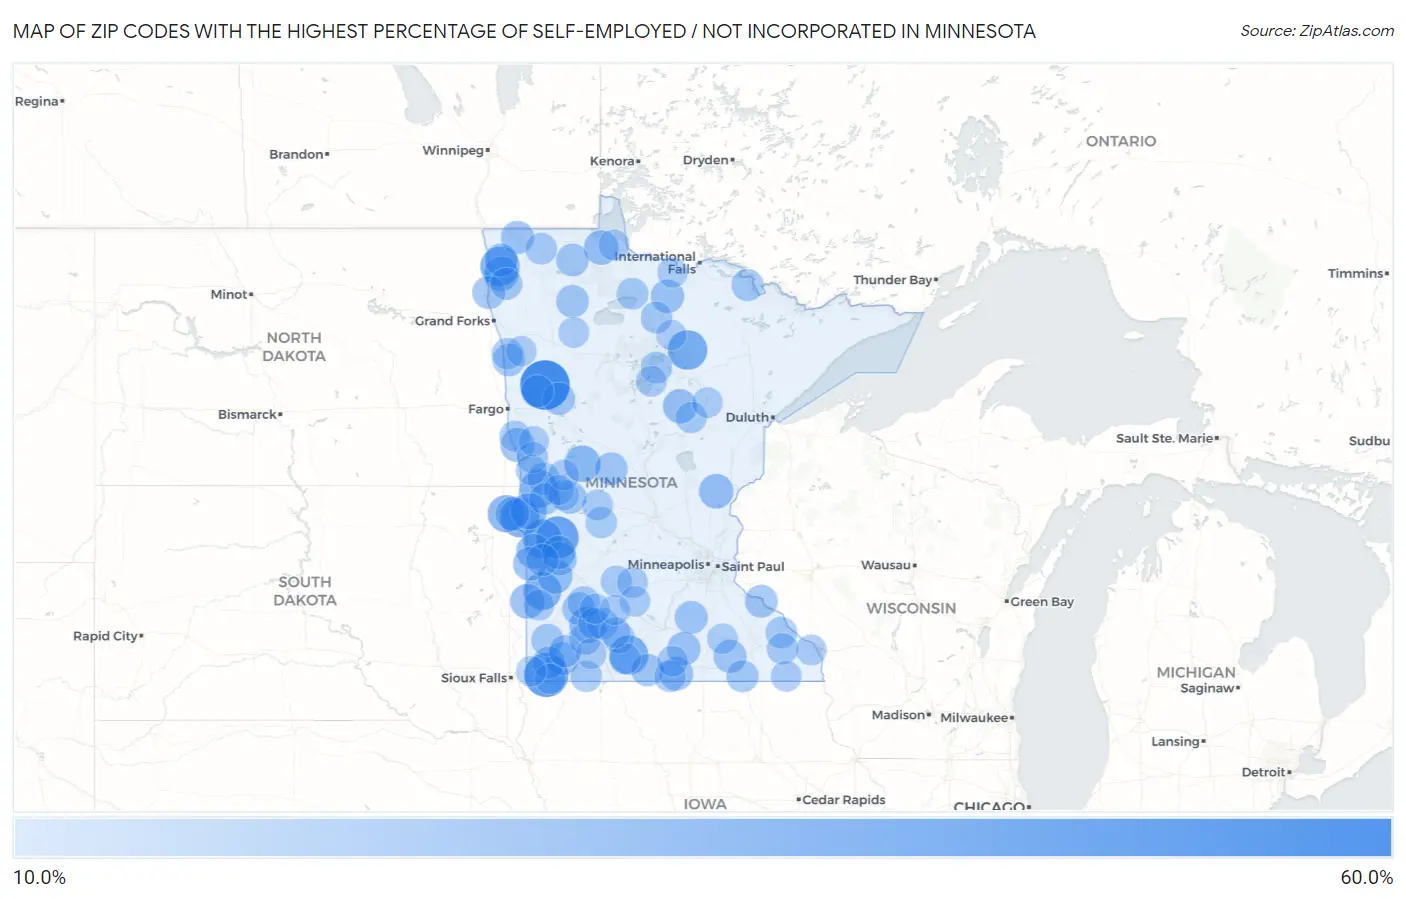
Map of Zip Codes with the Highest Percentage of Self-Employed / Not Incorporated in Minnesota
10.0%
60.0%
Zip Codes with the Highest Percentage of Self-Employed / Not Incorporated in Minnesota
| Zip Code | % Self-Employed / Not Incorporated | vs State | vs National | |
| 1. | 56541 | 55.6% | 5.2%(+50.4)#1 | 5.8%(+49.7)#165 |
| 2. | 56146 | 43.3% | 5.2%(+38.1)#2 | 5.8%(+37.5)#331 |
| 3. | 56249 | 39.5% | 5.2%(+34.3)#3 | 5.8%(+33.7)#421 |
| 4. | 56657 | 33.9% | 5.2%(+28.7)#4 | 5.8%(+28.1)#582 |
| 5. | 56210 | 33.3% | 5.2%(+28.1)#5 | 5.8%(+27.5)#619 |
| 6. | 56720 | 33.3% | 5.2%(+28.1)#6 | 5.8%(+27.5)#621 |
| 7. | 56162 | 32.8% | 5.2%(+27.6)#7 | 5.8%(+27.0)#642 |
| 8. | 56227 | 32.3% | 5.2%(+27.1)#8 | 5.8%(+26.5)#656 |
| 9. | 56280 | 30.0% | 5.2%(+24.8)#9 | 5.8%(+24.2)#765 |
| 10. | 56274 | 30.0% | 5.2%(+24.8)#10 | 5.8%(+24.2)#768 |
| 11. | 56219 | 28.6% | 5.2%(+23.4)#11 | 5.8%(+22.8)#848 |
| 12. | 56588 | 27.1% | 5.2%(+21.9)#12 | 5.8%(+21.3)#952 |
| 13. | 56166 | 27.0% | 5.2%(+21.8)#13 | 5.8%(+21.2)#958 |
| 14. | 56236 | 26.5% | 5.2%(+21.3)#14 | 5.8%(+20.7)#999 |
| 15. | 56212 | 23.9% | 5.2%(+18.7)#15 | 5.8%(+18.1)#1,264 |
| 16. | 56218 | 23.7% | 5.2%(+18.5)#16 | 5.8%(+17.9)#1,287 |
| 17. | 56136 | 23.6% | 5.2%(+18.4)#17 | 5.8%(+17.8)#1,296 |
| 18. | 56673 | 23.2% | 5.2%(+18.0)#18 | 5.8%(+17.4)#1,334 |
| 19. | 55036 | 23.1% | 5.2%(+17.9)#19 | 5.8%(+17.3)#1,348 |
| 20. | 56757 | 23.1% | 5.2%(+17.9)#20 | 5.8%(+17.2)#1,349 |
| 21. | 55785 | 22.4% | 5.2%(+17.2)#21 | 5.8%(+16.6)#1,425 |
| 22. | 56553 | 22.1% | 5.2%(+16.9)#22 | 5.8%(+16.3)#1,464 |
| 23. | 56257 | 21.8% | 5.2%(+16.6)#23 | 5.8%(+16.0)#1,505 |
| 24. | 56211 | 21.8% | 5.2%(+16.6)#24 | 5.8%(+16.0)#1,513 |
| 25. | 56014 | 21.4% | 5.2%(+16.2)#25 | 5.8%(+15.6)#1,569 |
| 26. | 56295 | 20.8% | 5.2%(+15.6)#26 | 5.8%(+15.0)#1,679 |
| 27. | 56262 | 20.8% | 5.2%(+15.6)#27 | 5.8%(+14.9)#1,683 |
| 28. | 56091 | 20.7% | 5.2%(+15.5)#28 | 5.8%(+14.8)#1,700 |
| 29. | 56627 | 20.6% | 5.2%(+15.4)#29 | 5.8%(+14.8)#1,707 |
| 30. | 56735 | 20.1% | 5.2%(+14.9)#30 | 5.8%(+14.2)#1,796 |
| 31. | 55982 | 20.0% | 5.2%(+14.8)#31 | 5.8%(+14.2)#1,809 |
| 32. | 56052 | 19.9% | 5.2%(+14.7)#32 | 5.8%(+14.1)#1,837 |
| 33. | 56185 | 19.8% | 5.2%(+14.6)#33 | 5.8%(+14.0)#1,859 |
| 34. | 56733 | 19.7% | 5.2%(+14.5)#34 | 5.8%(+13.8)#1,884 |
| 35. | 56744 | 19.6% | 5.2%(+14.4)#35 | 5.8%(+13.8)#1,904 |
| 36. | 56440 | 19.4% | 5.2%(+14.2)#36 | 5.8%(+13.6)#1,931 |
| 37. | 56761 | 19.2% | 5.2%(+14.1)#37 | 5.8%(+13.4)#1,958 |
| 38. | 56263 | 19.2% | 5.2%(+14.0)#38 | 5.8%(+13.4)#1,974 |
| 39. | 55026 | 19.2% | 5.2%(+14.0)#39 | 5.8%(+13.4)#1,984 |
| 40. | 56725 | 19.1% | 5.2%(+13.9)#40 | 5.8%(+13.3)#2,014 |
| 41. | 56343 | 18.9% | 5.2%(+13.7)#41 | 5.8%(+13.0)#2,076 |
| 42. | 56039 | 18.8% | 5.2%(+13.6)#42 | 5.8%(+13.0)#2,081 |
| 43. | 56521 | 18.8% | 5.2%(+13.6)#43 | 5.8%(+13.0)#2,088 |
| 44. | 56186 | 18.7% | 5.2%(+13.5)#44 | 5.8%(+12.9)#2,114 |
| 45. | 56581 | 18.6% | 5.2%(+13.4)#45 | 5.8%(+12.8)#2,141 |
| 46. | 56292 | 18.6% | 5.2%(+13.4)#46 | 5.8%(+12.8)#2,148 |
| 47. | 56585 | 18.5% | 5.2%(+13.3)#47 | 5.8%(+12.7)#2,162 |
| 48. | 56256 | 18.3% | 5.2%(+13.1)#48 | 5.8%(+12.5)#2,246 |
| 49. | 56147 | 18.2% | 5.2%(+13.0)#49 | 5.8%(+12.4)#2,269 |
| 50. | 56141 | 18.1% | 5.2%(+12.9)#50 | 5.8%(+12.3)#2,287 |
| 51. | 56183 | 17.9% | 5.2%(+12.7)#51 | 5.8%(+12.1)#2,339 |
| 52. | 56590 | 17.9% | 5.2%(+12.7)#52 | 5.8%(+12.0)#2,350 |
| 53. | 56713 | 17.8% | 5.2%(+12.6)#53 | 5.8%(+12.0)#2,358 |
| 54. | 55725 | 17.8% | 5.2%(+12.6)#54 | 5.8%(+12.0)#2,380 |
| 55. | 55977 | 17.6% | 5.2%(+12.5)#55 | 5.8%(+11.8)#2,414 |
| 56. | 56660 | 17.2% | 5.2%(+12.0)#56 | 5.8%(+11.4)#2,557 |
| 57. | 56685 | 17.1% | 5.2%(+11.9)#57 | 5.8%(+11.3)#2,591 |
| 58. | 56248 | 17.1% | 5.2%(+11.9)#58 | 5.8%(+11.3)#2,596 |
| 59. | 56626 | 17.1% | 5.2%(+11.9)#59 | 5.8%(+11.3)#2,599 |
| 60. | 56022 | 17.1% | 5.2%(+11.9)#60 | 5.8%(+11.3)#2,614 |
| 61. | 56083 | 17.0% | 5.2%(+11.8)#61 | 5.8%(+11.2)#2,621 |
| 62. | 56033 | 16.8% | 5.2%(+11.6)#62 | 5.8%(+10.9)#2,705 |
| 63. | 56726 | 16.7% | 5.2%(+11.5)#63 | 5.8%(+10.9)#2,722 |
| 64. | 55910 | 16.5% | 5.2%(+11.3)#64 | 5.8%(+10.7)#2,794 |
| 65. | 55979 | 16.4% | 5.2%(+11.2)#65 | 5.8%(+10.6)#2,842 |
| 66. | 56568 | 16.4% | 5.2%(+11.2)#66 | 5.8%(+10.5)#2,851 |
| 67. | 56152 | 16.4% | 5.2%(+11.2)#67 | 5.8%(+10.5)#2,853 |
| 68. | 56167 | 16.3% | 5.2%(+11.1)#68 | 5.8%(+10.5)#2,858 |
| 69. | 56316 | 16.2% | 5.2%(+11.0)#69 | 5.8%(+10.3)#2,919 |
| 70. | 56176 | 16.0% | 5.2%(+10.8)#70 | 5.8%(+10.2)#2,970 |
| 71. | 55310 | 15.9% | 5.2%(+10.7)#71 | 5.8%(+10.0)#3,039 |
| 72. | 56469 | 15.8% | 5.2%(+10.6)#72 | 5.8%(+10.0)#3,048 |
| 73. | 56594 | 15.8% | 5.2%(+10.6)#73 | 5.8%(+9.95)#3,091 |
| 74. | 56543 | 15.7% | 5.2%(+10.5)#74 | 5.8%(+9.84)#3,141 |
| 75. | 56522 | 15.5% | 5.2%(+10.3)#75 | 5.8%(+9.64)#3,215 |
| 76. | 56142 | 15.4% | 5.2%(+10.2)#76 | 5.8%(+9.55)#3,250 |
| 77. | 56385 | 15.3% | 5.2%(+10.1)#77 | 5.8%(+9.50)#3,275 |
| 78. | 56641 | 15.3% | 5.2%(+10.1)#78 | 5.8%(+9.44)#3,302 |
| 79. | 55314 | 15.1% | 5.2%(+9.91)#79 | 5.8%(+9.29)#3,366 |
| 80. | 56686 | 15.1% | 5.2%(+9.88)#80 | 5.8%(+9.26)#3,380 |
| 81. | 56025 | 15.1% | 5.2%(+9.88)#81 | 5.8%(+9.26)#3,381 |
| 82. | 55925 | 15.0% | 5.2%(+9.83)#82 | 5.8%(+9.22)#3,407 |
| 83. | 56339 | 15.0% | 5.2%(+9.83)#83 | 5.8%(+9.21)#3,410 |
| 84. | 56309 | 15.0% | 5.2%(+9.82)#84 | 5.8%(+9.20)#3,418 |
| 85. | 56019 | 14.9% | 5.2%(+9.68)#85 | 5.8%(+9.06)#3,481 |
| 86. | 56646 | 14.9% | 5.2%(+9.67)#86 | 5.8%(+9.05)#3,486 |
| 87. | 56137 | 14.8% | 5.2%(+9.64)#87 | 5.8%(+9.02)#3,501 |
| 88. | 55922 | 14.8% | 5.2%(+9.63)#88 | 5.8%(+9.01)#3,507 |
| 89. | 55924 | 14.7% | 5.2%(+9.54)#89 | 5.8%(+8.92)#3,553 |
| 90. | 55335 | 14.7% | 5.2%(+9.51)#90 | 5.8%(+8.89)#3,568 |
| 91. | 55752 | 14.6% | 5.2%(+9.45)#91 | 5.8%(+8.83)#3,593 |
| 92. | 56517 | 14.6% | 5.2%(+9.42)#92 | 5.8%(+8.80)#3,604 |
| 93. | 56311 | 14.5% | 5.2%(+9.32)#93 | 5.8%(+8.70)#3,646 |
| 94. | 56129 | 14.5% | 5.2%(+9.27)#94 | 5.8%(+8.65)#3,669 |
| 95. | 56116 | 14.4% | 5.2%(+9.19)#95 | 5.8%(+8.57)#3,708 |
| 96. | 56266 | 14.4% | 5.2%(+9.18)#96 | 5.8%(+8.56)#3,709 |
| 97. | 56579 | 14.3% | 5.2%(+9.11)#97 | 5.8%(+8.50)#3,726 |
| 98. | 56688 | 14.3% | 5.2%(+9.09)#98 | 5.8%(+8.47)#3,756 |
| 99. | 56654 | 14.3% | 5.2%(+9.09)#99 | 5.8%(+8.47)#3,760 |
| 100. | 56293 | 14.3% | 5.2%(+9.06)#100 | 5.8%(+8.44)#3,769 |
Common Questions
What are the Top 10 Zip Codes with the Highest Percentage of Self-Employed / Not Incorporated in Minnesota?
Top 10 Zip Codes with the Highest Percentage of Self-Employed / Not Incorporated in Minnesota are:
What zip code has the Highest Percentage of Self-Employed / Not Incorporated in Minnesota?
56541 has the Highest Percentage of Self-Employed / Not Incorporated in Minnesota with 55.6%.
What is the Percentage of Self-Employed / Not Incorporated in the State of Minnesota?
Percentage of Self-Employed / Not Incorporated in Minnesota is 5.2%.
What is the Percentage of Self-Employed / Not Incorporated in the United States?
Percentage of Self-Employed / Not Incorporated in the United States is 5.8%.