Zip Codes with the Highest Percentage of Self-Employed / Not Incorporated in Kansas
RELATED REPORTS & OPTIONS
Self-Employed / Not Incorporated
Kansas
Compare Zip Codes
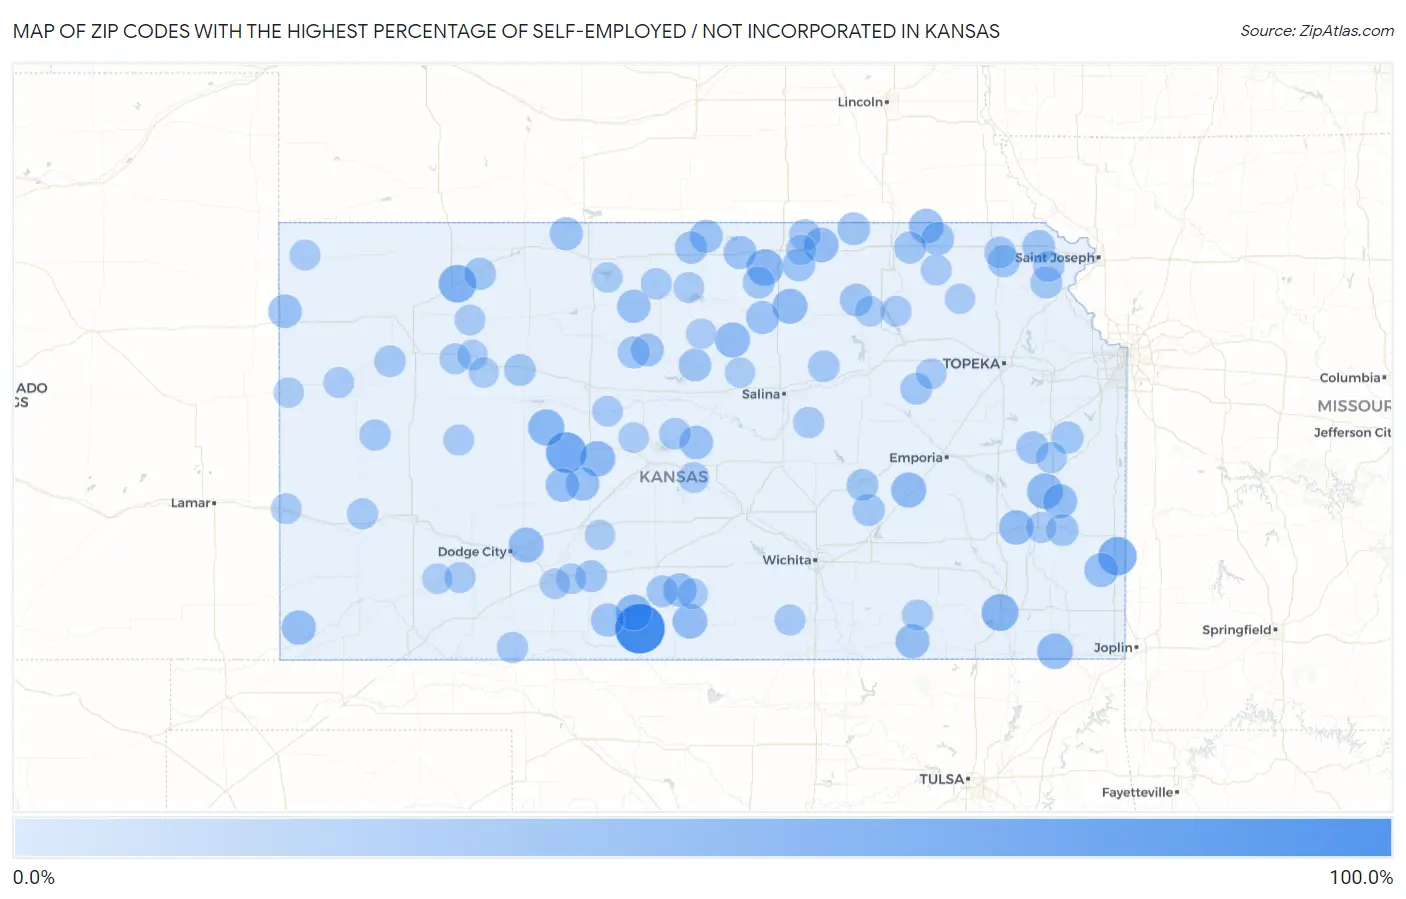
Map of Zip Codes with the Highest Percentage of Self-Employed / Not Incorporated in Kansas
0.0%
100.0%
Zip Codes with the Highest Percentage of Self-Employed / Not Incorporated in Kansas
| Zip Code | % Self-Employed / Not Incorporated | vs State | vs National | |
| 1. | 67071 | 100.0% | 5.9%(+94.1)#1 | 5.8%(+94.2)#8 |
| 2. | 67513 | 61.3% | 5.9%(+55.4)#2 | 5.8%(+55.5)#134 |
| 3. | 66741 | 52.2% | 5.9%(+46.3)#3 | 5.8%(+46.4)#192 |
| 4. | 67635 | 48.9% | 5.9%(+43.0)#4 | 5.8%(+43.1)#243 |
| 5. | 67363 | 46.0% | 5.9%(+40.1)#5 | 5.8%(+40.2)#285 |
| 6. | 66961 | 44.4% | 5.9%(+38.5)#6 | 5.8%(+38.6)#312 |
| 7. | 67521 | 43.2% | 5.9%(+37.3)#7 | 5.8%(+37.4)#333 |
| 8. | 67143 | 42.1% | 5.9%(+36.2)#8 | 5.8%(+36.3)#361 |
| 9. | 66091 | 40.9% | 5.9%(+35.0)#9 | 5.8%(+35.1)#389 |
| 10. | 67332 | 40.3% | 5.9%(+34.4)#10 | 5.8%(+34.5)#400 |
| 11. | 67575 | 39.5% | 5.9%(+33.6)#11 | 5.8%(+33.7)#420 |
| 12. | 66862 | 38.2% | 5.9%(+32.3)#12 | 5.8%(+32.4)#453 |
| 13. | 67418 | 38.2% | 5.9%(+32.3)#13 | 5.8%(+32.3)#454 |
| 14. | 67882 | 37.6% | 5.9%(+31.7)#14 | 5.8%(+31.8)#469 |
| 15. | 67417 | 37.3% | 5.9%(+31.4)#15 | 5.8%(+31.5)#480 |
| 16. | 66944 | 36.5% | 5.9%(+30.6)#16 | 5.8%(+30.7)#506 |
| 17. | 67138 | 36.4% | 5.9%(+30.5)#17 | 5.8%(+30.6)#512 |
| 18. | 66541 | 36.0% | 5.9%(+30.1)#18 | 5.8%(+30.2)#529 |
| 19. | 66761 | 35.7% | 5.9%(+29.8)#19 | 5.8%(+29.9)#537 |
| 20. | 67953 | 34.9% | 5.9%(+29.0)#20 | 5.8%(+29.1)#559 |
| 21. | 67024 | 34.3% | 5.9%(+28.4)#21 | 5.8%(+28.5)#571 |
| 22. | 66039 | 34.3% | 5.9%(+28.4)#22 | 5.8%(+28.5)#573 |
| 23. | 66734 | 33.6% | 5.9%(+27.7)#23 | 5.8%(+27.8)#592 |
| 24. | 67574 | 32.3% | 5.9%(+26.4)#24 | 5.8%(+26.4)#662 |
| 25. | 67523 | 32.2% | 5.9%(+26.3)#25 | 5.8%(+26.3)#667 |
| 26. | 67741 | 32.0% | 5.9%(+26.1)#26 | 5.8%(+26.2)#675 |
| 27. | 67427 | 31.7% | 5.9%(+25.8)#27 | 5.8%(+25.9)#682 |
| 28. | 67065 | 31.7% | 5.9%(+25.8)#28 | 5.8%(+25.9)#683 |
| 29. | 67623 | 30.8% | 5.9%(+24.9)#29 | 5.8%(+25.0)#729 |
| 30. | 67155 | 30.6% | 5.9%(+24.7)#30 | 5.8%(+24.8)#741 |
| 31. | 66942 | 30.0% | 5.9%(+24.1)#31 | 5.8%(+24.2)#767 |
| 32. | 67647 | 29.9% | 5.9%(+24.0)#32 | 5.8%(+24.1)#776 |
| 33. | 66936 | 29.8% | 5.9%(+23.9)#33 | 5.8%(+24.0)#781 |
| 34. | 66403 | 29.8% | 5.9%(+23.9)#34 | 5.8%(+24.0)#782 |
| 35. | 67445 | 29.5% | 5.9%(+23.6)#35 | 5.8%(+23.7)#799 |
| 36. | 67673 | 28.6% | 5.9%(+22.7)#36 | 5.8%(+22.8)#857 |
| 37. | 66946 | 28.3% | 5.9%(+22.4)#37 | 5.8%(+22.4)#875 |
| 38. | 67481 | 28.2% | 5.9%(+22.3)#38 | 5.8%(+22.4)#876 |
| 39. | 67447 | 28.2% | 5.9%(+22.3)#39 | 5.8%(+22.4)#877 |
| 40. | 66532 | 27.8% | 5.9%(+21.9)#40 | 5.8%(+22.0)#905 |
| 41. | 66941 | 27.6% | 5.9%(+21.7)#41 | 5.8%(+21.8)#917 |
| 42. | 66930 | 27.5% | 5.9%(+21.6)#42 | 5.8%(+21.7)#920 |
| 43. | 66095 | 27.3% | 5.9%(+21.4)#43 | 5.8%(+21.5)#940 |
| 44. | 66755 | 26.0% | 5.9%(+20.1)#44 | 5.8%(+20.1)#1,044 |
| 45. | 66079 | 25.9% | 5.9%(+20.0)#45 | 5.8%(+20.1)#1,046 |
| 46. | 66438 | 25.9% | 5.9%(+20.0)#46 | 5.8%(+20.1)#1,051 |
| 47. | 67658 | 25.8% | 5.9%(+19.9)#47 | 5.8%(+19.9)#1,073 |
| 48. | 66527 | 25.6% | 5.9%(+19.7)#48 | 5.8%(+19.8)#1,084 |
| 49. | 66840 | 25.6% | 5.9%(+19.7)#49 | 5.8%(+19.8)#1,089 |
| 50. | 67643 | 25.4% | 5.9%(+19.5)#50 | 5.8%(+19.5)#1,118 |
| 51. | 66948 | 25.0% | 5.9%(+19.1)#51 | 5.8%(+19.2)#1,142 |
| 52. | 66041 | 24.9% | 5.9%(+19.0)#52 | 5.8%(+19.1)#1,160 |
| 53. | 66834 | 24.5% | 5.9%(+18.6)#53 | 5.8%(+18.7)#1,210 |
| 54. | 67054 | 24.5% | 5.9%(+18.6)#54 | 5.8%(+18.7)#1,213 |
| 55. | 67134 | 24.5% | 5.9%(+18.6)#55 | 5.8%(+18.6)#1,214 |
| 56. | 66851 | 24.4% | 5.9%(+18.5)#56 | 5.8%(+18.6)#1,224 |
| 57. | 67672 | 24.2% | 5.9%(+18.3)#57 | 5.8%(+18.4)#1,235 |
| 58. | 67482 | 24.1% | 5.9%(+18.2)#58 | 5.8%(+18.3)#1,238 |
| 59. | 67525 | 24.0% | 5.9%(+18.1)#59 | 5.8%(+18.1)#1,258 |
| 60. | 66425 | 23.9% | 5.9%(+18.0)#60 | 5.8%(+18.1)#1,261 |
| 61. | 66960 | 23.8% | 5.9%(+17.9)#61 | 5.8%(+18.0)#1,274 |
| 62. | 67747 | 23.7% | 5.9%(+17.8)#62 | 5.8%(+17.9)#1,281 |
| 63. | 66017 | 22.9% | 5.9%(+17.0)#63 | 5.8%(+17.1)#1,363 |
| 64. | 67863 | 22.7% | 5.9%(+16.8)#64 | 5.8%(+16.9)#1,386 |
| 65. | 67474 | 22.4% | 5.9%(+16.5)#65 | 5.8%(+16.5)#1,430 |
| 66. | 67840 | 22.2% | 5.9%(+16.3)#66 | 5.8%(+16.4)#1,449 |
| 67. | 67448 | 21.9% | 5.9%(+16.0)#67 | 5.8%(+16.1)#1,486 |
| 68. | 67860 | 21.5% | 5.9%(+15.6)#68 | 5.8%(+15.7)#1,557 |
| 69. | 66080 | 21.4% | 5.9%(+15.5)#69 | 5.8%(+15.6)#1,578 |
| 70. | 67346 | 21.2% | 5.9%(+15.3)#70 | 5.8%(+15.4)#1,603 |
| 71. | 67737 | 21.1% | 5.9%(+15.2)#71 | 5.8%(+15.3)#1,620 |
| 72. | 67103 | 21.0% | 5.9%(+15.1)#72 | 5.8%(+15.2)#1,635 |
| 73. | 67867 | 21.0% | 5.9%(+15.1)#73 | 5.8%(+15.1)#1,644 |
| 74. | 66544 | 20.9% | 5.9%(+15.0)#74 | 5.8%(+15.1)#1,656 |
| 75. | 67112 | 20.8% | 5.9%(+14.9)#75 | 5.8%(+15.0)#1,676 |
| 76. | 67839 | 20.7% | 5.9%(+14.8)#76 | 5.8%(+14.9)#1,691 |
| 77. | 67761 | 20.7% | 5.9%(+14.8)#77 | 5.8%(+14.9)#1,695 |
| 78. | 66742 | 20.7% | 5.9%(+14.8)#78 | 5.8%(+14.9)#1,696 |
| 79. | 67756 | 20.6% | 5.9%(+14.7)#79 | 5.8%(+14.8)#1,706 |
| 80. | 67740 | 20.4% | 5.9%(+14.5)#80 | 5.8%(+14.6)#1,747 |
| 81. | 67573 | 20.3% | 5.9%(+14.4)#81 | 5.8%(+14.5)#1,757 |
| 82. | 66520 | 20.1% | 5.9%(+14.2)#82 | 5.8%(+14.3)#1,783 |
| 83. | 66401 | 20.0% | 5.9%(+14.1)#83 | 5.8%(+14.2)#1,801 |
| 84. | 67109 | 20.0% | 5.9%(+14.1)#84 | 5.8%(+14.2)#1,812 |
| 85. | 67836 | 20.0% | 5.9%(+14.1)#85 | 5.8%(+14.2)#1,821 |
| 86. | 67660 | 20.0% | 5.9%(+14.1)#86 | 5.8%(+14.2)#1,829 |
| 87. | 67430 | 19.9% | 5.9%(+14.0)#87 | 5.8%(+14.1)#1,840 |
| 88. | 67834 | 19.7% | 5.9%(+13.8)#88 | 5.8%(+13.8)#1,885 |
| 89. | 67751 | 19.4% | 5.9%(+13.5)#89 | 5.8%(+13.6)#1,930 |
| 90. | 67837 | 19.3% | 5.9%(+13.4)#90 | 5.8%(+13.5)#1,951 |
| 91. | 67564 | 19.2% | 5.9%(+13.3)#91 | 5.8%(+13.4)#1,964 |
| 92. | 66449 | 19.2% | 5.9%(+13.3)#92 | 5.8%(+13.4)#1,976 |
| 93. | 66940 | 19.0% | 5.9%(+13.1)#93 | 5.8%(+13.2)#2,028 |
| 94. | 67552 | 18.9% | 5.9%(+13.0)#94 | 5.8%(+13.1)#2,055 |
| 95. | 67644 | 18.9% | 5.9%(+13.0)#95 | 5.8%(+13.1)#2,056 |
| 96. | 67452 | 18.8% | 5.9%(+12.9)#96 | 5.8%(+13.0)#2,089 |
| 97. | 67752 | 18.6% | 5.9%(+12.7)#97 | 5.8%(+12.8)#2,129 |
| 98. | 66432 | 18.6% | 5.9%(+12.7)#98 | 5.8%(+12.8)#2,152 |
| 99. | 67762 | 18.5% | 5.9%(+12.6)#99 | 5.8%(+12.7)#2,164 |
| 100. | 67423 | 18.5% | 5.9%(+12.6)#100 | 5.8%(+12.7)#2,170 |
Common Questions
What are the Top 10 Zip Codes with the Highest Percentage of Self-Employed / Not Incorporated in Kansas?
Top 10 Zip Codes with the Highest Percentage of Self-Employed / Not Incorporated in Kansas are:
What zip code has the Highest Percentage of Self-Employed / Not Incorporated in Kansas?
67071 has the Highest Percentage of Self-Employed / Not Incorporated in Kansas with 100.0%.
What is the Percentage of Self-Employed / Not Incorporated in the State of Kansas?
Percentage of Self-Employed / Not Incorporated in Kansas is 5.9%.
What is the Percentage of Self-Employed / Not Incorporated in the United States?
Percentage of Self-Employed / Not Incorporated in the United States is 5.8%.