Zip Codes with the Highest Percentage of Self-Employed / Not Incorporated in Connecticut
RELATED REPORTS & OPTIONS
Self-Employed / Not Incorporated
Connecticut
Compare Zip Codes
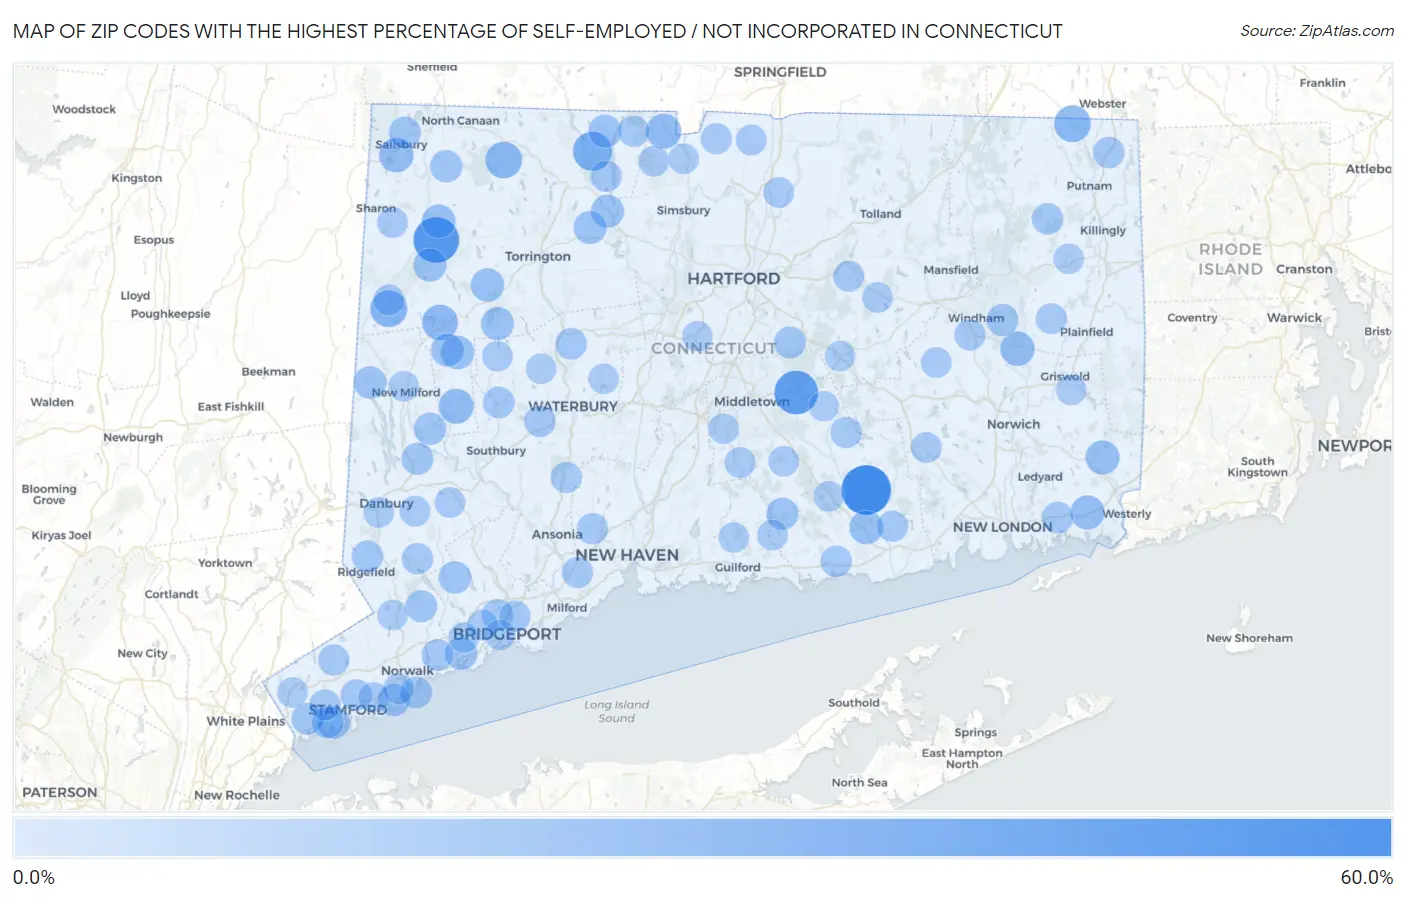
Map of Zip Codes with the Highest Percentage of Self-Employed / Not Incorporated in Connecticut
0.0%
60.0%
Zip Codes with the Highest Percentage of Self-Employed / Not Incorporated in Connecticut
| Zip Code | % Self-Employed / Not Incorporated | vs State | vs National | |
| 1. | 06439 | 52.2% | 6.1%(+46.1)#1 | 5.8%(+46.4)#195 |
| 2. | 06753 | 42.9% | 6.1%(+36.8)#2 | 5.8%(+37.0)#342 |
| 3. | 06414 | 38.3% | 6.1%(+32.2)#3 | 5.8%(+32.5)#452 |
| 4. | 06065 | 27.6% | 6.1%(+21.5)#4 | 5.8%(+21.8)#918 |
| 5. | 06785 | 22.2% | 6.1%(+16.1)#5 | 5.8%(+16.4)#1,453 |
| 6. | 06262 | 22.0% | 6.1%(+16.0)#6 | 5.8%(+16.2)#1,474 |
| 7. | 06058 | 21.7% | 6.1%(+15.7)#7 | 5.8%(+15.9)#1,517 |
| 8. | 06777 | 19.5% | 6.1%(+13.4)#8 | 5.8%(+13.7)#1,917 |
| 9. | 06060 | 18.1% | 6.1%(+12.0)#9 | 5.8%(+12.2)#2,298 |
| 10. | 06783 | 17.8% | 6.1%(+11.7)#10 | 5.8%(+11.9)#2,383 |
| 11. | 06039 | 16.9% | 6.1%(+10.8)#11 | 5.8%(+11.1)#2,659 |
| 12. | 06350 | 16.7% | 6.1%(+10.6)#12 | 5.8%(+10.9)#2,756 |
| 13. | 06378 | 15.9% | 6.1%(+9.87)#13 | 5.8%(+10.1)#3,010 |
| 14. | 06359 | 15.9% | 6.1%(+9.81)#14 | 5.8%(+10.0)#3,038 |
| 15. | 06426 | 15.0% | 6.1%(+8.90)#15 | 5.8%(+9.14)#3,439 |
| 16. | 06796 | 14.9% | 6.1%(+8.79)#16 | 5.8%(+9.04)#3,495 |
| 17. | 06793 | 14.6% | 6.1%(+8.55)#17 | 5.8%(+8.79)#3,606 |
| 18. | 06759 | 14.3% | 6.1%(+8.20)#18 | 5.8%(+8.44)#3,768 |
| 19. | 06754 | 13.7% | 6.1%(+7.66)#19 | 5.8%(+7.90)#4,054 |
| 20. | 06061 | 13.4% | 6.1%(+7.38)#20 | 5.8%(+7.62)#4,227 |
| 21. | 06091 | 13.3% | 6.1%(+7.28)#21 | 5.8%(+7.52)#4,290 |
| 22. | 06057 | 13.3% | 6.1%(+7.25)#22 | 5.8%(+7.49)#4,312 |
| 23. | 06794 | 13.2% | 6.1%(+7.19)#23 | 5.8%(+7.43)#4,353 |
| 24. | 06763 | 13.2% | 6.1%(+7.17)#24 | 5.8%(+7.41)#4,369 |
| 25. | 06870 | 13.0% | 6.1%(+6.98)#25 | 5.8%(+7.22)#4,506 |
| 26. | 06784 | 12.3% | 6.1%(+6.28)#26 | 5.8%(+6.52)#5,011 |
| 27. | 06752 | 12.2% | 6.1%(+6.11)#27 | 5.8%(+6.35)#5,146 |
| 28. | 06612 | 12.1% | 6.1%(+6.01)#28 | 5.8%(+6.25)#5,236 |
| 29. | 06890 | 12.1% | 6.1%(+6.00)#29 | 5.8%(+6.24)#5,241 |
| 30. | 06031 | 12.0% | 6.1%(+5.96)#30 | 5.8%(+6.20)#5,279 |
| 31. | 06853 | 11.5% | 6.1%(+5.47)#31 | 5.8%(+5.71)#5,679 |
| 32. | 06419 | 11.4% | 6.1%(+5.37)#32 | 5.8%(+5.62)#5,781 |
| 33. | 06804 | 11.3% | 6.1%(+5.24)#33 | 5.8%(+5.48)#5,904 |
| 34. | 06068 | 11.1% | 6.1%(+5.00)#34 | 5.8%(+5.24)#6,142 |
| 35. | 06264 | 11.0% | 6.1%(+4.93)#35 | 5.8%(+5.17)#6,222 |
| 36. | 06883 | 10.9% | 6.1%(+4.88)#36 | 5.8%(+5.12)#6,266 |
| 37. | 06830 | 10.9% | 6.1%(+4.79)#37 | 5.8%(+5.04)#6,349 |
| 38. | 06073 | 10.8% | 6.1%(+4.72)#38 | 5.8%(+4.96)#6,449 |
| 39. | 06877 | 10.4% | 6.1%(+4.34)#39 | 5.8%(+4.58)#6,892 |
| 40. | 06782 | 10.3% | 6.1%(+4.24)#40 | 5.8%(+4.48)#7,011 |
| 41. | 06855 | 10.3% | 6.1%(+4.20)#41 | 5.8%(+4.44)#7,047 |
| 42. | 06878 | 10.2% | 6.1%(+4.18)#42 | 5.8%(+4.42)#7,085 |
| 43. | 06798 | 10.2% | 6.1%(+4.10)#43 | 5.8%(+4.34)#7,164 |
| 44. | 06606 | 10.1% | 6.1%(+4.05)#44 | 5.8%(+4.29)#7,226 |
| 45. | 06880 | 10.0% | 6.1%(+3.90)#45 | 5.8%(+4.14)#7,414 |
| 46. | 06355 | 9.9% | 6.1%(+3.80)#46 | 5.8%(+4.04)#7,530 |
| 47. | 06277 | 9.8% | 6.1%(+3.78)#47 | 5.8%(+4.02)#7,578 |
| 48. | 06259 | 9.8% | 6.1%(+3.77)#48 | 5.8%(+4.02)#7,582 |
| 49. | 06906 | 9.8% | 6.1%(+3.71)#49 | 5.8%(+3.95)#7,675 |
| 50. | 06762 | 9.7% | 6.1%(+3.68)#50 | 5.8%(+3.92)#7,716 |
| 51. | 06498 | 9.6% | 6.1%(+3.54)#51 | 5.8%(+3.78)#7,892 |
| 52. | 06896 | 9.6% | 6.1%(+3.54)#52 | 5.8%(+3.78)#7,894 |
| 53. | 06525 | 9.5% | 6.1%(+3.40)#53 | 5.8%(+3.64)#8,074 |
| 54. | 06469 | 9.4% | 6.1%(+3.36)#54 | 5.8%(+3.61)#8,123 |
| 55. | 06063 | 9.4% | 6.1%(+3.33)#55 | 5.8%(+3.57)#8,174 |
| 56. | 06610 | 9.3% | 6.1%(+3.29)#56 | 5.8%(+3.53)#8,241 |
| 57. | 06027 | 9.3% | 6.1%(+3.21)#57 | 5.8%(+3.45)#8,363 |
| 58. | 06807 | 9.2% | 6.1%(+3.19)#58 | 5.8%(+3.43)#8,383 |
| 59. | 06903 | 9.0% | 6.1%(+2.95)#59 | 5.8%(+3.19)#8,768 |
| 60. | 06371 | 9.0% | 6.1%(+2.94)#60 | 5.8%(+3.18)#8,790 |
| 61. | 06477 | 9.0% | 6.1%(+2.91)#61 | 5.8%(+3.15)#8,830 |
| 62. | 06403 | 8.9% | 6.1%(+2.89)#62 | 5.8%(+3.13)#8,864 |
| 63. | 06043 | 8.9% | 6.1%(+2.89)#63 | 5.8%(+3.13)#8,865 |
| 64. | 06093 | 8.9% | 6.1%(+2.80)#64 | 5.8%(+3.04)#9,050 |
| 65. | 06266 | 8.8% | 6.1%(+2.77)#65 | 5.8%(+3.01)#9,111 |
| 66. | 06825 | 8.6% | 6.1%(+2.52)#66 | 5.8%(+2.76)#9,500 |
| 67. | 06854 | 8.6% | 6.1%(+2.52)#67 | 5.8%(+2.76)#9,510 |
| 68. | 06331 | 8.6% | 6.1%(+2.51)#68 | 5.8%(+2.76)#9,514 |
| 69. | 06757 | 8.6% | 6.1%(+2.51)#69 | 5.8%(+2.75)#9,528 |
| 70. | 06422 | 8.5% | 6.1%(+2.43)#70 | 5.8%(+2.67)#9,670 |
| 71. | 06078 | 8.4% | 6.1%(+2.38)#71 | 5.8%(+2.62)#9,779 |
| 72. | 06801 | 8.3% | 6.1%(+2.21)#72 | 5.8%(+2.45)#10,115 |
| 73. | 06090 | 8.2% | 6.1%(+2.14)#73 | 5.8%(+2.38)#10,246 |
| 74. | 06069 | 8.2% | 6.1%(+2.12)#74 | 5.8%(+2.37)#10,282 |
| 75. | 06420 | 8.1% | 6.1%(+2.01)#75 | 5.8%(+2.25)#10,509 |
| 76. | 06443 | 8.0% | 6.1%(+1.92)#76 | 5.8%(+2.17)#10,677 |
| 77. | 06751 | 8.0% | 6.1%(+1.92)#77 | 5.8%(+2.16)#10,690 |
| 78. | 06232 | 8.0% | 6.1%(+1.91)#78 | 5.8%(+2.15)#10,703 |
| 79. | 06470 | 7.9% | 6.1%(+1.89)#79 | 5.8%(+2.13)#10,746 |
| 80. | 06441 | 7.9% | 6.1%(+1.86)#80 | 5.8%(+2.10)#10,800 |
| 81. | 06249 | 7.9% | 6.1%(+1.83)#81 | 5.8%(+2.07)#10,878 |
| 82. | 06088 | 7.8% | 6.1%(+1.78)#82 | 5.8%(+2.02)#10,977 |
| 83. | 06820 | 7.8% | 6.1%(+1.77)#83 | 5.8%(+2.01)#11,006 |
| 84. | 06776 | 7.7% | 6.1%(+1.68)#84 | 5.8%(+1.92)#11,208 |
| 85. | 06897 | 7.7% | 6.1%(+1.64)#85 | 5.8%(+1.88)#11,301 |
| 86. | 06810 | 7.7% | 6.1%(+1.64)#86 | 5.8%(+1.88)#11,305 |
| 87. | 06455 | 7.6% | 6.1%(+1.59)#87 | 5.8%(+1.83)#11,417 |
| 88. | 06831 | 7.6% | 6.1%(+1.57)#88 | 5.8%(+1.81)#11,477 |
| 89. | 06035 | 7.6% | 6.1%(+1.55)#89 | 5.8%(+1.80)#11,507 |
| 90. | 06716 | 7.6% | 6.1%(+1.51)#90 | 5.8%(+1.75)#11,618 |
| 91. | 06234 | 7.6% | 6.1%(+1.50)#91 | 5.8%(+1.75)#11,625 |
| 92. | 06437 | 7.5% | 6.1%(+1.49)#92 | 5.8%(+1.73)#11,660 |
| 93. | 06351 | 7.5% | 6.1%(+1.45)#93 | 5.8%(+1.69)#11,764 |
| 94. | 06424 | 7.5% | 6.1%(+1.41)#94 | 5.8%(+1.65)#11,865 |
| 95. | 06447 | 7.4% | 6.1%(+1.39)#95 | 5.8%(+1.63)#11,902 |
| 96. | 06412 | 7.4% | 6.1%(+1.38)#96 | 5.8%(+1.62)#11,933 |
| 97. | 06824 | 7.4% | 6.1%(+1.35)#97 | 5.8%(+1.59)#12,012 |
| 98. | 06795 | 7.4% | 6.1%(+1.35)#98 | 5.8%(+1.59)#12,038 |
| 99. | 06604 | 7.4% | 6.1%(+1.34)#99 | 5.8%(+1.59)#12,042 |
| 100. | 06051 | 7.4% | 6.1%(+1.31)#100 | 5.8%(+1.55)#12,140 |
Common Questions
What are the Top 10 Zip Codes with the Highest Percentage of Self-Employed / Not Incorporated in Connecticut?
Top 10 Zip Codes with the Highest Percentage of Self-Employed / Not Incorporated in Connecticut are:
What zip code has the Highest Percentage of Self-Employed / Not Incorporated in Connecticut?
06439 has the Highest Percentage of Self-Employed / Not Incorporated in Connecticut with 52.2%.
What is the Percentage of Self-Employed / Not Incorporated in the State of Connecticut?
Percentage of Self-Employed / Not Incorporated in Connecticut is 6.1%.
What is the Percentage of Self-Employed / Not Incorporated in the United States?
Percentage of Self-Employed / Not Incorporated in the United States is 5.8%.