Zip Codes with the Highest Percentage of Self-Employed / Not Incorporated in Rhode Island
RELATED REPORTS & OPTIONS
Self-Employed / Not Incorporated
Rhode Island
Compare Zip Codes
Map of Zip Codes with the Highest Percentage of Self-Employed / Not Incorporated in Rhode Island
0.0%
40.0%
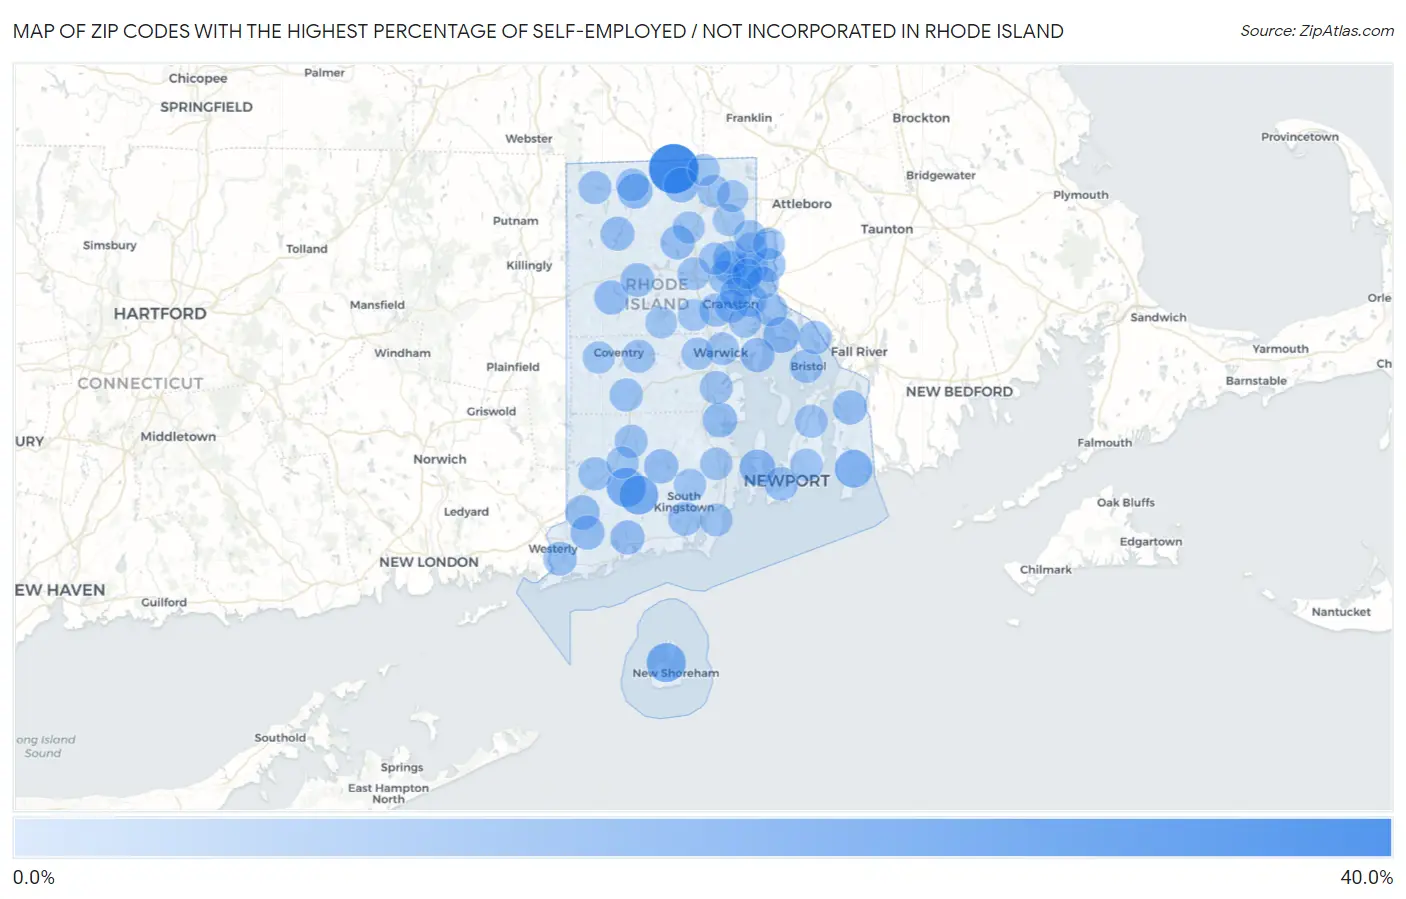
Zip Codes with the Highest Percentage of Self-Employed / Not Incorporated in Rhode Island
| Zip Code | % Self-Employed / Not Incorporated | vs State | vs National | |
| 1. | 02824 | 32.9% | 4.7%(+28.1)#1 | 5.8%(+27.0)#636 |
| 2. | 02807 | 14.8% | 4.7%(+10.1)#2 | 5.8%(+9.00)#3,511 |
| 3. | 02812 | 14.8% | 4.7%(+10.0)#3 | 5.8%(+8.95)#3,536 |
| 4. | 02875 | 14.6% | 4.7%(+9.83)#4 | 5.8%(+8.74)#3,626 |
| 5. | 02837 | 12.4% | 4.7%(+7.71)#5 | 5.8%(+6.63)#4,935 |
| 6. | 02806 | 9.4% | 4.7%(+4.68)#6 | 5.8%(+3.59)#8,146 |
| 7. | 02835 | 9.0% | 4.7%(+4.25)#7 | 5.8%(+3.16)#8,811 |
| 8. | 02896 | 7.7% | 4.7%(+2.96)#8 | 5.8%(+1.88)#11,308 |
| 9. | 02858 | 7.7% | 4.7%(+2.96)#9 | 5.8%(+1.88)#11,326 |
| 10. | 02852 | 7.5% | 4.7%(+2.73)#10 | 5.8%(+1.64)#11,879 |
| 11. | 02804 | 6.8% | 4.7%(+2.12)#11 | 5.8%(+1.03)#13,466 |
| 12. | 02892 | 6.8% | 4.7%(+2.09)#12 | 5.8%(+1.01)#13,522 |
| 13. | 02808 | 6.7% | 4.7%(+1.96)#13 | 5.8%(+0.879)#13,880 |
| 14. | 02813 | 6.5% | 4.7%(+1.75)#14 | 5.8%(+0.666)#14,522 |
| 15. | 02889 | 6.4% | 4.7%(+1.72)#15 | 5.8%(+0.633)#14,629 |
| 16. | 02825 | 6.4% | 4.7%(+1.68)#16 | 5.8%(+0.595)#14,742 |
| 17. | 02878 | 6.4% | 4.7%(+1.68)#17 | 5.8%(+0.593)#14,754 |
| 18. | 02828 | 6.4% | 4.7%(+1.67)#18 | 5.8%(+0.580)#14,800 |
| 19. | 02814 | 6.2% | 4.7%(+1.51)#19 | 5.8%(+0.425)#15,285 |
| 20. | 02879 | 6.0% | 4.7%(+1.30)#20 | 5.8%(+0.214)#15,973 |
| 21. | 02857 | 6.0% | 4.7%(+1.29)#21 | 5.8%(+0.199)#16,033 |
| 22. | 02906 | 5.7% | 4.7%(+0.991)#22 | 5.8%(-0.095)#16,959 |
| 23. | 02891 | 5.7% | 4.7%(+0.961)#23 | 5.8%(-0.125)#17,072 |
| 24. | 02916 | 5.7% | 4.7%(+0.935)#24 | 5.8%(-0.151)#17,168 |
| 25. | 02809 | 5.5% | 4.7%(+0.763)#25 | 5.8%(-0.323)#17,804 |
| 26. | 02840 | 5.5% | 4.7%(+0.753)#26 | 5.8%(-0.333)#17,833 |
| 27. | 02908 | 5.4% | 4.7%(+0.720)#27 | 5.8%(-0.366)#17,949 |
| 28. | 02920 | 5.4% | 4.7%(+0.706)#28 | 5.8%(-0.380)#18,004 |
| 29. | 02905 | 5.4% | 4.7%(+0.627)#29 | 5.8%(-0.459)#18,307 |
| 30. | 02903 | 5.3% | 4.7%(+0.567)#30 | 5.8%(-0.519)#18,533 |
| 31. | 02885 | 5.1% | 4.7%(+0.344)#31 | 5.8%(-0.742)#19,375 |
| 32. | 02909 | 5.1% | 4.7%(+0.327)#32 | 5.8%(-0.759)#19,451 |
| 33. | 02817 | 5.0% | 4.7%(+0.249)#33 | 5.8%(-0.837)#19,752 |
| 34. | 02832 | 4.9% | 4.7%(+0.217)#34 | 5.8%(-0.869)#19,860 |
| 35. | 02859 | 4.9% | 4.7%(+0.194)#35 | 5.8%(-0.892)#19,972 |
| 36. | 02818 | 4.9% | 4.7%(+0.136)#36 | 5.8%(-0.950)#20,163 |
| 37. | 02910 | 4.7% | 4.7%(+0.009)#37 | 5.8%(-1.08)#20,650 |
| 38. | 02816 | 4.7% | 4.7%(+0.008)#38 | 5.8%(-1.08)#20,658 |
| 39. | 02822 | 4.6% | 4.7%(-0.167)#39 | 5.8%(-1.25)#21,310 |
| 40. | 02904 | 4.6% | 4.7%(-0.177)#40 | 5.8%(-1.26)#21,350 |
| 41. | 02830 | 4.4% | 4.7%(-0.353)#41 | 5.8%(-1.44)#22,044 |
| 42. | 02915 | 4.3% | 4.7%(-0.400)#42 | 5.8%(-1.49)#22,206 |
| 43. | 02871 | 4.3% | 4.7%(-0.445)#43 | 5.8%(-1.53)#22,388 |
| 44. | 02886 | 4.2% | 4.7%(-0.563)#44 | 5.8%(-1.65)#22,798 |
| 45. | 02882 | 4.2% | 4.7%(-0.567)#45 | 5.8%(-1.65)#22,835 |
| 46. | 02842 | 4.0% | 4.7%(-0.704)#46 | 5.8%(-1.79)#23,297 |
| 47. | 02919 | 4.0% | 4.7%(-0.719)#47 | 5.8%(-1.80)#23,353 |
| 48. | 02888 | 4.0% | 4.7%(-0.751)#48 | 5.8%(-1.84)#23,462 |
| 49. | 02874 | 3.9% | 4.7%(-0.804)#49 | 5.8%(-1.89)#23,646 |
| 50. | 02838 | 3.8% | 4.7%(-0.897)#50 | 5.8%(-1.98)#23,958 |
| 51. | 02914 | 3.8% | 4.7%(-0.913)#51 | 5.8%(-2.00)#24,013 |
| 52. | 02907 | 3.7% | 4.7%(-0.997)#52 | 5.8%(-2.08)#24,298 |
| 53. | 02881 | 3.6% | 4.7%(-1.13)#53 | 5.8%(-2.21)#24,708 |
| 54. | 02860 | 3.5% | 4.7%(-1.20)#54 | 5.8%(-2.29)#24,919 |
| 55. | 02863 | 3.5% | 4.7%(-1.24)#55 | 5.8%(-2.33)#25,040 |
| 56. | 02911 | 3.4% | 4.7%(-1.30)#56 | 5.8%(-2.38)#25,220 |
| 57. | 02917 | 3.4% | 4.7%(-1.37)#57 | 5.8%(-2.45)#25,416 |
| 58. | 02898 | 3.3% | 4.7%(-1.44)#58 | 5.8%(-2.53)#25,633 |
| 59. | 02893 | 3.3% | 4.7%(-1.44)#59 | 5.8%(-2.53)#25,635 |
| 60. | 02827 | 3.2% | 4.7%(-1.53)#60 | 5.8%(-2.62)#25,879 |
| 61. | 02861 | 3.2% | 4.7%(-1.54)#61 | 5.8%(-2.63)#25,920 |
| 62. | 02895 | 3.1% | 4.7%(-1.67)#62 | 5.8%(-2.76)#26,240 |
| 63. | 02865 | 2.9% | 4.7%(-1.84)#63 | 5.8%(-2.93)#26,633 |
| 64. | 02864 | 2.9% | 4.7%(-1.87)#64 | 5.8%(-2.96)#26,697 |
| 65. | 02921 | 2.8% | 4.7%(-1.90)#65 | 5.8%(-2.99)#26,771 |
| 66. | 02831 | 2.6% | 4.7%(-2.09)#66 | 5.8%(-3.18)#27,161 |
| 67. | 02912 | 0.77% | 4.7%(-3.96)#67 | 5.8%(-5.04)#29,261 |
1
Common Questions
What are the Top 10 Zip Codes with the Highest Percentage of Self-Employed / Not Incorporated in Rhode Island?
Top 10 Zip Codes with the Highest Percentage of Self-Employed / Not Incorporated in Rhode Island are:
What zip code has the Highest Percentage of Self-Employed / Not Incorporated in Rhode Island?
02824 has the Highest Percentage of Self-Employed / Not Incorporated in Rhode Island with 32.9%.
What is the Percentage of Self-Employed / Not Incorporated in the State of Rhode Island?
Percentage of Self-Employed / Not Incorporated in Rhode Island is 4.7%.
What is the Percentage of Self-Employed / Not Incorporated in the United States?
Percentage of Self-Employed / Not Incorporated in the United States is 5.8%.