Zip Codes with the Highest Percentage of Self-Employed / Not Incorporated in Alaska
RELATED REPORTS & OPTIONS
Self-Employed / Not Incorporated
Alaska
Compare Zip Codes
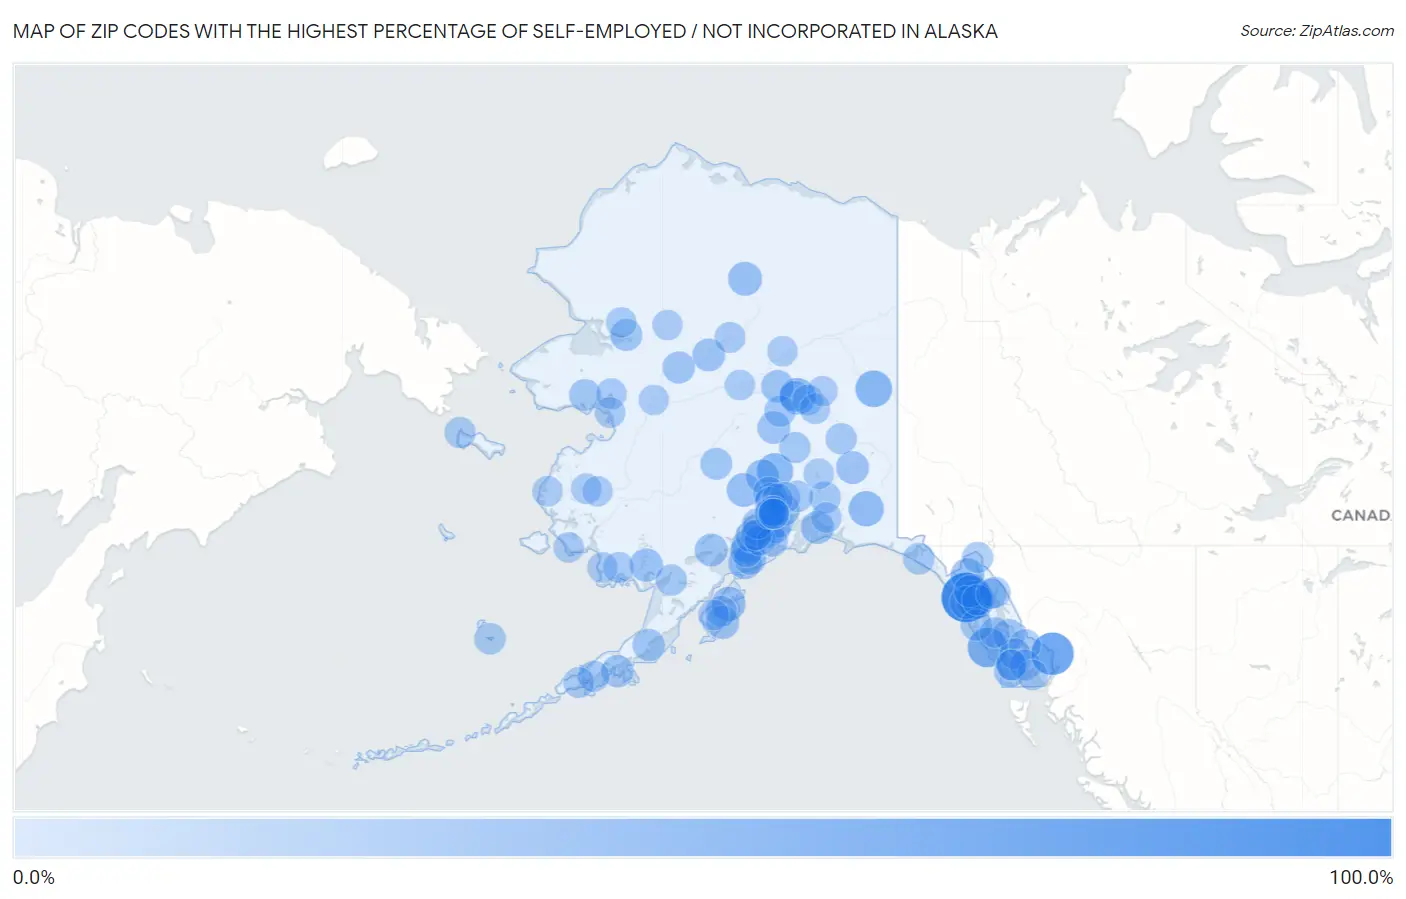
Map of Zip Codes with the Highest Percentage of Self-Employed / Not Incorporated in Alaska
0.0%
100.0%
Zip Codes with the Highest Percentage of Self-Employed / Not Incorporated in Alaska
| Zip Code | % Self-Employed / Not Incorporated | vs State | vs National | |
| 1. | 99825 | 100.0% | 6.0%(+94.0)#1 | 5.8%(+94.2)#40 |
| 2. | 99923 | 64.0% | 6.0%(+58.0)#2 | 5.8%(+58.2)#121 |
| 3. | 99836 | 50.0% | 6.0%(+44.0)#3 | 5.8%(+44.2)#226 |
| 4. | 99841 | 42.9% | 6.0%(+36.9)#4 | 5.8%(+37.0)#338 |
| 5. | 99738 | 35.3% | 6.0%(+29.3)#5 | 5.8%(+29.5)#553 |
| 6. | 99725 | 33.6% | 6.0%(+27.6)#6 | 5.8%(+27.8)#593 |
| 7. | 99676 | 33.2% | 6.0%(+27.2)#7 | 5.8%(+27.4)#623 |
| 8. | 99566 | 28.6% | 6.0%(+22.6)#8 | 5.8%(+22.8)#859 |
| 9. | 99639 | 22.7% | 6.0%(+16.7)#9 | 5.8%(+16.9)#1,390 |
| 10. | 99721 | 22.2% | 6.0%(+16.2)#10 | 5.8%(+16.4)#1,442 |
| 11. | 99550 | 22.0% | 6.0%(+16.1)#11 | 5.8%(+16.2)#1,473 |
| 12. | 99667 | 21.8% | 6.0%(+15.8)#12 | 5.8%(+16.0)#1,507 |
| 13. | 99683 | 20.7% | 6.0%(+14.7)#13 | 5.8%(+14.9)#1,690 |
| 14. | 99827 | 20.5% | 6.0%(+14.5)#14 | 5.8%(+14.7)#1,729 |
| 15. | 99663 | 19.5% | 6.0%(+13.5)#15 | 5.8%(+13.7)#1,913 |
| 16. | 99832 | 19.2% | 6.0%(+13.2)#16 | 5.8%(+13.4)#1,967 |
| 17. | 99572 | 18.9% | 6.0%(+12.9)#17 | 5.8%(+13.1)#2,067 |
| 18. | 99555 | 18.8% | 6.0%(+12.8)#18 | 5.8%(+12.9)#2,101 |
| 19. | 99643 | 18.5% | 6.0%(+12.5)#19 | 5.8%(+12.7)#2,166 |
| 20. | 99574 | 17.6% | 6.0%(+11.6)#20 | 5.8%(+11.8)#2,442 |
| 21. | 99586 | 16.9% | 6.0%(+10.9)#21 | 5.8%(+11.1)#2,656 |
| 22. | 99745 | 16.7% | 6.0%(+10.7)#22 | 5.8%(+10.9)#2,761 |
| 23. | 99647 | 16.7% | 6.0%(+10.7)#23 | 5.8%(+10.9)#2,762 |
| 24. | 99743 | 15.6% | 6.0%(+9.61)#24 | 5.8%(+9.78)#3,162 |
| 25. | 99758 | 15.4% | 6.0%(+9.40)#25 | 5.8%(+9.57)#3,242 |
| 26. | 99605 | 14.5% | 6.0%(+8.53)#26 | 5.8%(+8.70)#3,647 |
| 27. | 99661 | 14.4% | 6.0%(+8.44)#27 | 5.8%(+8.61)#3,690 |
| 28. | 99565 | 14.3% | 6.0%(+8.30)#28 | 5.8%(+8.47)#3,761 |
| 29. | 99746 | 14.0% | 6.0%(+8.05)#29 | 5.8%(+8.22)#3,882 |
| 30. | 99826 | 14.0% | 6.0%(+7.97)#30 | 5.8%(+8.14)#3,921 |
| 31. | 99603 | 13.1% | 6.0%(+7.07)#31 | 5.8%(+7.24)#4,481 |
| 32. | 99922 | 12.8% | 6.0%(+6.80)#32 | 5.8%(+6.97)#4,671 |
| 33. | 99770 | 12.7% | 6.0%(+6.68)#33 | 5.8%(+6.84)#4,757 |
| 34. | 99556 | 12.6% | 6.0%(+6.67)#34 | 5.8%(+6.83)#4,762 |
| 35. | 99833 | 12.4% | 6.0%(+6.41)#35 | 5.8%(+6.58)#4,975 |
| 36. | 99739 | 12.1% | 6.0%(+6.09)#36 | 5.8%(+6.25)#5,233 |
| 37. | 99691 | 11.9% | 6.0%(+5.92)#37 | 5.8%(+6.09)#5,355 |
| 38. | 99694 | 11.7% | 6.0%(+5.75)#38 | 5.8%(+5.92)#5,505 |
| 39. | 99573 | 11.5% | 6.0%(+5.53)#39 | 5.8%(+5.70)#5,685 |
| 40. | 99610 | 11.2% | 6.0%(+5.18)#40 | 5.8%(+5.35)#6,041 |
| 41. | 99929 | 11.0% | 6.0%(+5.05)#41 | 5.8%(+5.21)#6,182 |
| 42. | 99689 | 11.0% | 6.0%(+5.03)#42 | 5.8%(+5.19)#6,206 |
| 43. | 99591 | 10.7% | 6.0%(+4.73)#43 | 5.8%(+4.90)#6,527 |
| 44. | 99631 | 10.7% | 6.0%(+4.71)#44 | 5.8%(+4.88)#6,548 |
| 45. | 99835 | 10.7% | 6.0%(+4.70)#45 | 5.8%(+4.87)#6,567 |
| 46. | 99688 | 10.6% | 6.0%(+4.57)#46 | 5.8%(+4.74)#6,710 |
| 47. | 99760 | 10.4% | 6.0%(+4.45)#47 | 5.8%(+4.62)#6,849 |
| 48. | 99567 | 10.4% | 6.0%(+4.44)#48 | 5.8%(+4.61)#6,861 |
| 49. | 99921 | 10.3% | 6.0%(+4.32)#49 | 5.8%(+4.48)#7,006 |
| 50. | 99674 | 9.4% | 6.0%(+3.45)#50 | 5.8%(+3.61)#8,111 |
| 51. | 99729 | 9.4% | 6.0%(+3.39)#51 | 5.8%(+3.56)#8,201 |
| 52. | 99633 | 9.3% | 6.0%(+3.33)#52 | 5.8%(+3.50)#8,284 |
| 53. | 99742 | 9.0% | 6.0%(+3.04)#53 | 5.8%(+3.20)#8,747 |
| 54. | 99672 | 8.8% | 6.0%(+2.85)#54 | 5.8%(+3.02)#9,090 |
| 55. | 99737 | 8.6% | 6.0%(+2.63)#55 | 5.8%(+2.80)#9,440 |
| 56. | 99840 | 8.5% | 6.0%(+2.49)#56 | 5.8%(+2.66)#9,701 |
| 57. | 99612 | 8.4% | 6.0%(+2.43)#57 | 5.8%(+2.60)#9,814 |
| 58. | 99801 | 8.2% | 6.0%(+2.18)#58 | 5.8%(+2.35)#10,314 |
| 59. | 99623 | 8.2% | 6.0%(+2.17)#59 | 5.8%(+2.34)#10,338 |
| 60. | 99829 | 8.0% | 6.0%(+2.06)#60 | 5.8%(+2.22)#10,561 |
| 61. | 99678 | 7.7% | 6.0%(+1.75)#61 | 5.8%(+1.92)#11,214 |
| 62. | 99568 | 7.7% | 6.0%(+1.71)#62 | 5.8%(+1.88)#11,323 |
| 63. | 99709 | 7.6% | 6.0%(+1.57)#63 | 5.8%(+1.74)#11,636 |
| 64. | 99583 | 7.5% | 6.0%(+1.57)#64 | 5.8%(+1.73)#11,669 |
| 65. | 99720 | 7.5% | 6.0%(+1.55)#65 | 5.8%(+1.71)#11,716 |
| 66. | 99645 | 7.5% | 6.0%(+1.52)#66 | 5.8%(+1.69)#11,766 |
| 67. | 99918 | 7.5% | 6.0%(+1.52)#67 | 5.8%(+1.68)#11,782 |
| 68. | 99615 | 7.4% | 6.0%(+1.44)#68 | 5.8%(+1.60)#11,989 |
| 69. | 99705 | 7.4% | 6.0%(+1.39)#69 | 5.8%(+1.56)#12,126 |
| 70. | 99753 | 7.4% | 6.0%(+1.37)#70 | 5.8%(+1.54)#12,173 |
| 71. | 99901 | 7.2% | 6.0%(+1.23)#71 | 5.8%(+1.39)#12,492 |
| 72. | 99654 | 7.1% | 6.0%(+1.11)#72 | 5.8%(+1.28)#12,767 |
| 73. | 99664 | 6.9% | 6.0%(+0.931)#73 | 5.8%(+1.10)#13,286 |
| 74. | 99926 | 6.9% | 6.0%(+0.880)#74 | 5.8%(+1.05)#13,425 |
| 75. | 99589 | 6.5% | 6.0%(+0.541)#75 | 5.8%(+0.706)#14,404 |
| 76. | 99925 | 6.5% | 6.0%(+0.525)#76 | 5.8%(+0.690)#14,452 |
| 77. | 99624 | 6.5% | 6.0%(+0.470)#77 | 5.8%(+0.636)#14,625 |
| 78. | 99771 | 6.2% | 6.0%(+0.269)#78 | 5.8%(+0.434)#15,256 |
| 79. | 99830 | 6.2% | 6.0%(+0.199)#79 | 5.8%(+0.364)#15,480 |
| 80. | 99611 | 6.2% | 6.0%(+0.195)#80 | 5.8%(+0.361)#15,492 |
| 81. | 99508 | 6.1% | 6.0%(+0.146)#81 | 5.8%(+0.312)#15,652 |
| 82. | 99588 | 6.1% | 6.0%(+0.116)#82 | 5.8%(+0.282)#15,739 |
| 83. | 99669 | 6.1% | 6.0%(+0.113)#83 | 5.8%(+0.278)#15,750 |
| 84. | 99686 | 6.0% | 6.0%(+0.041)#84 | 5.8%(+0.207)#15,999 |
| 85. | 99515 | 6.0% | 6.0%(+0.035)#85 | 5.8%(+0.200)#16,029 |
| 86. | 99614 | 6.0% | 6.0%(-0.011)#86 | 5.8%(+0.155)#16,175 |
| 87. | 99650 | 5.9% | 6.0%(-0.099)#87 | 5.8%(+0.067)#16,433 |
| 88. | 99504 | 5.9% | 6.0%(-0.102)#88 | 5.8%(+0.064)#16,456 |
| 89. | 99507 | 5.8% | 6.0%(-0.137)#89 | 5.8%(+0.028)#16,568 |
| 90. | 99662 | 5.8% | 6.0%(-0.196)#90 | 5.8%(-0.030)#16,751 |
| 91. | 99516 | 5.7% | 6.0%(-0.289)#91 | 5.8%(-0.123)#17,070 |
| 92. | 99749 | 5.5% | 6.0%(-0.487)#92 | 5.8%(-0.321)#17,800 |
| 93. | 99777 | 5.4% | 6.0%(-0.546)#93 | 5.8%(-0.381)#18,010 |
| 94. | 99585 | 5.4% | 6.0%(-0.624)#94 | 5.8%(-0.458)#18,303 |
| 95. | 99773 | 5.3% | 6.0%(-0.718)#95 | 5.8%(-0.552)#18,658 |
| 96. | 99824 | 5.3% | 6.0%(-0.727)#96 | 5.8%(-0.561)#18,701 |
| 97. | 99714 | 5.1% | 6.0%(-0.853)#97 | 5.8%(-0.687)#19,188 |
| 98. | 99765 | 5.1% | 6.0%(-0.853)#98 | 5.8%(-0.687)#19,190 |
| 99. | 99712 | 5.0% | 6.0%(-0.946)#99 | 5.8%(-0.780)#19,532 |
| 100. | 99701 | 4.9% | 6.0%(-1.05)#100 | 5.8%(-0.887)#19,946 |
Common Questions
What are the Top 10 Zip Codes with the Highest Percentage of Self-Employed / Not Incorporated in Alaska?
Top 10 Zip Codes with the Highest Percentage of Self-Employed / Not Incorporated in Alaska are:
What zip code has the Highest Percentage of Self-Employed / Not Incorporated in Alaska?
99825 has the Highest Percentage of Self-Employed / Not Incorporated in Alaska with 100.0%.
What is the Percentage of Self-Employed / Not Incorporated in the State of Alaska?
Percentage of Self-Employed / Not Incorporated in Alaska is 6.0%.
What is the Percentage of Self-Employed / Not Incorporated in the United States?
Percentage of Self-Employed / Not Incorporated in the United States is 5.8%.