Zip Codes with the Highest Percentage of Self-Employed / Not Incorporated in Georgia
RELATED REPORTS & OPTIONS
Self-Employed / Not Incorporated
Georgia
Compare Zip Codes
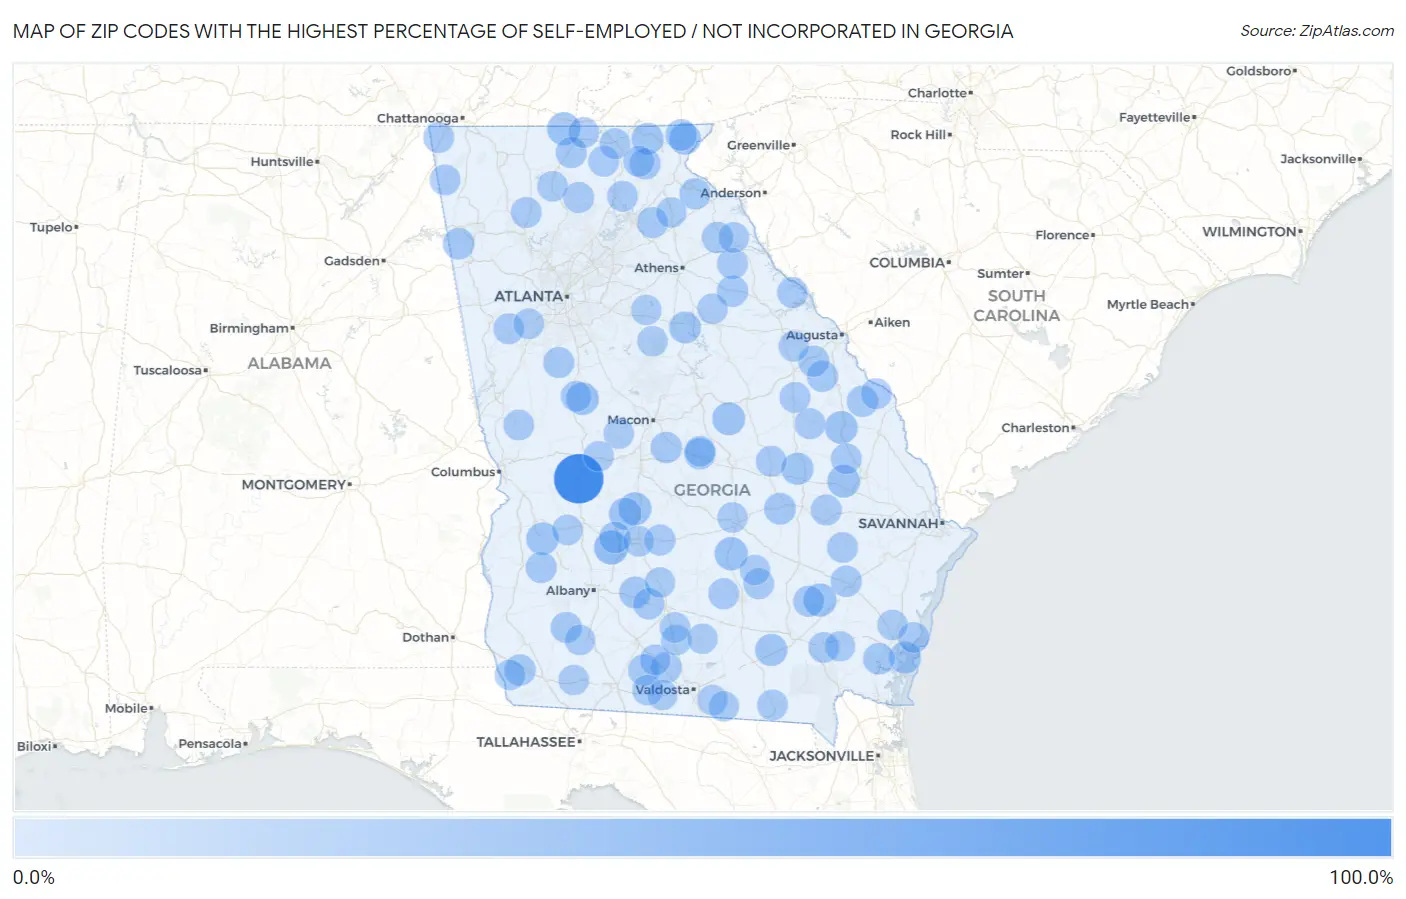
Map of Zip Codes with the Highest Percentage of Self-Employed / Not Incorporated in Georgia
0.0%
100.0%
Zip Codes with the Highest Percentage of Self-Employed / Not Incorporated in Georgia
| Zip Code | % Self-Employed / Not Incorporated | vs State | vs National | |
| 1. | 31081 | 100.0% | 5.4%(+94.6)#1 | 5.8%(+94.2)#30 |
| 2. | 31743 | 26.4% | 5.4%(+21.1)#2 | 5.8%(+20.6)#1,006 |
| 3. | 31544 | 22.4% | 5.4%(+17.1)#3 | 5.8%(+16.6)#1,422 |
| 4. | 30555 | 21.7% | 5.4%(+16.3)#4 | 5.8%(+15.9)#1,533 |
| 5. | 31518 | 21.6% | 5.4%(+16.3)#5 | 5.8%(+15.8)#1,536 |
| 6. | 31067 | 20.8% | 5.4%(+15.4)#6 | 5.8%(+14.9)#1,684 |
| 7. | 31070 | 20.5% | 5.4%(+15.1)#7 | 5.8%(+14.7)#1,726 |
| 8. | 30451 | 20.0% | 5.4%(+14.6)#8 | 5.8%(+14.2)#1,832 |
| 9. | 30442 | 19.6% | 5.4%(+14.2)#9 | 5.8%(+13.8)#1,901 |
| 10. | 30285 | 19.2% | 5.4%(+13.8)#10 | 5.8%(+13.4)#1,975 |
| 11. | 31832 | 19.0% | 5.4%(+13.7)#11 | 5.8%(+13.2)#2,023 |
| 12. | 31051 | 17.2% | 5.4%(+11.9)#12 | 5.8%(+11.4)#2,561 |
| 13. | 31550 | 17.2% | 5.4%(+11.8)#13 | 5.8%(+11.4)#2,577 |
| 14. | 30448 | 16.7% | 5.4%(+11.3)#14 | 5.8%(+10.9)#2,763 |
| 15. | 31527 | 16.5% | 5.4%(+11.1)#15 | 5.8%(+10.6)#2,821 |
| 16. | 30546 | 15.9% | 5.4%(+10.5)#16 | 5.8%(+10.0)#3,042 |
| 17. | 30525 | 15.7% | 5.4%(+10.3)#17 | 5.8%(+9.88)#3,124 |
| 18. | 30625 | 15.6% | 5.4%(+10.2)#18 | 5.8%(+9.74)#3,181 |
| 19. | 30410 | 15.3% | 5.4%(+9.96)#19 | 5.8%(+9.50)#3,271 |
| 20. | 31781 | 15.2% | 5.4%(+9.85)#20 | 5.8%(+9.39)#3,324 |
| 21. | 30562 | 14.6% | 5.4%(+9.25)#21 | 5.8%(+8.79)#3,609 |
| 22. | 30124 | 14.5% | 5.4%(+9.16)#22 | 5.8%(+8.70)#3,644 |
| 23. | 31735 | 14.3% | 5.4%(+8.93)#23 | 5.8%(+8.47)#3,737 |
| 24. | 31565 | 13.9% | 5.4%(+8.59)#24 | 5.8%(+8.13)#3,929 |
| 25. | 31778 | 13.6% | 5.4%(+8.29)#25 | 5.8%(+7.83)#4,099 |
| 26. | 31003 | 13.6% | 5.4%(+8.28)#26 | 5.8%(+7.82)#4,113 |
| 27. | 30456 | 13.6% | 5.4%(+8.24)#27 | 5.8%(+7.78)#4,133 |
| 28. | 31545 | 13.6% | 5.4%(+8.21)#28 | 5.8%(+7.75)#4,145 |
| 29. | 30571 | 13.5% | 5.4%(+8.18)#29 | 5.8%(+7.72)#4,164 |
| 30. | 30660 | 13.4% | 5.4%(+8.09)#30 | 5.8%(+7.63)#4,218 |
| 31. | 31795 | 13.4% | 5.4%(+8.09)#31 | 5.8%(+7.62)#4,223 |
| 32. | 30816 | 13.4% | 5.4%(+8.02)#32 | 5.8%(+7.56)#4,262 |
| 33. | 39859 | 13.1% | 5.4%(+7.70)#33 | 5.8%(+7.24)#4,479 |
| 34. | 30805 | 12.9% | 5.4%(+7.55)#34 | 5.8%(+7.09)#4,577 |
| 35. | 31020 | 12.9% | 5.4%(+7.50)#35 | 5.8%(+7.04)#4,615 |
| 36. | 30624 | 12.9% | 5.4%(+7.50)#36 | 5.8%(+7.04)#4,625 |
| 37. | 39886 | 12.4% | 5.4%(+7.09)#37 | 5.8%(+6.63)#4,937 |
| 38. | 30543 | 12.4% | 5.4%(+7.05)#38 | 5.8%(+6.59)#4,969 |
| 39. | 30538 | 12.4% | 5.4%(+7.04)#39 | 5.8%(+6.58)#4,971 |
| 40. | 31551 | 12.3% | 5.4%(+6.90)#40 | 5.8%(+6.44)#5,072 |
| 41. | 30513 | 12.2% | 5.4%(+6.88)#41 | 5.8%(+6.42)#5,085 |
| 42. | 30205 | 12.2% | 5.4%(+6.81)#42 | 5.8%(+6.35)#5,150 |
| 43. | 39870 | 12.1% | 5.4%(+6.75)#43 | 5.8%(+6.29)#5,196 |
| 44. | 30572 | 11.9% | 5.4%(+6.50)#44 | 5.8%(+6.04)#5,395 |
| 45. | 30148 | 11.8% | 5.4%(+6.49)#45 | 5.8%(+6.02)#5,407 |
| 46. | 31512 | 11.8% | 5.4%(+6.43)#46 | 5.8%(+5.96)#5,469 |
| 47. | 30421 | 11.7% | 5.4%(+6.40)#47 | 5.8%(+5.93)#5,496 |
| 48. | 31072 | 11.7% | 5.4%(+6.37)#48 | 5.8%(+5.91)#5,514 |
| 49. | 31625 | 11.5% | 5.4%(+6.14)#49 | 5.8%(+5.68)#5,713 |
| 50. | 31002 | 11.5% | 5.4%(+6.14)#50 | 5.8%(+5.68)#5,714 |
| 51. | 30512 | 11.5% | 5.4%(+6.13)#51 | 5.8%(+5.67)#5,719 |
| 52. | 30441 | 11.5% | 5.4%(+6.10)#52 | 5.8%(+5.64)#5,761 |
| 53. | 31631 | 11.4% | 5.4%(+6.07)#53 | 5.8%(+5.61)#5,784 |
| 54. | 30627 | 11.4% | 5.4%(+6.06)#54 | 5.8%(+5.60)#5,798 |
| 55. | 30434 | 11.4% | 5.4%(+6.02)#55 | 5.8%(+5.56)#5,836 |
| 56. | 30185 | 11.2% | 5.4%(+5.86)#56 | 5.8%(+5.40)#5,990 |
| 57. | 30450 | 11.2% | 5.4%(+5.83)#57 | 5.8%(+5.37)#6,008 |
| 58. | 30426 | 11.2% | 5.4%(+5.82)#58 | 5.8%(+5.36)#6,022 |
| 59. | 30817 | 11.2% | 5.4%(+5.80)#59 | 5.8%(+5.34)#6,047 |
| 60. | 30545 | 11.1% | 5.4%(+5.76)#60 | 5.8%(+5.30)#6,088 |
| 61. | 30171 | 11.1% | 5.4%(+5.74)#61 | 5.8%(+5.28)#6,117 |
| 62. | 31567 | 11.0% | 5.4%(+5.67)#62 | 5.8%(+5.21)#6,177 |
| 63. | 30564 | 11.0% | 5.4%(+5.60)#63 | 5.8%(+5.14)#6,248 |
| 64. | 30752 | 11.0% | 5.4%(+5.60)#64 | 5.8%(+5.14)#6,249 |
| 65. | 30256 | 10.9% | 5.4%(+5.58)#65 | 5.8%(+5.12)#6,278 |
| 66. | 30731 | 10.9% | 5.4%(+5.58)#66 | 5.8%(+5.11)#6,282 |
| 67. | 31722 | 10.8% | 5.4%(+5.49)#67 | 5.8%(+5.03)#6,360 |
| 68. | 30559 | 10.8% | 5.4%(+5.44)#68 | 5.8%(+4.98)#6,432 |
| 69. | 31542 | 10.7% | 5.4%(+5.33)#69 | 5.8%(+4.87)#6,566 |
| 70. | 30634 | 10.6% | 5.4%(+5.25)#70 | 5.8%(+4.79)#6,645 |
| 71. | 31522 | 10.5% | 5.4%(+5.17)#71 | 5.8%(+4.71)#6,734 |
| 72. | 30427 | 10.4% | 5.4%(+5.06)#72 | 5.8%(+4.60)#6,877 |
| 73. | 31823 | 10.4% | 5.4%(+5.05)#73 | 5.8%(+4.59)#6,889 |
| 74. | 30175 | 10.3% | 5.4%(+4.92)#74 | 5.8%(+4.46)#7,035 |
| 75. | 31780 | 10.2% | 5.4%(+4.89)#75 | 5.8%(+4.43)#7,069 |
| 76. | 31017 | 10.2% | 5.4%(+4.81)#76 | 5.8%(+4.35)#7,150 |
| 77. | 31647 | 10.2% | 5.4%(+4.80)#77 | 5.8%(+4.34)#7,167 |
| 78. | 31629 | 10.1% | 5.4%(+4.77)#78 | 5.8%(+4.31)#7,198 |
| 79. | 30268 | 10.1% | 5.4%(+4.71)#79 | 5.8%(+4.25)#7,279 |
| 80. | 30669 | 10.0% | 5.4%(+4.63)#80 | 5.8%(+4.17)#7,385 |
| 81. | 31015 | 10.0% | 5.4%(+4.62)#81 | 5.8%(+4.16)#7,391 |
| 82. | 31637 | 9.9% | 5.4%(+4.59)#82 | 5.8%(+4.13)#7,424 |
| 83. | 30808 | 9.9% | 5.4%(+4.57)#83 | 5.8%(+4.11)#7,456 |
| 84. | 31085 | 9.9% | 5.4%(+4.50)#84 | 5.8%(+4.03)#7,546 |
| 85. | 39845 | 9.8% | 5.4%(+4.49)#85 | 5.8%(+4.03)#7,556 |
| 86. | 31636 | 9.7% | 5.4%(+4.35)#86 | 5.8%(+3.89)#7,747 |
| 87. | 31050 | 9.5% | 5.4%(+4.19)#87 | 5.8%(+3.73)#7,972 |
| 88. | 31648 | 9.5% | 5.4%(+4.13)#88 | 5.8%(+3.67)#8,037 |
| 89. | 31076 | 9.4% | 5.4%(+4.06)#89 | 5.8%(+3.60)#8,127 |
| 90. | 39897 | 9.4% | 5.4%(+4.04)#90 | 5.8%(+3.57)#8,166 |
| 91. | 31525 | 9.4% | 5.4%(+4.03)#91 | 5.8%(+3.57)#8,172 |
| 92. | 31730 | 9.4% | 5.4%(+4.02)#92 | 5.8%(+3.56)#8,188 |
| 93. | 31532 | 9.3% | 5.4%(+3.96)#93 | 5.8%(+3.50)#8,281 |
| 94. | 31790 | 9.3% | 5.4%(+3.96)#94 | 5.8%(+3.50)#8,290 |
| 95. | 31639 | 9.3% | 5.4%(+3.93)#95 | 5.8%(+3.47)#8,322 |
| 96. | 31643 | 9.3% | 5.4%(+3.90)#96 | 5.8%(+3.43)#8,379 |
| 97. | 31037 | 9.2% | 5.4%(+3.89)#97 | 5.8%(+3.43)#8,389 |
| 98. | 30025 | 9.2% | 5.4%(+3.88)#98 | 5.8%(+3.42)#8,407 |
| 99. | 30547 | 9.2% | 5.4%(+3.87)#99 | 5.8%(+3.41)#8,414 |
| 100. | 31553 | 9.2% | 5.4%(+3.83)#100 | 5.8%(+3.37)#8,484 |
Common Questions
What are the Top 10 Zip Codes with the Highest Percentage of Self-Employed / Not Incorporated in Georgia?
Top 10 Zip Codes with the Highest Percentage of Self-Employed / Not Incorporated in Georgia are:
What zip code has the Highest Percentage of Self-Employed / Not Incorporated in Georgia?
31081 has the Highest Percentage of Self-Employed / Not Incorporated in Georgia with 100.0%.
What is the Percentage of Self-Employed / Not Incorporated in the State of Georgia?
Percentage of Self-Employed / Not Incorporated in Georgia is 5.4%.
What is the Percentage of Self-Employed / Not Incorporated in the United States?
Percentage of Self-Employed / Not Incorporated in the United States is 5.8%.